Mind the German-US interest gap


This week, we argue that the euro should strengthen further against the US dollar. This is because the interest rate spread between US and German ten-year Treasury yields has narrowed recently. Furthermore, the US federal administration will shut down until Congress agrees on a plan to reduce the federal budget deficit.
Case of the week: The euro should strengthen further against the USD
This week, the focus is on the United States, where significant state budget deficits have led to parts of the federal administration being shut down since Wednesday, 1 October. To reopen the federal administration, Republicans and Democrats in Congress must reach an agreement on federal budget cuts. The Republican majority in Congress is so small that the budget cut proposal also requires the support of some Democrats. The stock and bond markets have reacted calmly to this, probably because it has become a recurring event the US Congress typically resolves following intense negotiations.
After stabilizing at the turn of the millennium, the US annual budget deficit gradually increased to around 6% of the country's GDP, though it peaked at 15% during the 2021–22 Covid pandemic. One reason President Trump is pressuring Fed Chairman Powell to lower the US interest rate is to minimize the interest paid on the growing federal debt. At the same time, Trump has wanted a weaker USD, probably partly to stimulate job creation in domestic industries.
The yield on German 10-year government bonds also rose significantly in Q3 2025, increasing from 2.64% to 2.94%. This occurred while as the yield on US 10-year government bonds fell from 4.26% to 4.14%. It is possible to trace a connection here, given that the US Purchasing Managers' Index (PMI) has trended downward in recent months (from levels exceeding those of the Eurozone), while the Eurozone PMI has trended upward (from lower levels).
A five-year comparison of German and US 10-year Treasury yields, with the US yield initially at 100
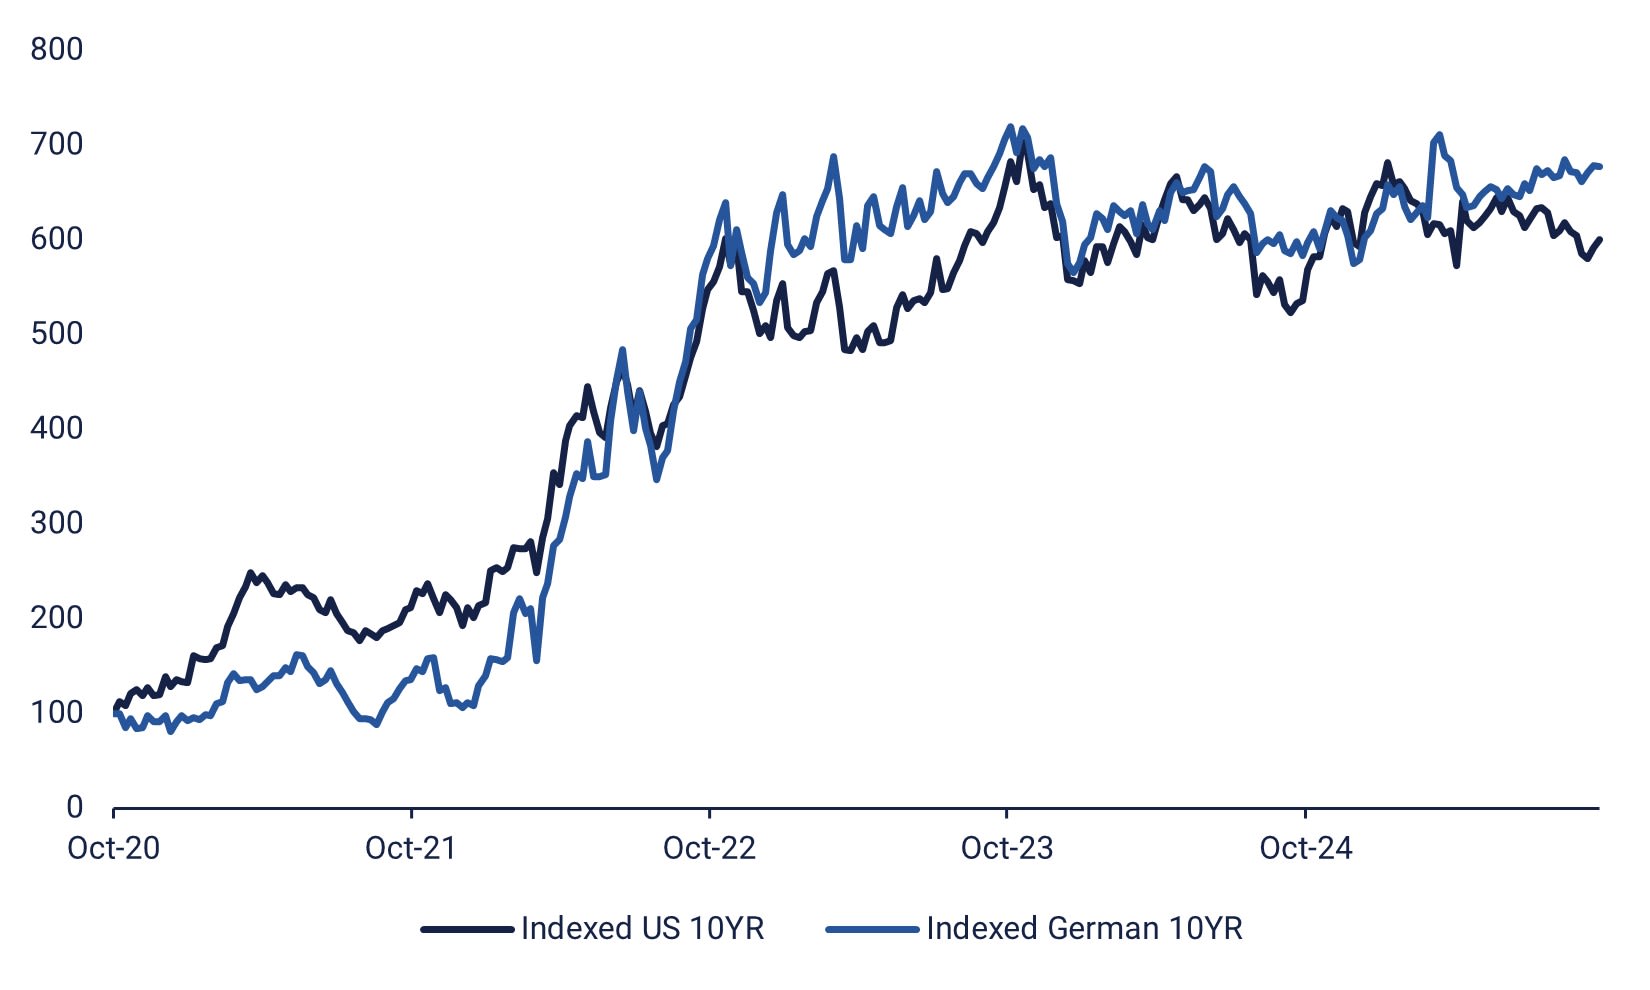
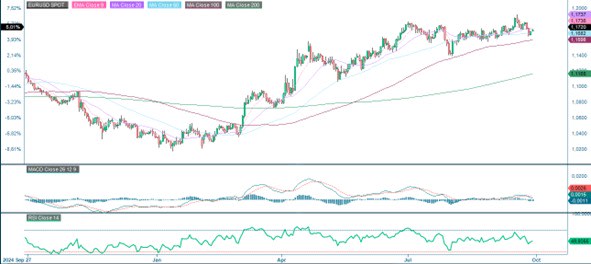
EUR/USD has strengthened from 1.03 on December 31, 2024, to 1.17 on September 30, 2025. This corresponds to a weakening of the USD against the euro of some 12%. However, since 30 June 2025, when the EUR/USD exchange rate was 1.18, the USD has stopped weakening, and the currency pair has levelled off. Given the narrowing interest rate spread between US and German ten-year government bond yields, we argue that the EUR/USD exchange rate should strengthen.
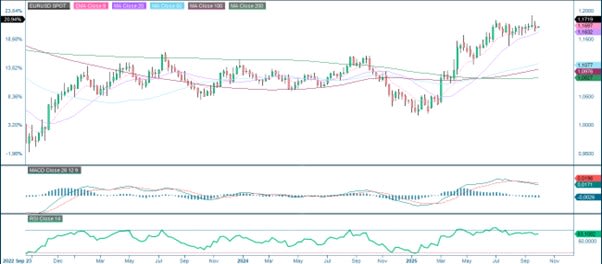
In summary, although German and European PMI figures and ten-year government bond yields have risen during the third quarter of 2025, this has not been reflected in the EUR/USD currency cross. Therefore, we believe that taking a long position in EUR/USD may be an interesting strategy. Furthermore, President Trump does not appear particularly interested in defending the USD as the world's leading currency.
Related Products
EUR/USD, one-year daily chart
EUR/USD, five-year weekly chart
Macro comments
Last week, President Trump threatened to impose sharply increased tariffs on pharmaceutical companies that do not move their production to the US. Meanwhile, tech companies have benefited from promised investments in each other, which are linked to artificial intelligence (AI) research and development (R&D) budgets.
On Wednesday, 1 October, the Swedish company Skistar will publish its interim report. The Chinese stock exchanges are closed on Wednesday. The macro agenda is dominated by the industrial purchasing managers' index in Japan, India, Russia, Sweden, Spain, France, Italy, Germany, the Eurozone, the UK and the US. In Japan, the Q3 Tankan report will be published. Germany will publish its VDMA machinery orders report for August. The Eurozone will publish its CPI for September. India, the world's fourth-largest economy by nominal GDP, will announce its policy rate. In the US, the ADP non-farm employment change for September, construction spending for August and weekly oil inventory figures (Department of Energy) are scheduled for release.
Volvo Cars will announce its September sales figures on Thursday, 2 October. Stock markets in mainland China will also be closed for trading on this day. Shortly before lunchtime, the Eurozone's August unemployment rate will be announced. In the United States, the calendar includes Challenger jobless claims for September, industrial orders for August and initial weekly jobless claims.
On Friday, 3 October, the macroeconomic calendar will focus on the release of September's PMI service figures from Japan, Russia, Sweden, Spain, Italy, France, Germany, the Eurozone, the UK and the US. France will publish its industrial production figures for August, and the Eurozone will publish its producer price index for the same month. The most important figure of the day will be released in the afternoon (European time): US non-farm payrolls. However, it is uncertain whether these statistics will be released, given that the US Federal Administration has recently shut down.
One-month, year-to-date (YTD) and five-year performance of world equity indices, ranked by one-month performance.

Is long DAX the bet to take?
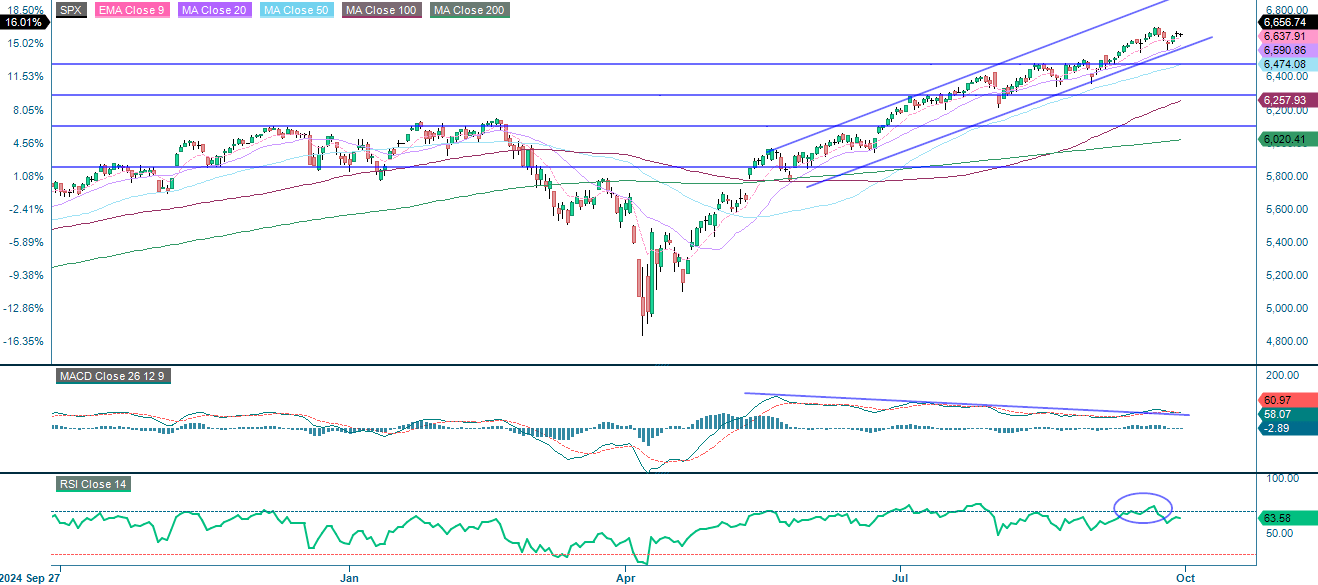
The S&P 500 index remains in a firm uptrend, trading within an ascending channel and above all major moving averages, which highlights strong momentum. Support is found on the downside around 6,590, followed by 6,475. Meanwhile, resistance is found at 6,695 on the upside. However, the MACD indicator has turned cautious once again, suggesting that momentum is fading. A short-term consolidation or pullback is possible.
Related Products
S&P 500 (in USD), one-year daily chart
S&P 500 (in USD), weekly five-year chart

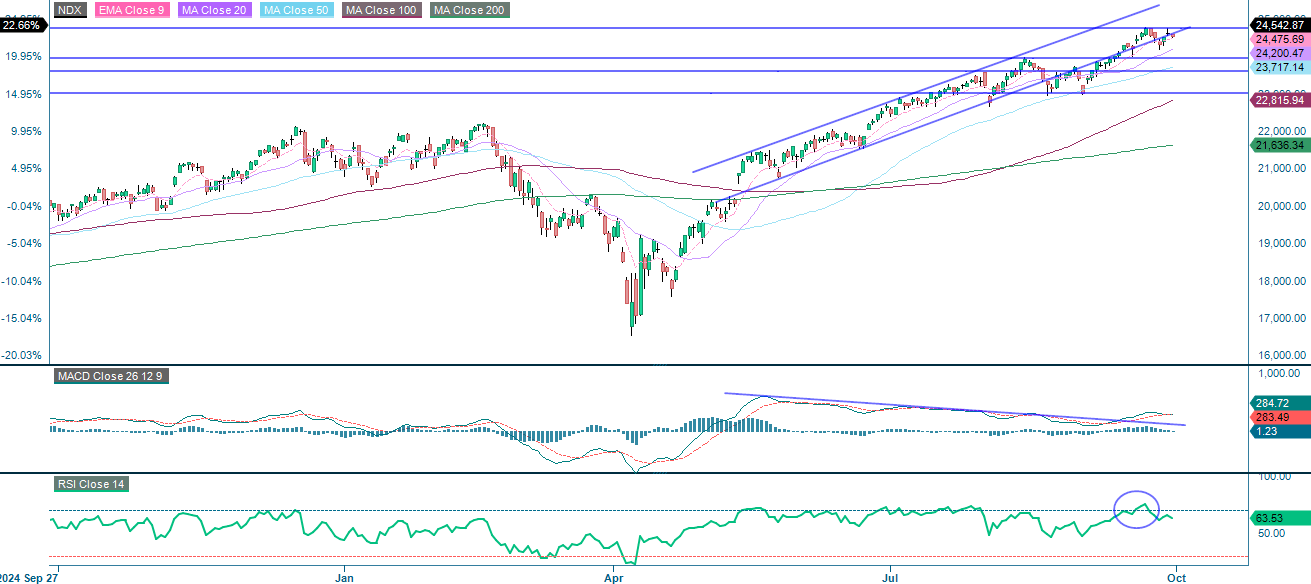
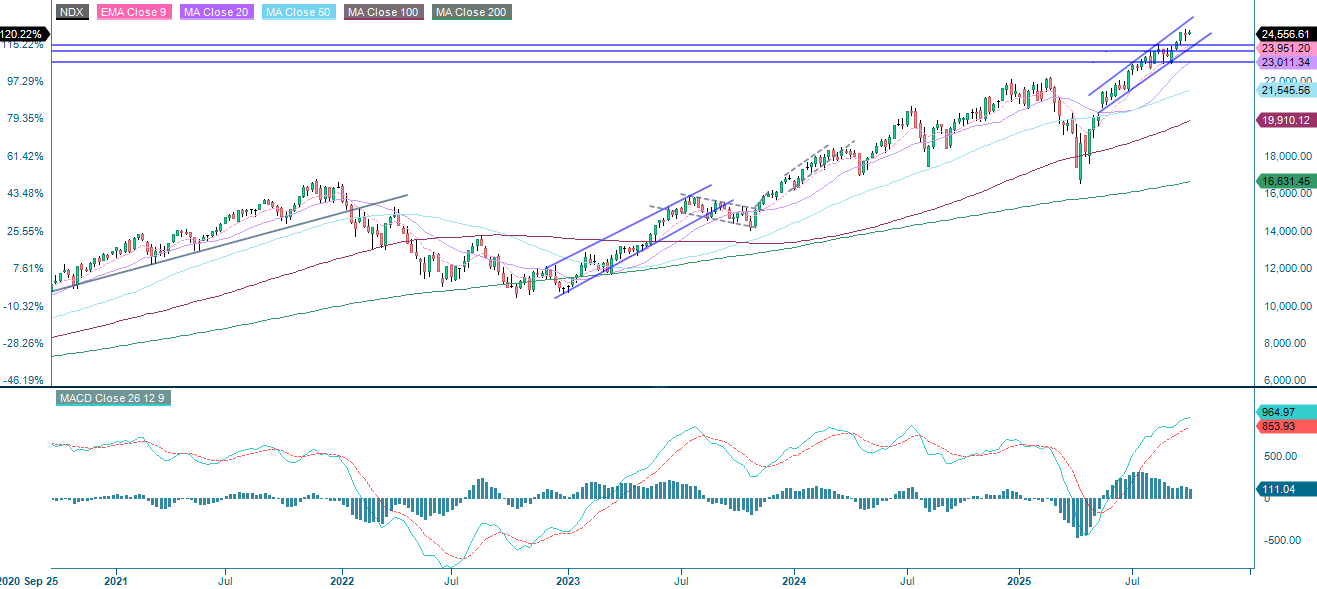
The NASDAQ-100 remains in a firm uptrend. It is trading within a rising channel and above all major moving averages, which confirms strong momentum. Key resistance is located near 24,760, while support sits at 24,200 and 23,945. However, MACD shows a bearish crossover, implying softening momentum. Therefore, a brief consolidation is possible.
Related Products
NASDAQ-100 (in USD), one-year daily chart
NASDAQ-100 (in USD), weekly five-year chart
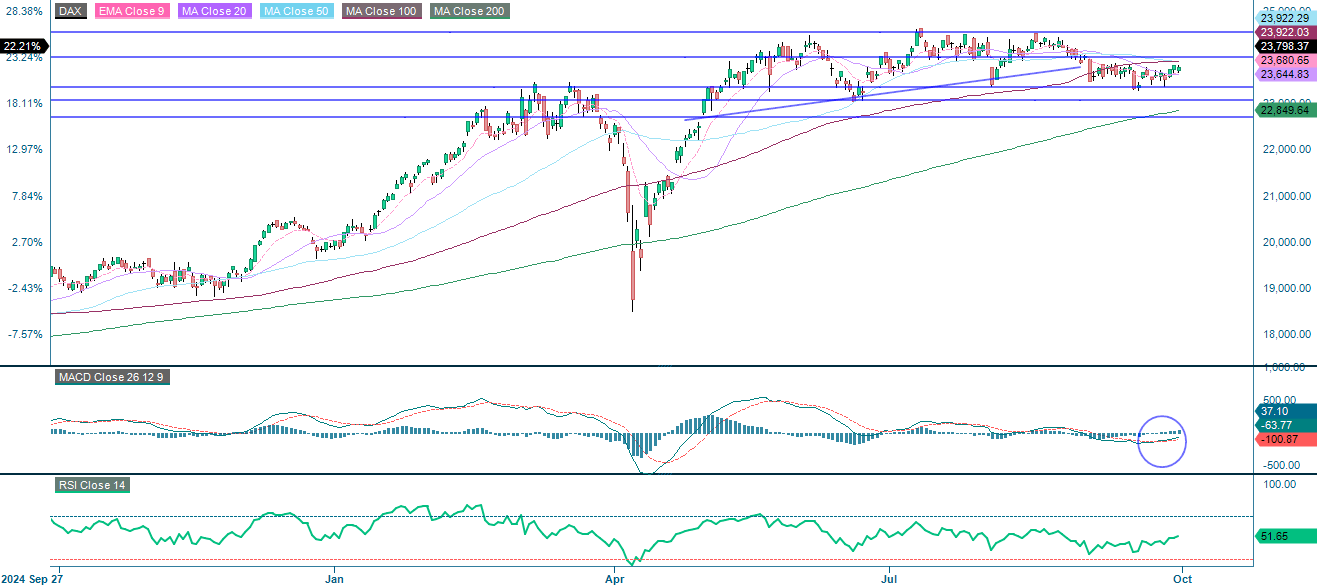
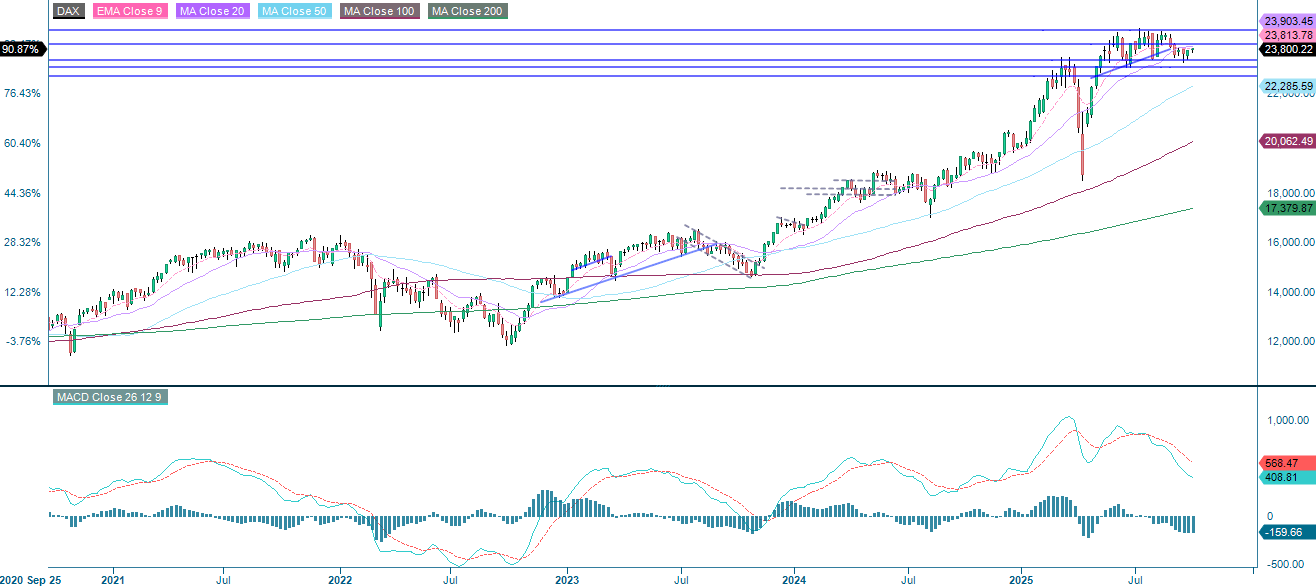
The German DAX is consolidating and trading below the key resistance level of 23,922–24,000, with the next level of resistance at 24,550. Although momentum has faded, a recent bullish MACD crossover suggests the potential for an upward move. Support levels are at 23,645, 23,360 and 23,000 respectively.
Related Products
DAX (in EUR), one-year daily chart
DAX (in EUR), weekly five-year chart
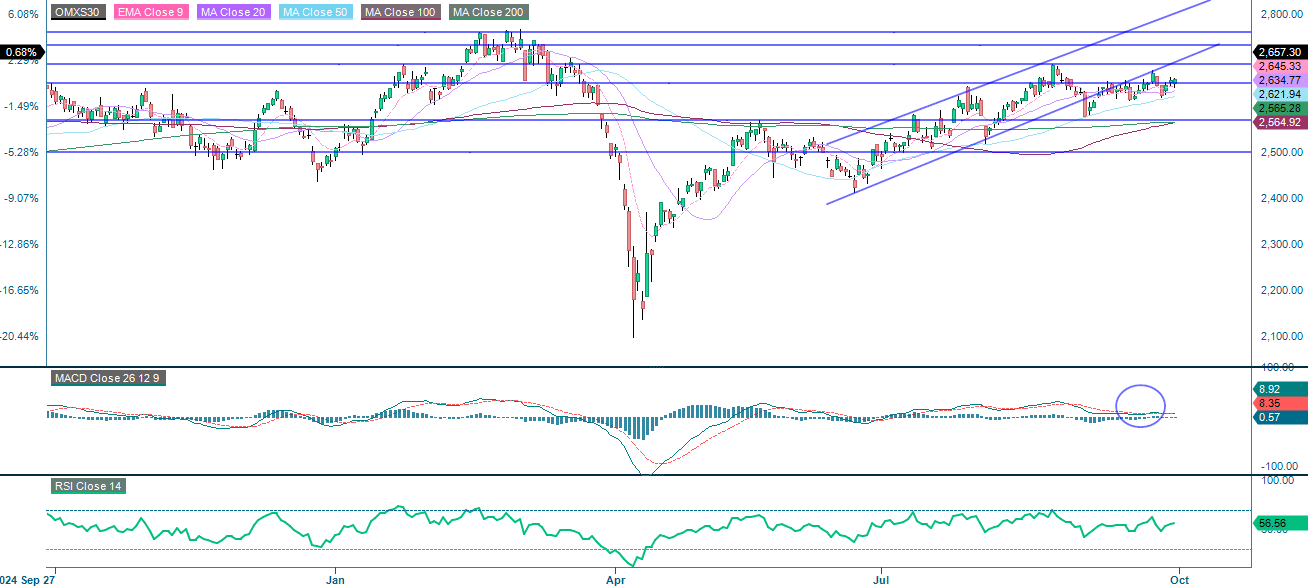
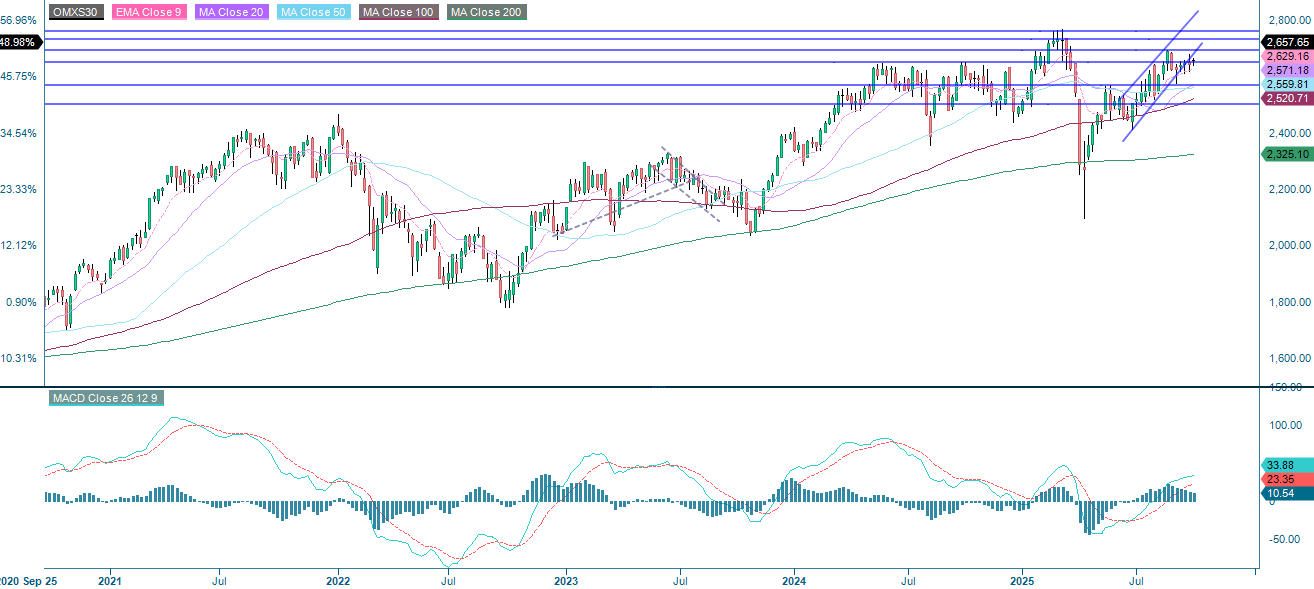
The OMXS30 remains within an upward channel, sitting just below the resistance level of 2,670–2,690. The index is above all major moving averages, which reinforces the bullish structure, and the MACD has turned positive following a fresh bullish crossover. Short-term consolidation is evident, but sustained movement above 2,690 would confirm renewed upward movement. Downside risk appears contained above 2,620 and 2,570.
OMX30 (in SEK), one-year daily chart
OMX30 (in SEK), weekly five-year chart
The full name for abbreviations used in the previous text:
EMA 9: 9-day exponential moving average
Fibonacci: There are several Fibonacci lines used in technical analysis. Fibonacci numbers are a sequence in which each successive number is the sum of the two previous numbers.
MA20: 20-day moving average
MA50: 50-day moving average
MA100: 100-day moving average
MA200: 200-day moving average
MACD: Moving average convergence divergence
Risks
Credit risk of the issuer:
Investors in the products are exposed to the risk that the Issuer or the Guarantor may not be able to meet its obligations under the products. A total loss of the invested capital is possible. The products are not subject to any deposit protection.
Currency risk:
If the product currency differs from the currency of the underlying asset, the value of a product will also depend on the exchange rate between the respective currencies. As a result, the value of a product can fluctuate significantly.
Market risk:
The value of the products can fall significantly below the purchase price due to changes in market factors, especially if the value of the underlying asset falls. The products are not capital-protected
Product costs:
Product and possible financing costs reduce the value of the products.
Risk with leverage products:
Due to the leverage effect, there is an increased risk of loss (risk of total loss) with leverage products, e.g. Bull & Bear Certificates, Warrants and Mini Futures.
External author:
This information is in the sole responsibility of the guest author and does not necessarily represent the opinion of Bank Vontobel Europe AG or any other company of the Vontobel Group. This information is sponsored by Bank Vontobel Europe AG, which may be a counterparty to transactions involving the financial instruments discussed in this information. The further development of the index or a company as well as its share price depends on a large number of company-, group- and sector-specific as well as economic factors. When forming his investment decision, each investor must take into account the risk of price losses. Please note that investing in these products will not generate ongoing income.
The products are not capital protected, in the worst case a total loss of the invested capital is possible. In the event of insolvency of the issuer and the guarantor, the investor bears the risk of a total loss of his investment. In any case, investors should note that past performance and / or analysts' opinions are no adequate indicator of future performance. The performance of the underlyings depends on a variety of economic, entrepreneurial and political factors that should be taken into account in the formation of a market expectation.
Disclaimer:
This information is neither an investment advice nor an investment or investment strategy recommendation, but advertisement. The complete information on the products (securities) mentioned herein, in particular the structure and risks associated with an investment, are described in the base prospectus, together with any supplements, as well as the final terms relating to the securities. The base prospectus and final terms constitute the solely binding sales documents for the products mentioned herein. It is recommended that potential investors read these documents before making any investment decision. The documents and the key information document are published on the website of the issuer, Vontobel Financial Products GmbH, Bockenheimer Landstrasse 24, 60323 Frankfurt am Main, Germany, on https://prospectus.vontobel.com and are available from the issuer free of charge. The approval of the prospectus should not be understood as an endorsement of the securities. The securities are products that are not simple and may be difficult to understand. This information includes or relates to figures of past performance. Past performance is not a reliable indicator of future performance. This information may only be distributed or published in countries where such distribution or publication is permitted by applicable law. As stated in the relevant base prospectus, the distribution of the securities mentioned in this information is subject to restrictions in certain jurisdictions. This advertisement may not be reproduced or redistributed without prior permission by Vontobel.
© Bank Vontobel Europe AG and / or affiliated companies. All rights reserved.