The focus is on the Fed today


Rocket Lab, a fast-growing company that provides products and services for the space ecosystem, has seen strong share price performance. The launch of the Neutron, expected in late 2025, will be a significant milestone for the company. Later today, investors will be focusing on the interest rate decision by the Fed, which could impact the market.
Case of the week: Rocket Lab ready for take-off
Rocket Lab has been met with overwhelmingly positive sentiment from both professional and retail investors. With 70 successful launches to date, the latest of which was in August 2025, Electron is the world’s most frequently launched small orbit launch platform. Despite the stock having climbed considerably over the past couple of months, there is likely to be further growth over the remainder of 2025.
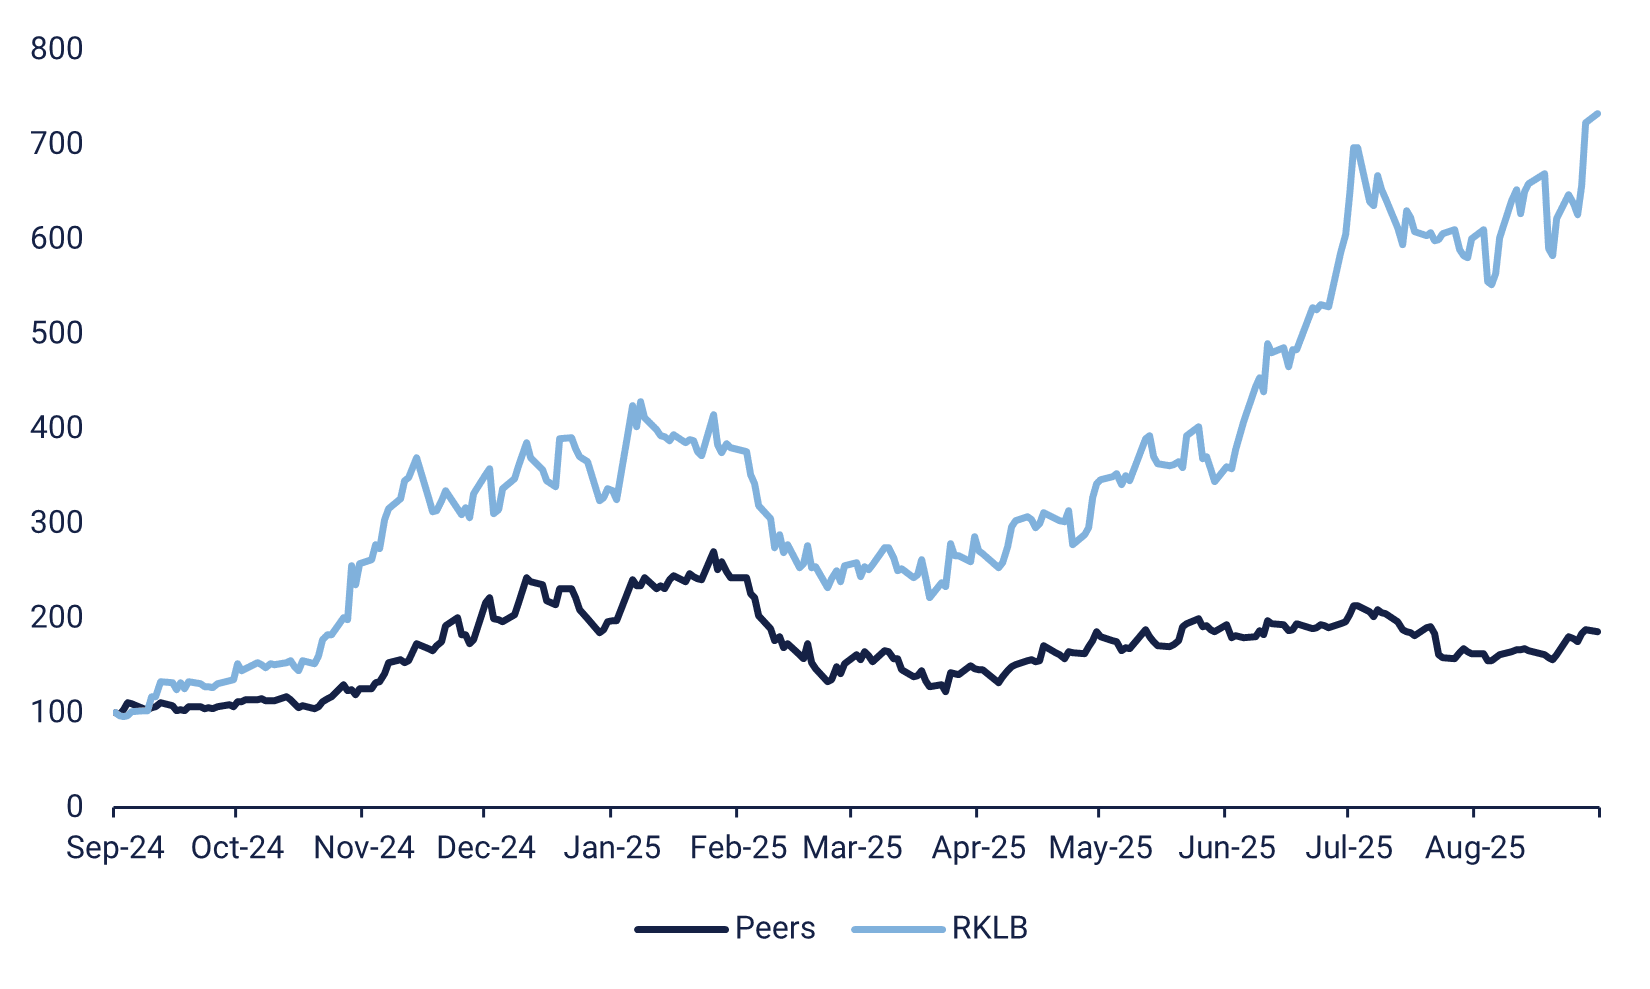
Rocket Lab (ticker symbol: RKLB) is a market leader in launch services, space ecosystem products, and related services. Despite being an underdog competing with SpaceX, RKLB has gained significant momentum in the last year. Since Q4 2024, its share price has increased around tenfold. While many of its peers have also enjoyed investor inflows, RKLB is one of the stocks that has garnered the most attention.
RKLB compared to its peers (indexed share performance since 16 September 2024)
RKLB is generating a relatively reliable flow of profits from its Space Systems business. The Electron rocket was the first that the company designed and built to reach orbit. This small launch vehicle saw its maiden flight in 2017. Its customers are mainly government bodies, although it also has some commercial clients. Other than Electron, Neutron is a significantly larger medium-lift vehicle. Its maiden launch is expected in late 2025, marking an important milestone for the company. Although the test flight will not generate any revenue, the company has already scheduled three commercial launches for 2026, with a further five planned for 2027. Furthermore, as announced in August, RKLB celebrated the official opening of Launch Complex 3, which is intended for use with Neutron. The launch site was completed in just under two years, boosting confidence in RKLB’s ambition to construct a floating launch site for Neutron following a successful test flight.
RKLB's ambition is to become an end-to-end space company. Many acquisitions have been carried out to offer a more comprehensive range of products. This is a prudent strategy given the company's strong share performance, which makes acquiring targets with shares less costly. This boost in performance has been further fueled by retail investors and analysts alike, with consensus targets doubling in just three months.
With clear milestones ahead, such as new launches and effective acquisition opportunities, and ever-improving confidence in the stock from professional and retail investors alike, it is likely that the share's momentum will remain strong for the rest of the year. Postponements to the Neutron launch, or an outright failure to launch, could naturally have a significant impact on the share price. However, the risk of failure appears smaller than the opportunity to invest before take-off.
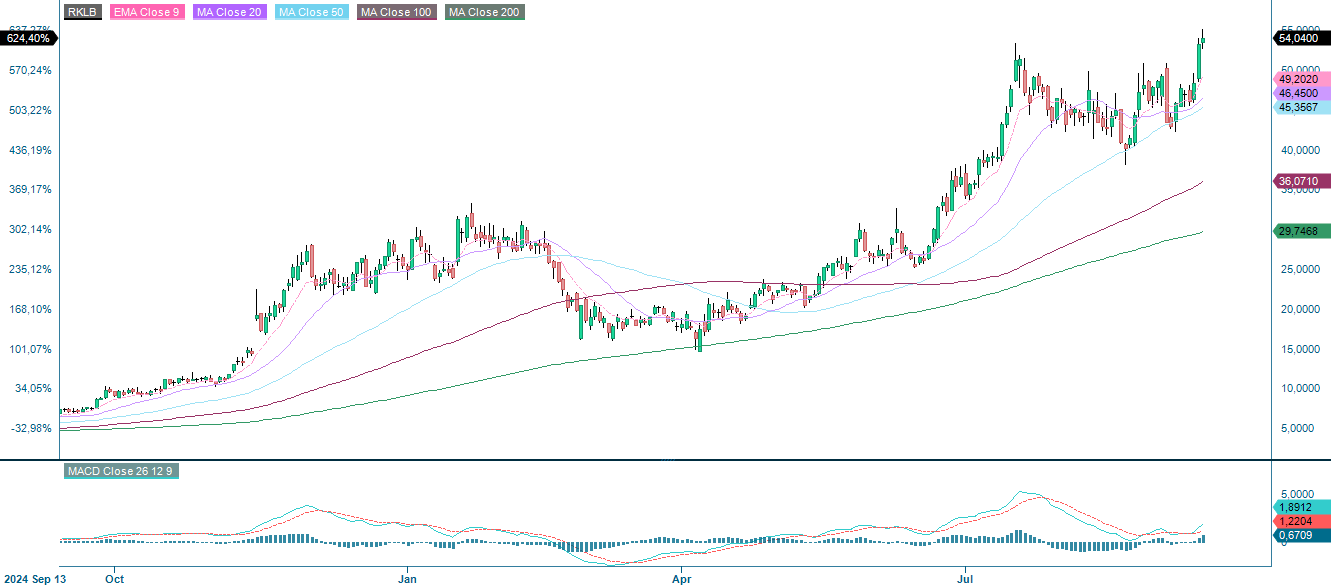
RKLB (in USD), one-year daily chart
RKLB (in USD), five-year weekly chart

Macro comments
On Tuesday, 9 September, IT company Oracle released an encouraging interim report. The report confirmed strong demand for AI, causing Oracle's share price to surge by 36 percent the following day and pulling many other tech stocks up with it. Following the report, Oracle's market value surpassed those of JPMorgan Chase, Visa, and Walmart, establishing Oracle as the tenth most valuable company on U.S. stock exchanges.
The most important event today, Wednesday 17 September, is the interest rate decision by the Fed. Market consensus expects the Fed to lower its policy rate from 4.50% to 4.25%. Wednesday's macroeconomic agenda otherwise begins with Japan's August trade balance. This will be followed by the UK and Eurozone consumer price index figures for August. The U.S. will also release housing construction statistics and weekly oil inventory figures for August (Department of Energy). General Mills are scheduled to release an interim report.
On Thursday, 18 September, the two Swedish companies, Axfood and Mildef, will host their respective Capital Market Days. In terms of macroeconomic news, Japan will report on machinery orders in July. A few hours later, the Eurozone will publish its current account balance and construction production figures for July. The Bank of England will publish its interest rate decision. In the United States, the Philadelphia Fed Index for September and initial weekly jobless claims will be released. There will also be interim reports from FedEx and Lennar. FedEx's report will be interesting as it may provide insight into transport volumes.
On Friday 19 September, the Bank of Japan will make an interest rate announcement, alongside the Japanese Consumer Price Index for August. Turning to Europe, we will see the UK's retail sales figures for August, Germany's producer price index figures for August, and France's industrial expectations figures for September.
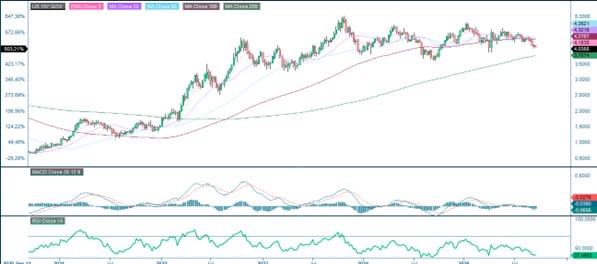
U.S. 10-year Treasury yield (in %), five-year weekly chart
Weakness in Europe, while stocks in the US continue to perform
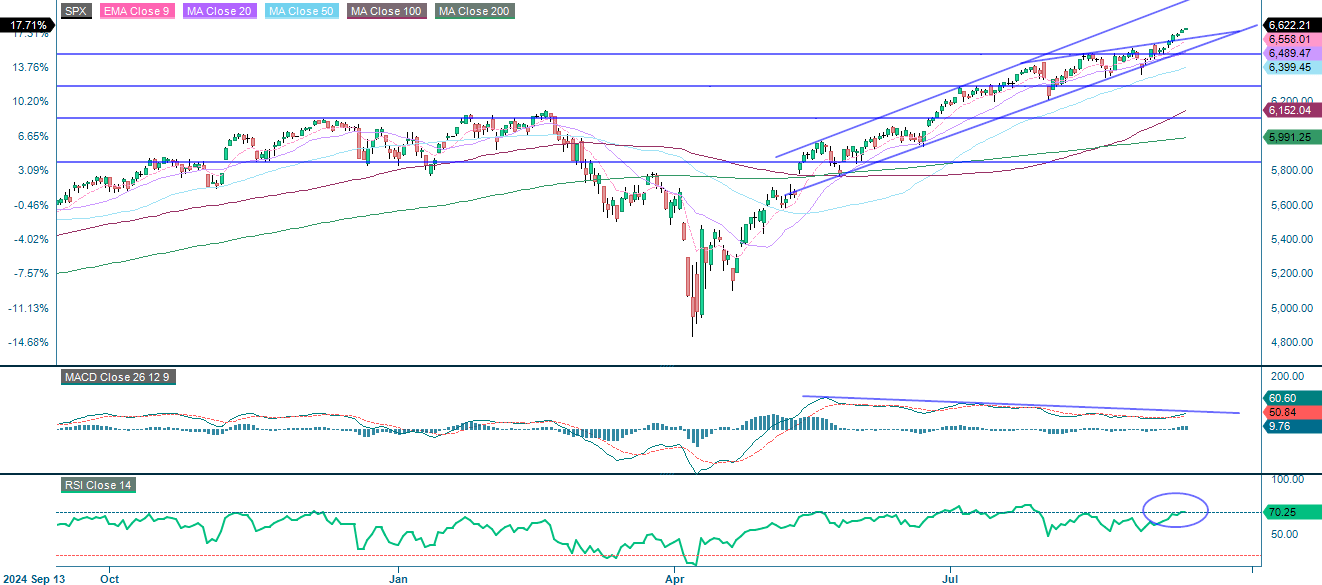
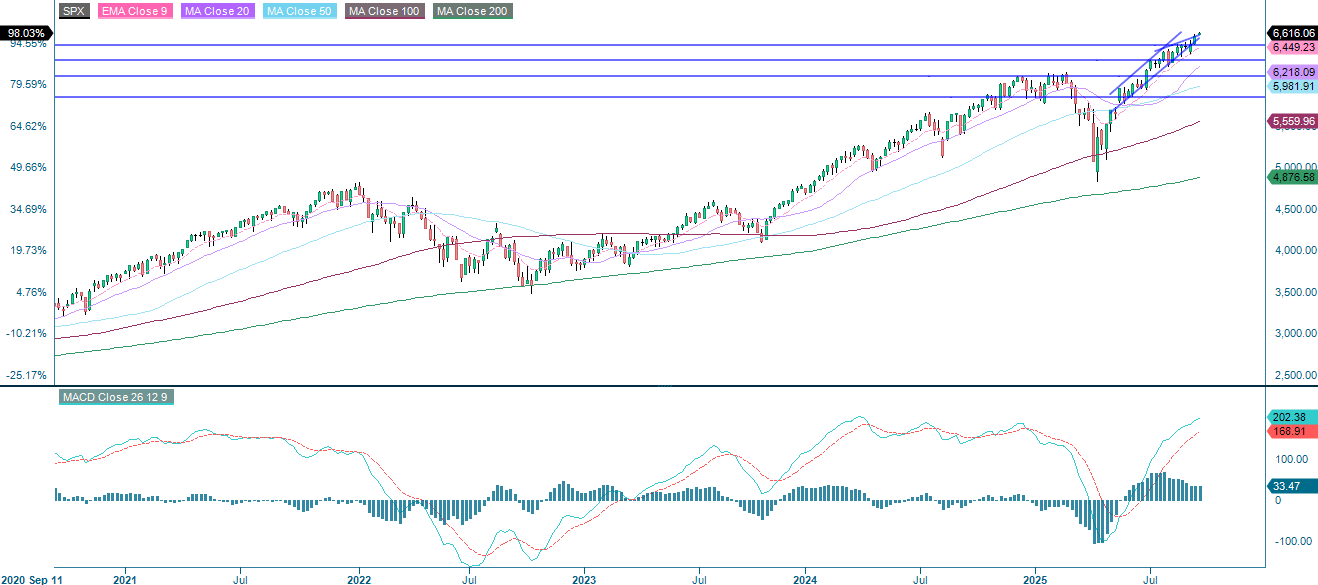
The S&P 500 index remains in a strong uptrend, trading above all key moving averages which are aligned in a bullish manner and providing dynamic support. However, the Relative Strength Index (RSI) is above 70, highlighting overbought conditions and raising the probability of a near-term pause or correction.
Related Products
S&P 500 (in USD), one-year daily chart
S&P 500 (in USD), weekly five-year chart
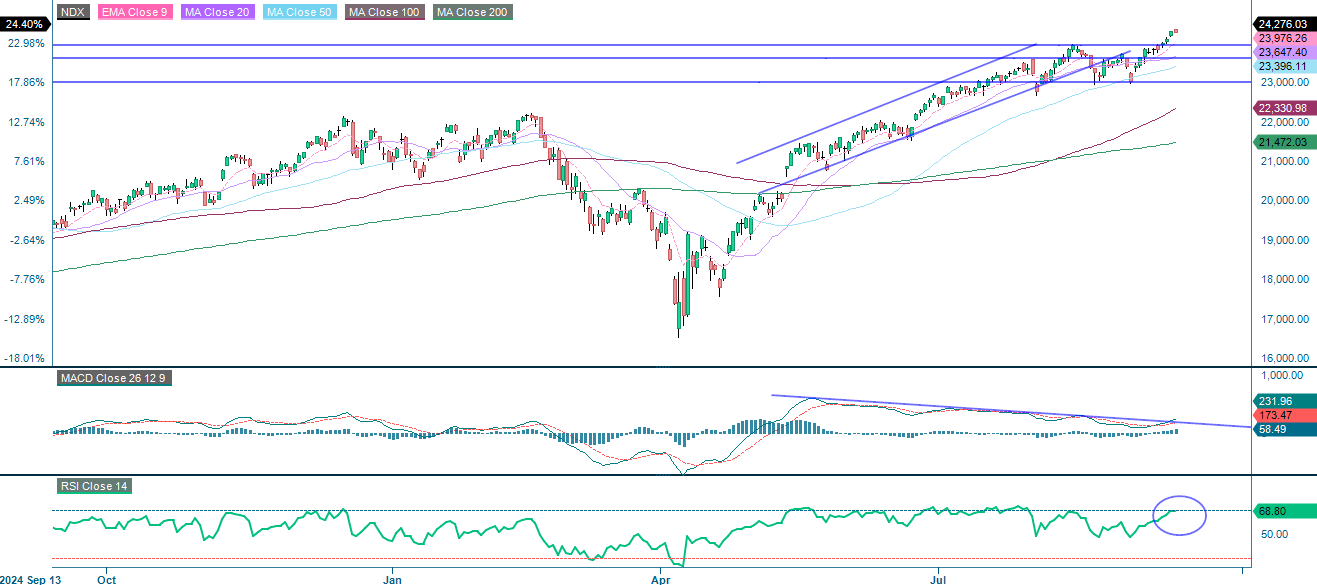
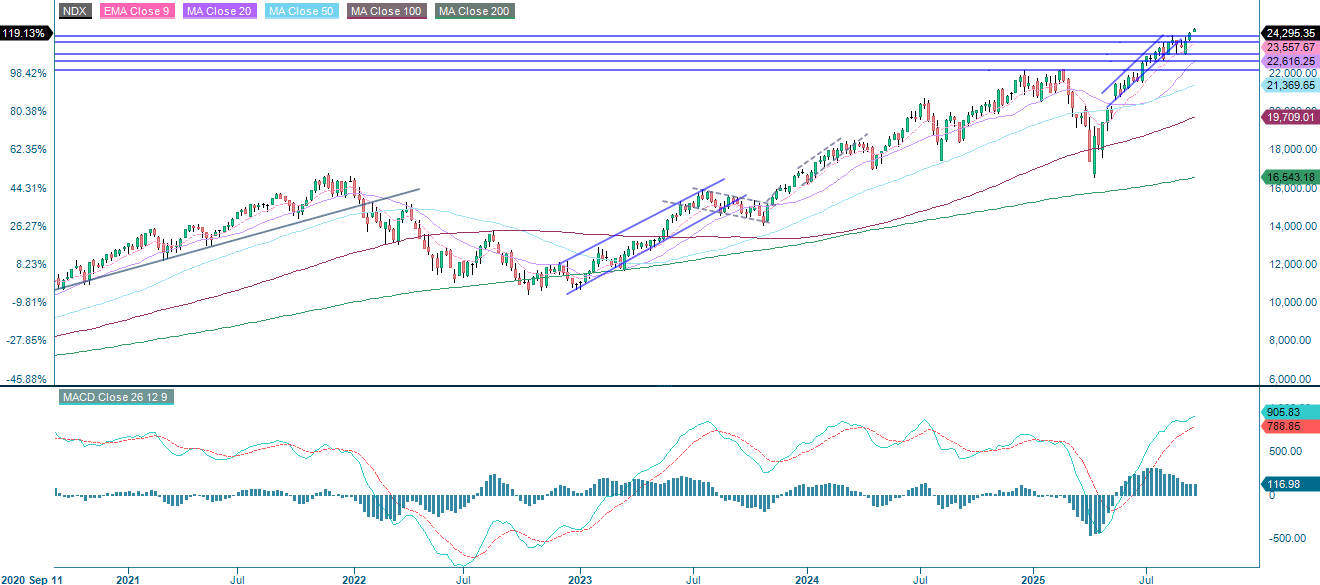
The NASDAQ-100 is in a strong uptrend. It has broken above both horizontal resistance and the upper boundary of its channel. All key moving averages are aligned bullishly and are providing support. However, the RSI is approaching overbought levels, suggesting short-term caution.
Related Products
NASDAQ-100 (in USD), one-year daily chart
NASDAQ-100 (in USD), weekly five-year chart
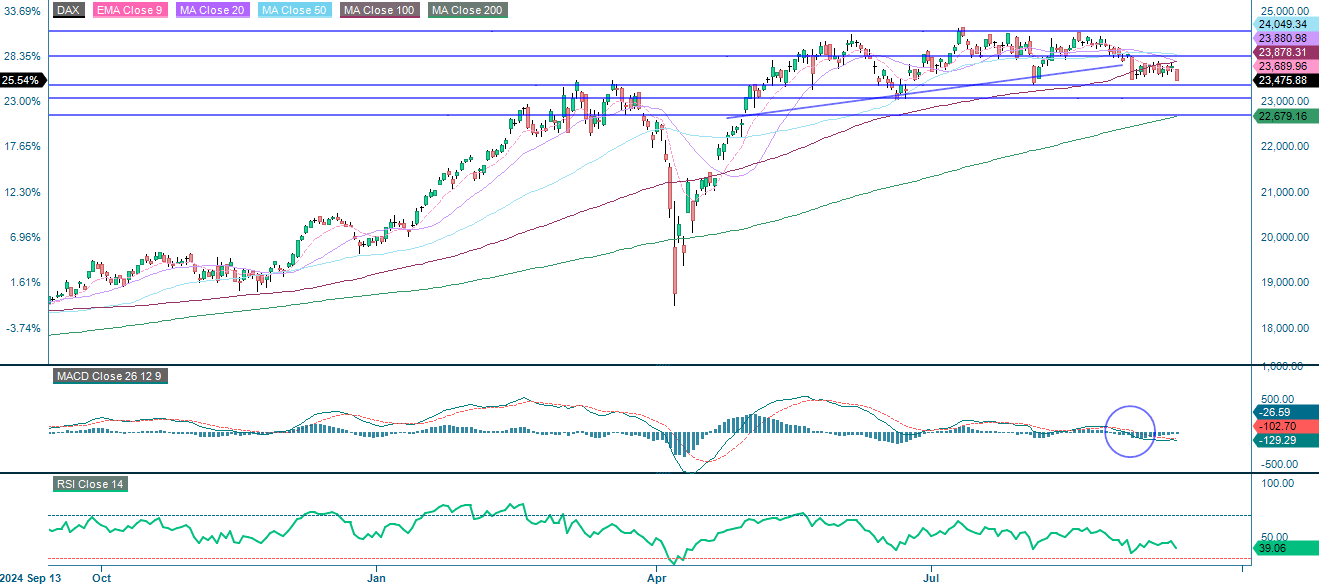
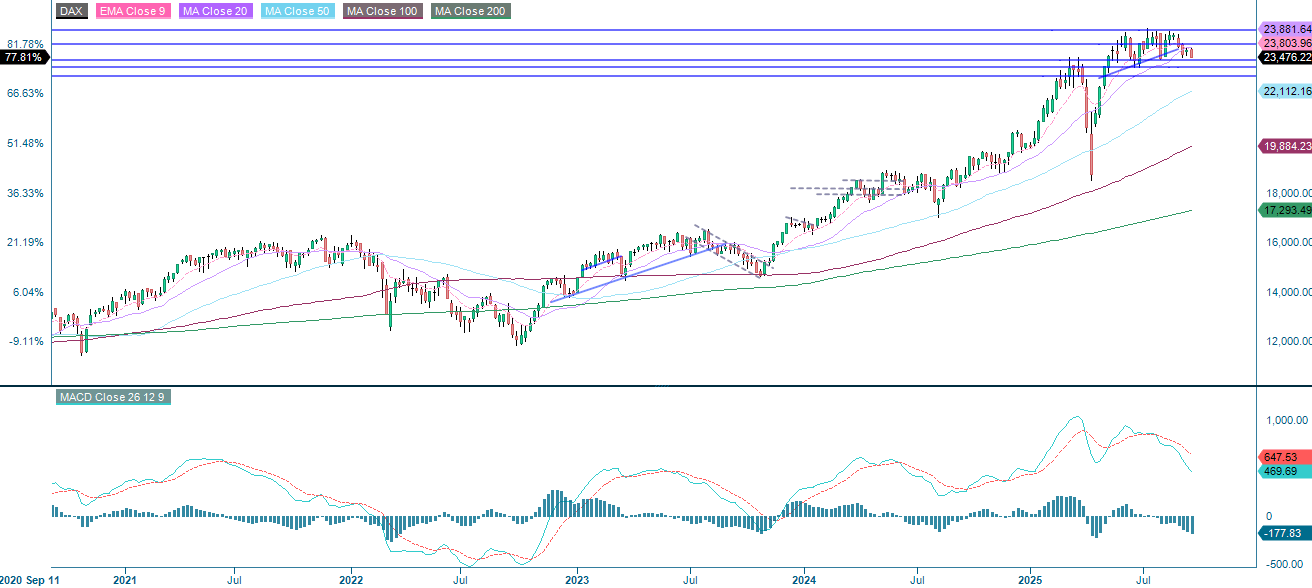
The DAX has weakened and is now trading below the key short- and medium-term moving averages, consolidating near the lower end of its range. Support levels are found at 23,065 and 23,360, and a breakdown could lead to further downside towards 22,660. Momentum signals are bearish, with the MACD in negative territory.
Related Products
DAX (in EUR), one-year daily chart
DAX (in EUR), weekly five-year chart
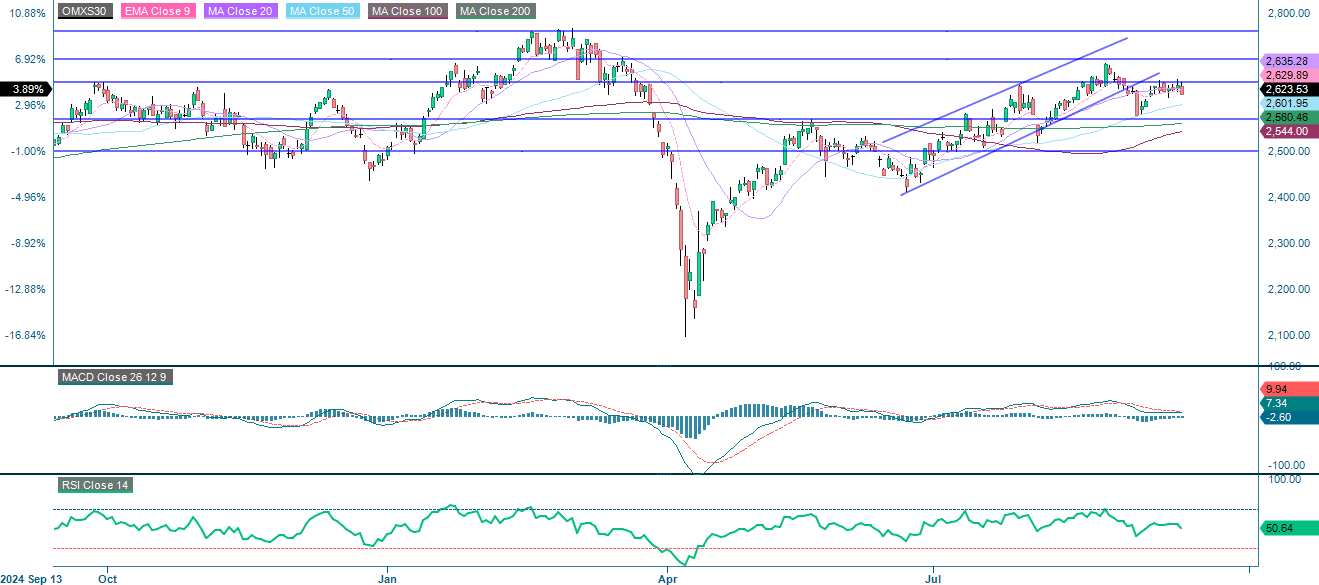
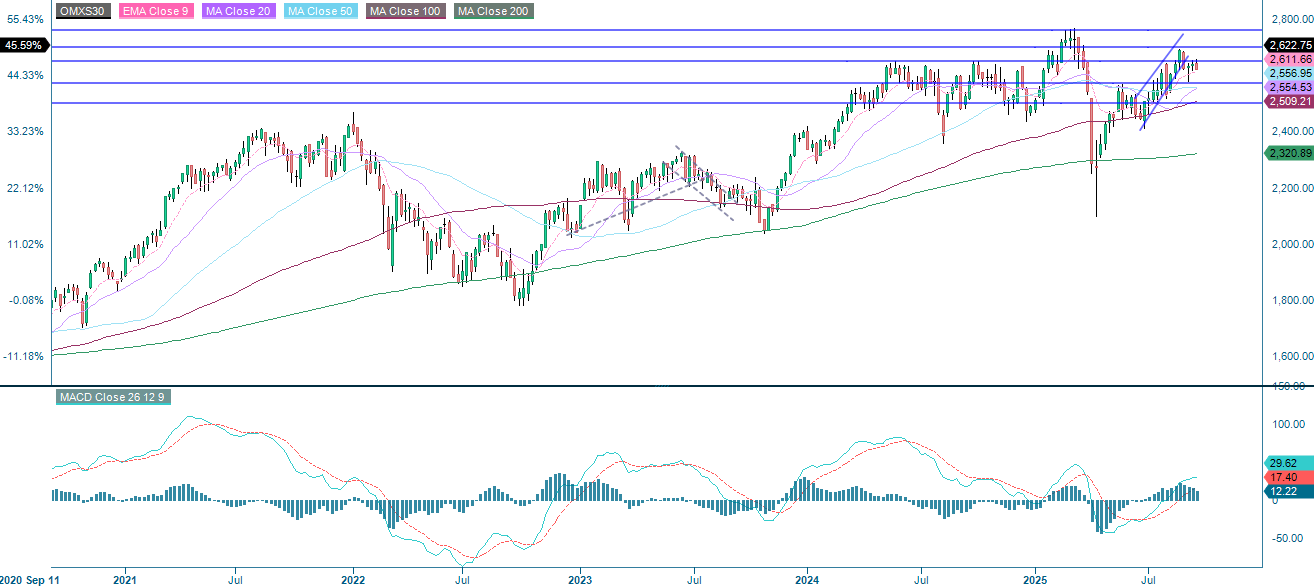
The OMXS30 shifted from a strong uptrend into consolidation after breaking below its rising channel. The price is currently capped by resistance near 2,650, with support around 2,560–2,600. Short- and medium-term moving averages are flattening, while the MACD suggests positive, albeit fading, momentum. Overall, the market is range-bound, and a decisive move above the resistance level or below the support level is likely to determine the next major trend.
OMX30 (in SEK), one-year daily chart
OMX30 (in SEK), weekly five-year chart
The full name for abbreviations used in the previous text:
EMA 9: 9-day exponential moving average
Fibonacci: There are several Fibonacci lines used in technical analysis. Fibonacci numbers are a sequence in which each successive number is the sum of the two previous numbers.
MA20: 20-day moving average
MA50: 50-day moving average
MA100: 100-day moving average
MA200: 200-day moving average
MACD: Moving average convergence divergence
Risks
Credit risk of the issuer:
Investors in the products are exposed to the risk that the Issuer or the Guarantor may not be able to meet its obligations under the products. A total loss of the invested capital is possible. The products are not subject to any deposit protection.
Currency risk:
If the product currency differs from the currency of the underlying asset, the value of a product will also depend on the exchange rate between the respective currencies. As a result, the value of a product can fluctuate significantly.
Market risk:
The value of the products can fall significantly below the purchase price due to changes in market factors, especially if the value of the underlying asset falls. The products are not capital-protected
Product costs:
Product and possible financing costs reduce the value of the products.
Risk with leverage products:
Due to the leverage effect, there is an increased risk of loss (risk of total loss) with leverage products, e.g. Bull & Bear Certificates, Warrants and Mini Futures.
External author:
This information is in the sole responsibility of the guest author and does not necessarily represent the opinion of Bank Vontobel Europe AG or any other company of the Vontobel Group. This information is sponsored by Bank Vontobel Europe AG, which may be a counterparty to transactions involving the financial instruments discussed in this information. The further development of the index or a company as well as its share price depends on a large number of company-, group- and sector-specific as well as economic factors. When forming his investment decision, each investor must take into account the risk of price losses. Please note that investing in these products will not generate ongoing income.
The products are not capital protected, in the worst case a total loss of the invested capital is possible. In the event of insolvency of the issuer and the guarantor, the investor bears the risk of a total loss of his investment. In any case, investors should note that past performance and / or analysts' opinions are no adequate indicator of future performance. The performance of the underlyings depends on a variety of economic, entrepreneurial and political factors that should be taken into account in the formation of a market expectation.
Disclaimer:
This information is neither an investment advice nor an investment or investment strategy recommendation, but advertisement. The complete information on the products (securities) mentioned herein, in particular the structure and risks associated with an investment, are described in the base prospectus, together with any supplements, as well as the final terms relating to the securities. The base prospectus and final terms constitute the solely binding sales documents for the products mentioned herein. It is recommended that potential investors read these documents before making any investment decision. The documents and the key information document are published on the website of the issuer, Vontobel Financial Products GmbH, Bockenheimer Landstrasse 24, 60323 Frankfurt am Main, Germany, on https://prospectus.vontobel.com and are available from the issuer free of charge. The approval of the prospectus should not be understood as an endorsement of the securities. The securities are products that are not simple and may be difficult to understand. This information includes or relates to figures of past performance. Past performance is not a reliable indicator of future performance. This information may only be distributed or published in countries where such distribution or publication is permitted by applicable law. As stated in the relevant base prospectus, the distribution of the securities mentioned in this information is subject to restrictions in certain jurisdictions. This advertisement may not be reproduced or redistributed without prior permission by Vontobel.
© Bank Vontobel Europe AG and / or affiliated companies. All rights reserved.