High yield, buybacks, and weaker USD are good for H&M


The past month has been marked by a recovery in industrial stocks in Europe and the US stock exchanges. We may enter a consolidation phase, favouring stocks with high, stable dividends. One such stock is H&M, where the recent rebound in USD should imply an improved result.
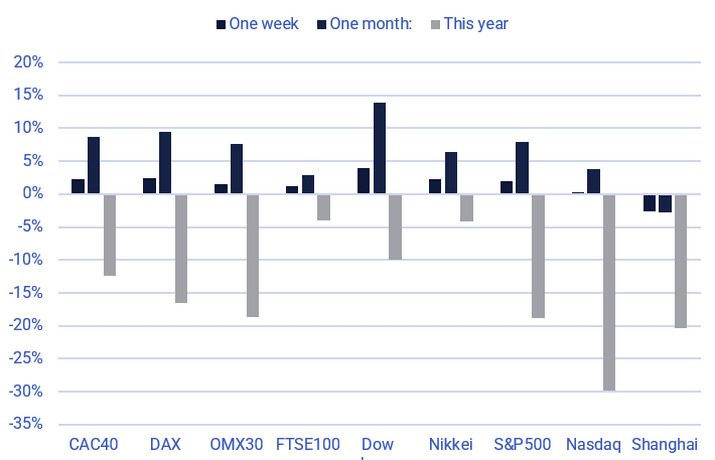
There has been robust momentum for industrial stocks on the European exchanges (Paris, Frankfurt, and Stockholm), but also the Dow Jones index in the US. Meanwhile, the Nasdaq has had a more challenging time recovering. The rising interest rate trend in the US is hampering the valuation of growth stocks.
The outcome in the Q3 2022 report has been good, with about 70% better results from the S&P500 companies, while the corresponding figure for the OMXSPI is about 60% better than expected. However, the margin by which US companies have beaten analysts' earnings expectations has been limited to around 2%, historically low. Corporate guidance for Q4 2022 is also predominantly negative. We are heading into an economic slowdown; the question is whether it will be a recession or not.
Significant stock indices performance in one week, one month and this year
Another trend is that companies are starting to lay off staff to bring profitability up to previous levels. As employment declines, central banks, with the Fed in the front, may start approaching the end of their rate-hike cycle. Some indication may be given on Friday, 4 November, when US Non-Farm Payrolls are released. Consensus estimates are at 200 thousand additional jobs in October, compared to 265 thousand new jobs in September.
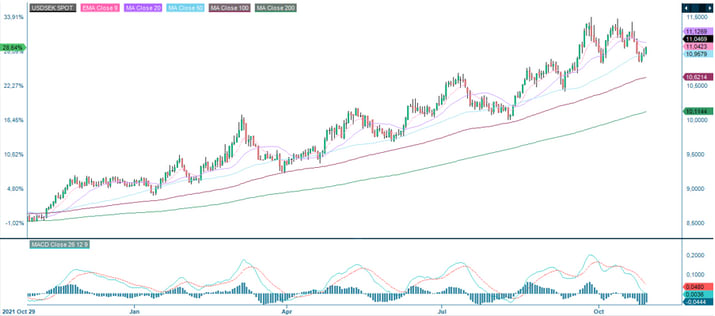
The USD has started to decline from high levels. One company that benefits from a weaker USD due to lower purchasing costs is H&M. The company only earns around 15% of its revenues from the United States. Meanwhile, the USD is H&Ms most crucial currency for purchasing goods, together with the EUR. With a dividend of SEK 6:50 per share, the H&M share yields about 5.8% at the current price level. This is almost comparable to a yield on an investment-grade bond. H&M also buys back its shares according to a buyback program. Last week, the company bought back 1.27 million H&M shares from the market.
All these factors should support the H&M share at current, historically low-price levels. The main risk for further share price decline is linked to the European retail demand being relatively weak.
SEK/USD, one-year-chart
H&M (in SEK), a daily one-year share price chart

The H&M share has risen since it bottomed at just below SEK 100 on 29 September. Should the H&M share continue its way up, resistance is encountered at price levels, first around SEK 117 per and then around SEK 124.
H&M (in SEK), a weekly five-year share price chart

The full name for abbreviations used in the previous text:
EMA 9: 9-day exponential moving average
Fibonacci: There are several Fibonacci lines used in technical analysis. Fibonacci numbers are a sequence of numbers in which each successive number is the sum of the two previous numbers.
MA20: 20-day moving average
MA50: 50-day moving average
MA100: 100-day moving average
MA200: 200-day moving average
MACD: Moving average convergence divergence
Risks
External author:
This information is in the sole responsibility of the guest author and does not necessarily represent the opinion of Bank Vontobel Europe AG or any other company of the Vontobel Group. This information is sponsored by Bank Vontobel Europe AG, which may be a counterparty to transactions involving the financial instruments discussed in this information. The further development of the index or a company as well as its share price depends on a large number of company-, group- and sector-specific as well as economic factors. When forming his investment decision, each investor must take into account the risk of price losses. Please note that investing in these products will not generate ongoing income.
The products are not capital protected, in the worst case a total loss of the invested capital is possible. In the event of insolvency of the issuer and the guarantor, the investor bears the risk of a total loss of his investment. In any case, investors should note that past performance and / or analysts' opinions are no adequate indicator of future performance. The performance of the underlyings depends on a variety of economic, entrepreneurial and political factors that should be taken into account in the formation of a market expectation.
Disclaimer:
This information is neither an investment advice nor an investment or investment strategy recommendation, but advertisement. The complete information on the products (securities) mentioned herein, in particular the structure and risks associated with an investment, are described in the base prospectus, together with any supplements, as well as the final terms relating to the securities. The base prospectus and final terms constitute the solely binding sales documents for the products mentioned herein. It is recommended that potential investors read these documents before making any investment decision. The documents and the key information document are published on the website of the issuer, Vontobel Financial Products GmbH, Bockenheimer Landstrasse 24, 60323 Frankfurt am Main, Germany, on https://prospectus.vontobel.com and are available from the issuer free of charge. The approval of the prospectus should not be understood as an endorsement of the securities. The securities are products that are not simple and may be difficult to understand. This information includes or relates to figures of past performance. Past performance is not a reliable indicator of future performance. This information may only be distributed or published in countries where such distribution or publication is permitted by applicable law. As stated in the relevant base prospectus, the distribution of the securities mentioned in this information is subject to restrictions in certain jurisdictions. This advertisement may not be reproduced or redistributed without prior permission by Vontobel.
© Bank Vontobel Europe AG and / or affiliated companies. All rights reserved.