Signs of recovery, but no clear trend yet


This week's case is silver, which has significantly underperformed gold in recent weeks. The S&P500 and the NASDAQ gained 5.6% and 8.3% respectively last week on softer tariff talk from the White House. The S&P500 Q1 earnings season has so far delivered 73% better than expected results. From a technical analysis perspective, no clear trend has yet emerged for the major equity indices.
Case of the week: All that glitters is not gold
The price of gold has increased by around 30 per cent in USD terms in 2025, reaching an all-time high of USD 3,500 per ounce (oz) before falling slightly over the past week. One main driver is the significant increase in policy under the new Trump administration, which has made the outlook for Federal Reserve monetary policy uncertain. Consequently, investor appetite for US assets has decreased, pushing up not only the price of gold, but also the exchange rates of other currencies.
While silver often closely follows the development of the gold price, it has not performed in the same way this year. In fact, it has yet to reach the 2024 high of around USD 35 per oz. Following the announcement of Trump tariffs on 2 April 2025, known as 'Liberation Day', the silver price fell dramatically. This is probably because silver is more exposed to industrial use. For instance, according to the Silver Institute, solar energy production accounts for around 20 per cent of demand. At the same time, mine production has been in decline in recent years, according to the same source, and the silver market has been in deficit for some time.
Gold and silver ratio, five-year daily chart

Is it time for silver to close the performance gap with gold? The ratio of the gold to silver price, currently standing at around 108, is approaching the levels observed during the pandemic. It is also significantly above the MA200 level of around 88. Silver may now be a more attractive investment than gold, which could be considered an overcrowded market at the moment.
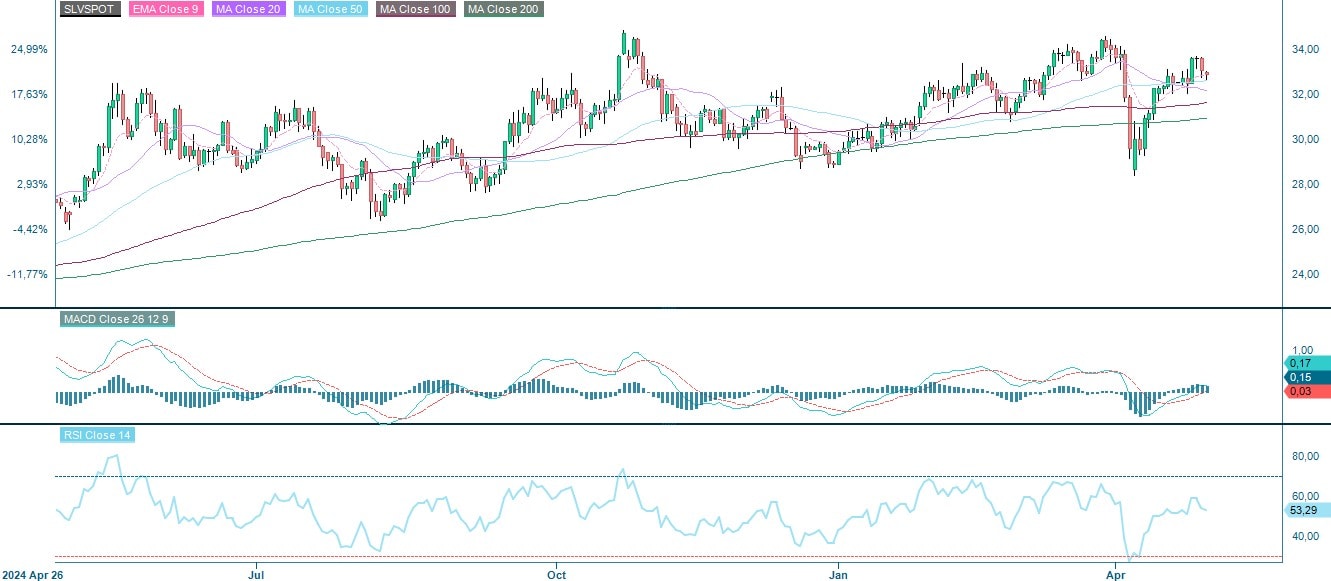
Silver spot price (USD/oz), one-year daily chart
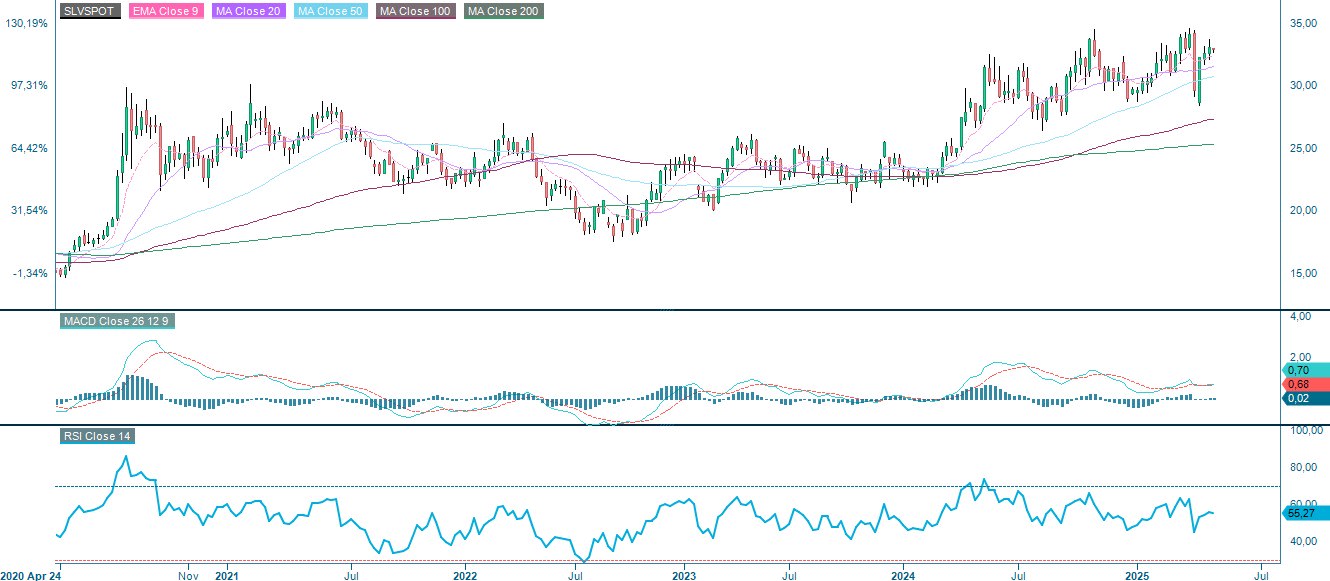
Silver spot price (USD/oz), weekly five-year chart
Macro comments
The S&P 500 and the NASDAQ gained 5.6% and 8.3%, respectively, last week. The White House's softer tone on tariffs has lifted stocks. For investors outside the US, the decline in the value of their global equity holdings is now primarily the result of a weakening USD.
For Q1 2025, with 36% of S&P 500 companies reporting by 25 April 2025, 73% have reported positive EPS (Earnings per Share) surprises and 64% have reported positive revenue surprises. The best performing S&P 500 sectors are Health Care, Information Technology and Communication Services with 89%, 81% and 80% of Q1 2025 earnings beating estimates respectively. As of Friday 25 April, 40 Swedish OMX companies had reported their Q1 2025 results. In terms of operating results, 53% of these reports were better than expected and 50% exceeded sales expectations.
On Wednesday, 30 April, interim reports from the following companies are expected: In the Nordic region, Handelsbanken, Hexagon, Evolution, DSV, Aker Solutions, Elkem and Kone; in the rest of Europe, Barclays, Mercedes-Benz, UBS and Volkswagen; and in the US, Automatic Data Processing, Caterpillar, Microsoft and Qualcomm. The macroeconomic agenda begins with Japan's industrial production figures for March and China's Caixin industrial PMI (Purchasing Mangers’ Index) for April. Q1 GDP (Gross Domestic Product) and April CPI (Consumer Price Index) figures from France and Italy are expected. Germany will release March retail sales and import prices, as well as April CPI and unemployment figures. A combined Q1 GDP figure will be released for the eurozone. From the US, following data will be received: the ADP (Automatic Data Processing) private employment report for April, private consumption and inflation (PCE) figures for March, a Q1 GDP forecast, the Chicago PMI report for April, figures on home purchases under contract for March and weekly oil inventory figures (Department of Energy).
US nonfarm payrolls, May 2023-April 2025 (actual and forecast)

Thursday, 1 May, is a public holiday in many countries, meaning stock exchanges in Europe, China and some other markets will be closed. Major US companies scheduled to report on Thursday include Amgen, Apple, Amazon, Eli Lilly, Mastercard, McDonald's, Southern Company and Stryker. Japan's April industrial PMI will be published on Thursday, along with an interest rate announcement from the Bank of Japan. The April industrial PMI will also be published in Canada and the US. The US will also release April's Challenger job layoff statistics and initial weekly jobless claims.
On Friday 2 May, Danske Bank in the Nordic region, as well as Berkshire Hathaway and Exxon Mobil in the US, are due to report. Friday's macroeconomic agenda is dominated by the release of April's industrial PMI figures from India, Sweden, Spain, Italy, France, Germany and the eurozone. Eurozone unemployment figures for March and CPI figures for April will also be released. From the US, the non-farm payroll report for April and the industrial orders report for March are expected.
Is DAX the one to bet on?
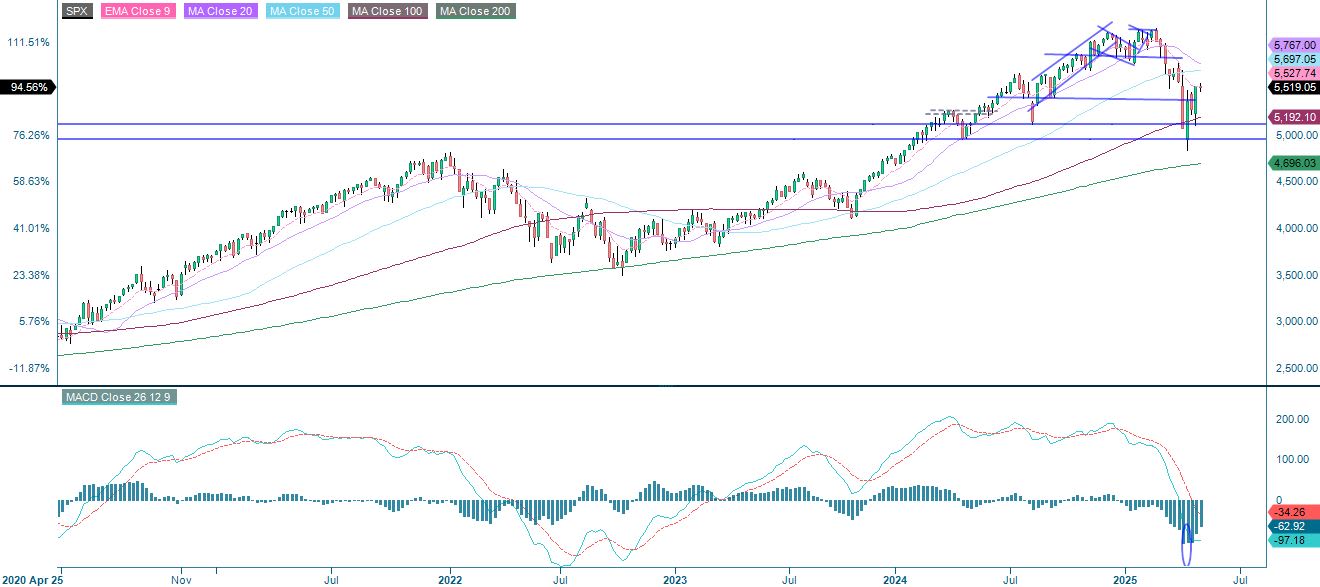
The S&P is currently trading close to the resistance level of 5,500. Momentum is negative but improving, and if there is a clear break on the upside, 5,700 will become the target price. However, the market is still uncertain and there is no clear trend. If the index breaks below 5,500, it may quickly approach 5,400.
Related Products
S&P 500 (in USD), one-year daily chart

S&P 500 (in USD), weekly five-year chart
The NASDAQ is trading above the previous resistance level, which is now acting as support. Momentum remains negative but is improving. The next step could be a break above the MA50, which is currently at 19,625, and levels around or just below 20,000.
NASDAQ-100 (in USD), one-year daily chart

NASDAQ-100 (in USD), weekly five-year chart

The OMXS30 is trading above its previous support/resistance levels. Although momentum remains negative, there are signs of improvement. The next resistance level is around 2,475 on the upside. If the index falls below 2,400, the next support level is near 2,285. Overall, the risk/reward profile indicates that this is a prudent move.
OMXS30 (in SEK), one-year daily chart

OMXS30 (in SEK), weekly five-year chart

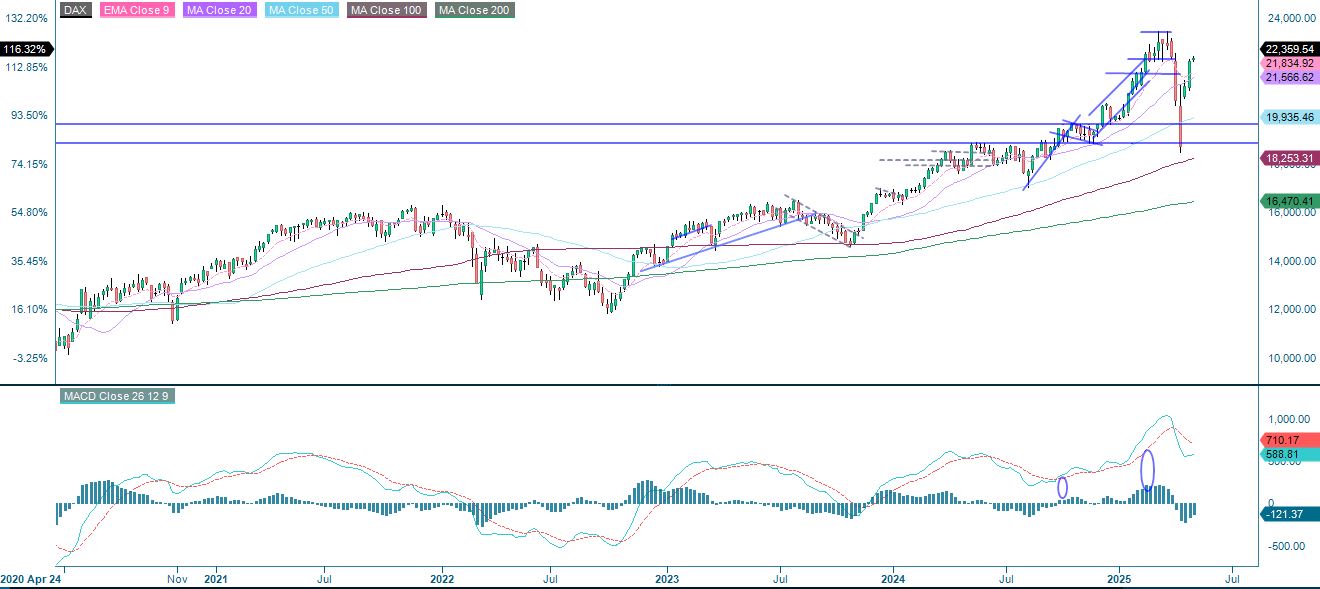
The DAX is currently trading close to, or just above, the 22,300 resistance level. Meanwhile, the MACD indicator has generated a buy signal. The next level on the upside is made up of previous highs around 23,300. A break below the MA50 at around 22,200 and 21,700 could be next. The risk/reward ratio therefore favours a long position.
DAX (in EUR), one-year daily chart

DAX (in EUR), weekly five-year chart
The full name for abbreviations used in the previous text:
EMA 9: 9-day exponential moving average
Fibonacci: There are several Fibonacci lines used in technical analysis. Fibonacci numbers are a sequence in which each successive number is the sum of the two previous numbers.
MA20: 20-day moving average
MA50: 50-day moving average
MA100: 100-day moving average
MA200: 200-day moving average
MACD: Moving average convergence divergence
Risks
Credit risk of the issuer:
Investors in the products are exposed to the risk that the Issuer or the Guarantor may not be able to meet its obligations under the products. A total loss of the invested capital is possible. The products are not subject to any deposit protection.
Currency risk:
If the product currency differs from the currency of the underlying asset, the value of a product will also depend on the exchange rate between the respective currencies. As a result, the value of a product can fluctuate significantly.
External author:
This information is in the sole responsibility of the guest author and does not necessarily represent the opinion of Bank Vontobel Europe AG or any other company of the Vontobel Group. This information is sponsored by Bank Vontobel Europe AG, which may be a counterparty to transactions involving the financial instruments discussed in this information. The further development of the index or a company as well as its share price depends on a large number of company-, group- and sector-specific as well as economic factors. When forming his investment decision, each investor must take into account the risk of price losses. Please note that investing in these products will not generate ongoing income.
The products are not capital protected, in the worst case a total loss of the invested capital is possible. In the event of insolvency of the issuer and the guarantor, the investor bears the risk of a total loss of his investment. In any case, investors should note that past performance and / or analysts' opinions are no adequate indicator of future performance. The performance of the underlyings depends on a variety of economic, entrepreneurial and political factors that should be taken into account in the formation of a market expectation.
Market risk:
The value of the products can fall significantly below the purchase price due to changes in market factors, especially if the value of the underlying asset falls. The products are not capital-protected
Product costs:
Product and possible financing costs reduce the value of the products.
Risk with leverage products:
Due to the leverage effect, there is an increased risk of loss (risk of total loss) with leverage products, e.g. Bull & Bear Certificates, Warrants and Mini Futures.
Disclaimer:
This information is neither an investment advice nor an investment or investment strategy recommendation, but advertisement. The complete information on the products (securities) mentioned herein, in particular the structure and risks associated with an investment, are described in the base prospectus, together with any supplements, as well as the final terms relating to the securities. The base prospectus and final terms constitute the solely binding sales documents for the products mentioned herein. It is recommended that potential investors read these documents before making any investment decision. The documents and the key information document are published on the website of the issuer, Vontobel Financial Products GmbH, Bockenheimer Landstrasse 24, 60323 Frankfurt am Main, Germany, on https://prospectus.vontobel.com and are available from the issuer free of charge. The approval of the prospectus should not be understood as an endorsement of the securities. The securities are products that are not simple and may be difficult to understand. This information includes or relates to figures of past performance. Past performance is not a reliable indicator of future performance. This information may only be distributed or published in countries where such distribution or publication is permitted by applicable law. As stated in the relevant base prospectus, the distribution of the securities mentioned in this information is subject to restrictions in certain jurisdictions. This advertisement may not be reproduced or redistributed without prior permission by Vontobel.
© Bank Vontobel Europe AG and / or affiliated companies. All rights reserved.