Chinese stimulus to give the AUD a kangaroo jump?

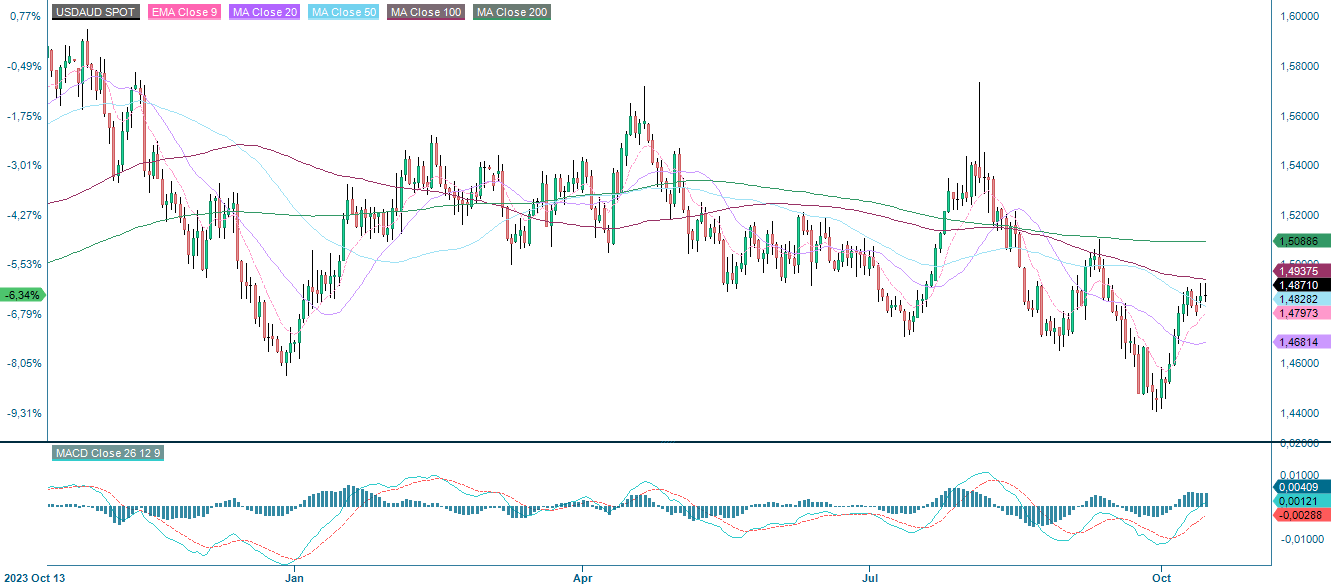
The Australian Dollar (AUD) has spent the majority of October slipping relative to the US Dollar (USD), with the USD appreciating 3% during the period. On the side of the USA, hawkish statements by Federal Reserve (Fed) Governor Waller and Minneapolis Fed President Kashkari indicated slower rate cuts. Furthermore, inflation figures beat estimates in the USA last week, promoting the hawkish stance. However, for the remainder of 2024, it is unclear if the USD will continue to beat the AUD, as Australian exports to China could recover thanks to the ongoing stimulus.
Case of the week: Australian Dollar against the USD
The Australian market is largely centred on the commodities that the country exports, which are coal briquettes, iron ore and petroleum gas. In July 2024, the most important exports were metalliferous ores and metal scrap at AUD 12 billion, followed by briquettes at AUD 6.56 billion and lastly petroleum gas at AUD 5.22 billion. Other notable exports include gold and meat products. Australia has built up a significant industry centred on mining and the supply of key minerals and energy products. For Australia's balance of trade, this has resulted in a consistent surplus since 2017. However, since peaking in 2022, exports have been on the decline as Australia's main trading partner, China, has reduced its imports over the same period. While this has also affected the US, it is worth noting that while China accounts for 7.5% of total US exports, the corresponding figure for Australia is 41%. With China working on stimulus packages to boost the local economy, albeit perhaps mostly focused on the domestic property market, it is likely that imports could also rise. For the month of September, Chinese exports and imports came in below consensus estimates, with imports rising 0.3% year-over-year versus estimates of 0.9%. Anticipated stimulus measures could mitigate the subdued growth in imports, which could provide a sequential boost to Australian exports.
On the US side, hawkish sentiment prevailed in October. The USD index rose sharply from just above 100 points to 103 points on the back of resilient labour market conditions. Indeed, Non Farm Payrolls landed at 254,000 jobs vs. consensus estimates of 140,000 jobs and inflation measures landed higher than expected, e.g. core inflation month-over-month (MoM) landed at 0.3% vs. consensus estimates of 0.2%. The heat in the labour and inflation numbers led to hawkish speeches from various Fed officials. Fed Governor Waller and Minneapolis Fed President Kashkari were both supportive of the US dollar and clearly favoured a more modest pace of Fed rate cuts. While this has temporarily boosted the USD, it remains to be seen if the newfound strength can be sustained as the aforementioned stimulus package in China could draw investment away from the US. Furthermore, although the latest batch of inflation numbers came out hot, initial jobless claims actually beat estimates at 258,000 claims compared to estimates of 230,000 claims. If the rise in jobless claims continues, it could lead to further or even accelerated interest rate cuts.
All in all, the AUD is poised for a rally, with possible near-term triggers pointing to a recovery in exports, which would sequentially boost demand for the AUD. On the other side of the currency pair, the USD has been temporarily boosted by domestic figures and hawkish comments, but it remains to be seen whether this boost will last. Therefore, in the short term, a trader could take advantage of increased trade between Australia and China, as well as a cooling US labour market, by going short on the USD against the AUD.
USD/AUD Spot Exchange Rate, one-year daily chart
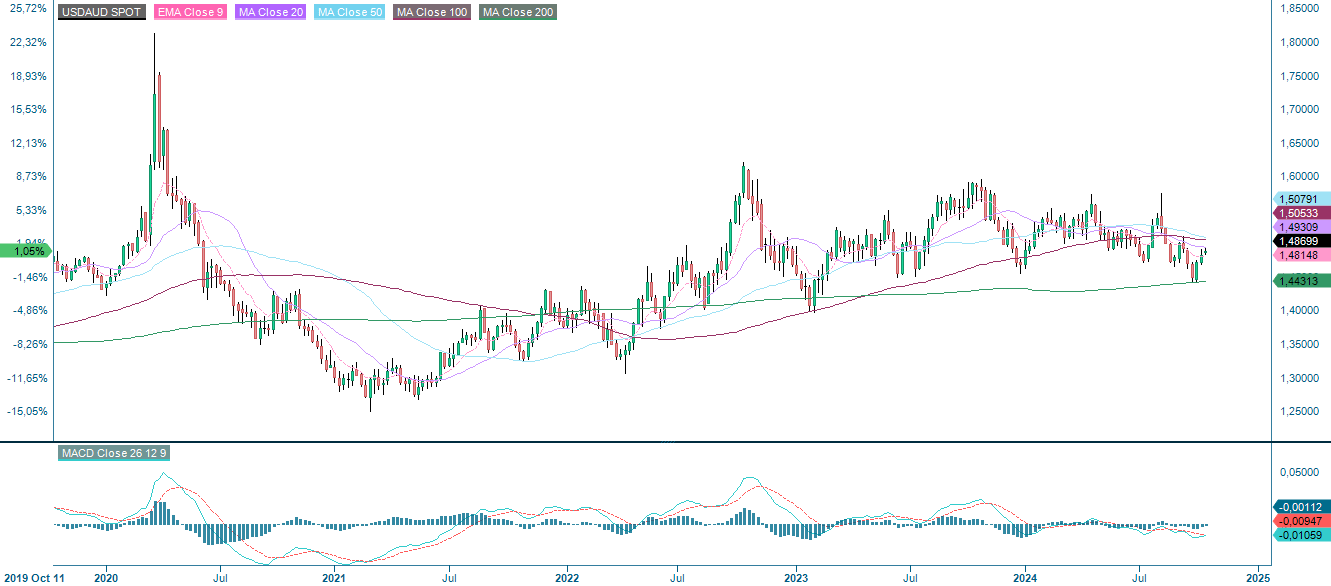
USD/AUD Spot Exchange Rate, five-year weekly chart
Macro comments
JP Morgan and Wells Fargo gained 4.4% and 5.6% respectively on Friday 11 October after reporting better than expected third quarter results. We then saw another good day for US equity indices on Monday 14th October, supported by strong interim reports from Goldman Sachs and United Health.
Wells Fargo (in USD), five-year weekly chart

Today, Wednesday, October 16th, we get the Consumer Price Index (CPI) and Producer Price Index (PPI) for September from the UK and the CPI for September from Italy. From the U.S. we get September exports and imports of goods, as well as oil inventories from the Department of Energy’s (DOE), weekly statistics. Wednesday is also the day when a number of major US companies release their interim reports, including Abbott Laboratories, ASML, Morgan Stanley, BHP Group, Prologis and Lam Research.
On Thursday, October 17th, we will receive the September trade balance from Japan and the August trade balance from the euro area. We will also get September CPI from the Eurozone and an interest rate announcement from the European Central Bank (ECB). From the US, September retail sales and the Philadelphia Fed index, initial jobless claims as well as industrial production, the National Association of Home Builders (NAHB) housing index and inventories of unsold goods, all for September are due. The flood of Q3 reports continues on Thursday with results from i.e. Taiwan Semiconductor, Nestlé, Netflix, Blackstone, Elevance Health, Infosys, Intuitive Surgical, Marsh McLennan, ABB, Nordea, EQT, Investor, Industrivärden and Nokia.
Early on Friday morning, October 18th, Japan will release its September CPI. Almost as early, we will get September house prices, retail sales, industrial production, investment and unemployment figures from China, as well as Q3 gross domestic product (GDP). In Europe, we get September retail sales from the UK and August current account balance and construction output from the Eurozone. Friday will also see the release of several interim reports, including those from American Express, Procter & Gamble, Schlumberger, Volvo and Autoliv.
Falling yields could support further upside
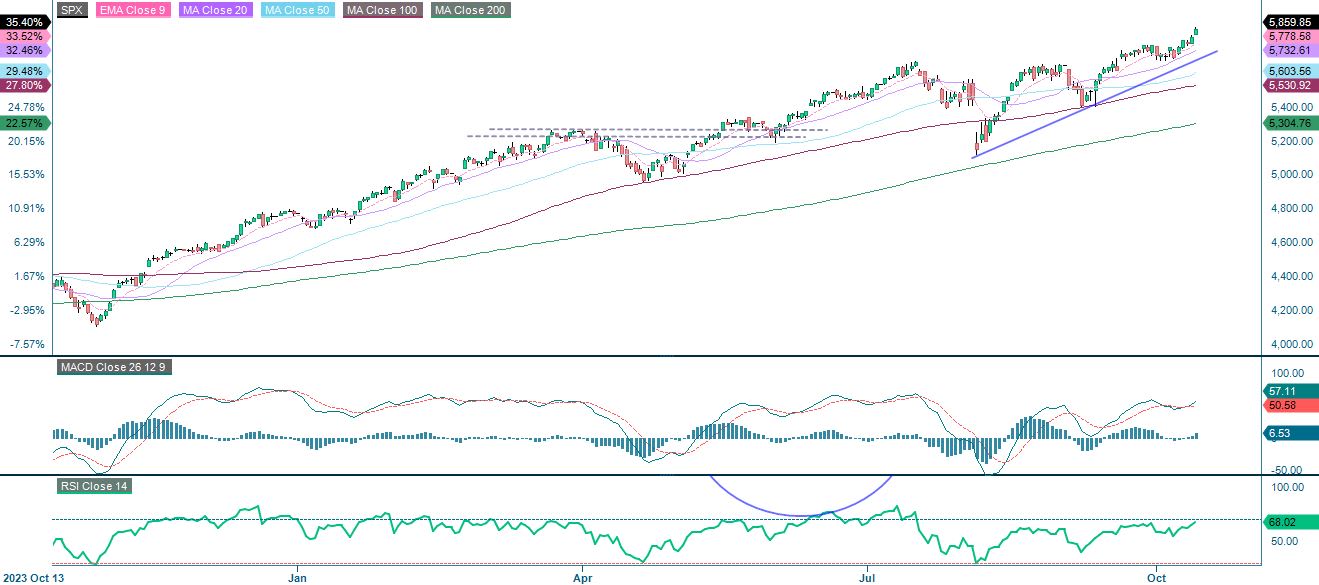
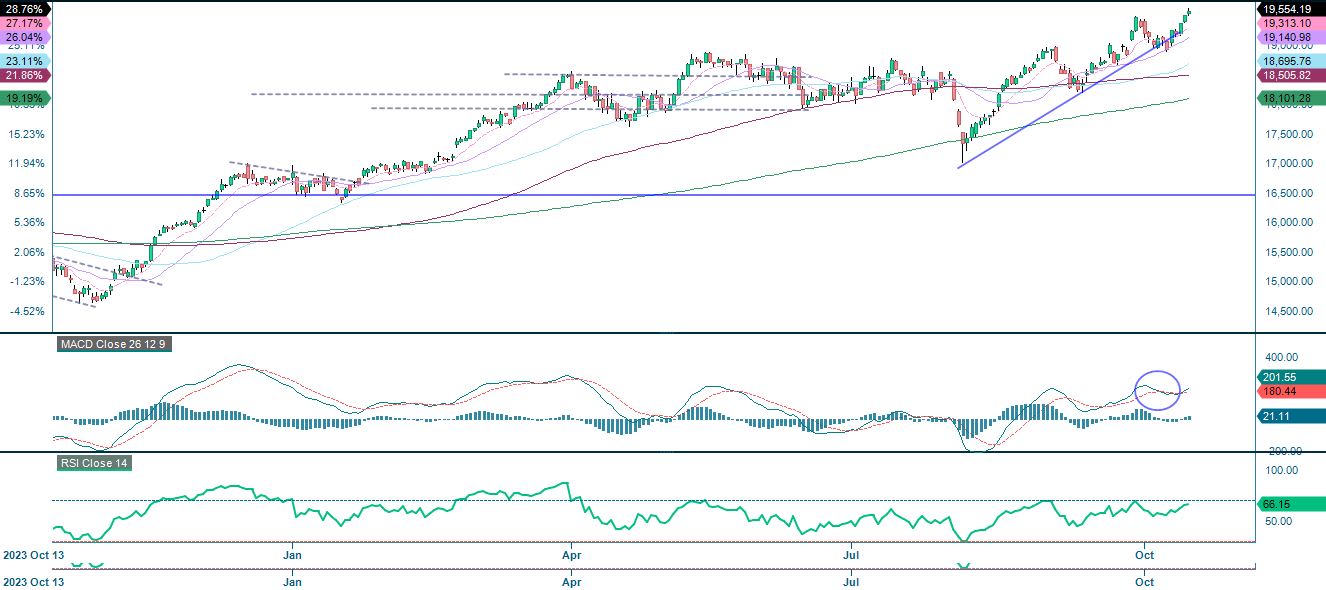
Equities have been trading higher as evidenced by the S&P 500 trading at new highs. The question is how much energy is left as the Relative Strength Index (RSI) is slowly approaching overbought levels. However, yields, which have started to fall, could provide support.
S&P 500 (in USD), one-year daily chart
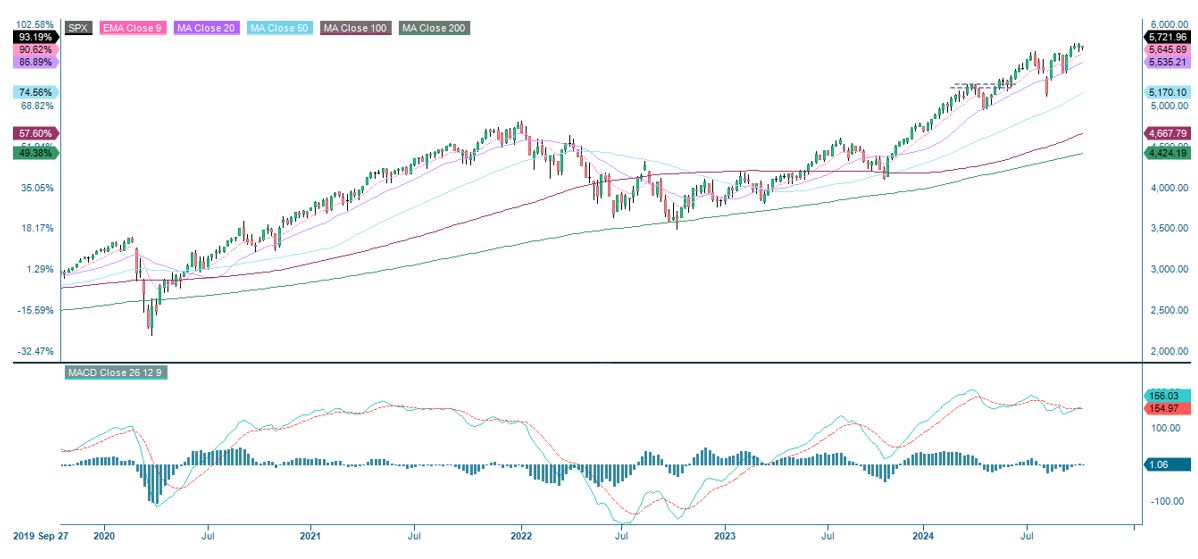
S&P 500 (in USD), weekly five-year chart
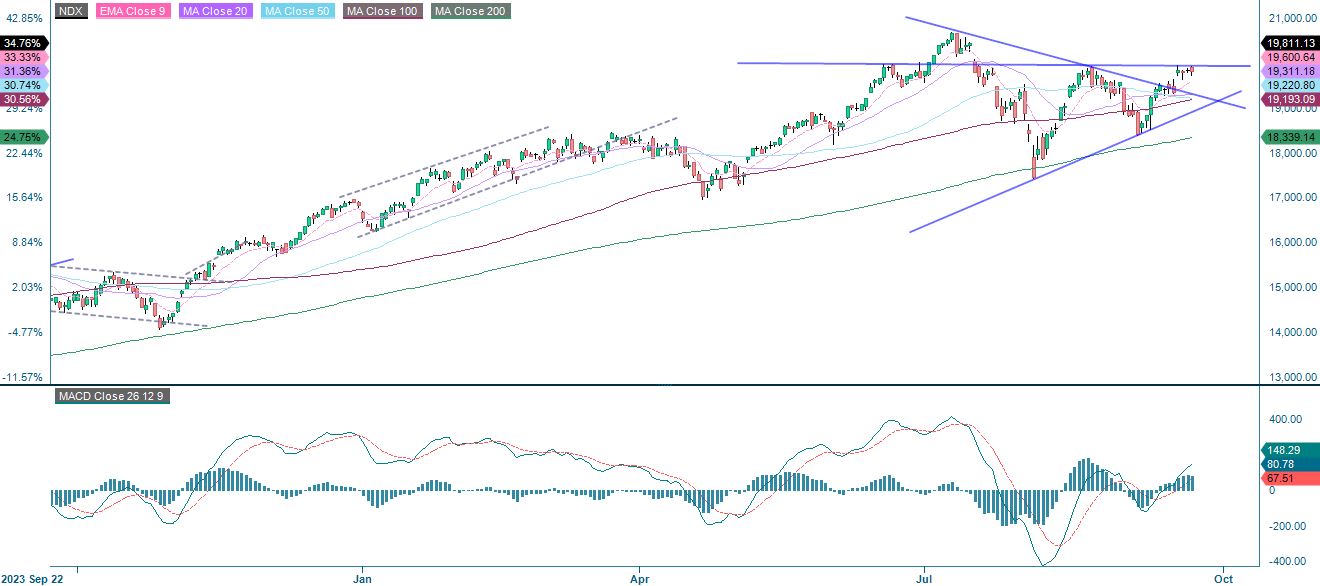
The Nasdaq 100 has broken above the first level of resistance. The previous high from July this year is in sight as yields continue to fall.
Nasdaq 100 (in USD), one-year daily chart
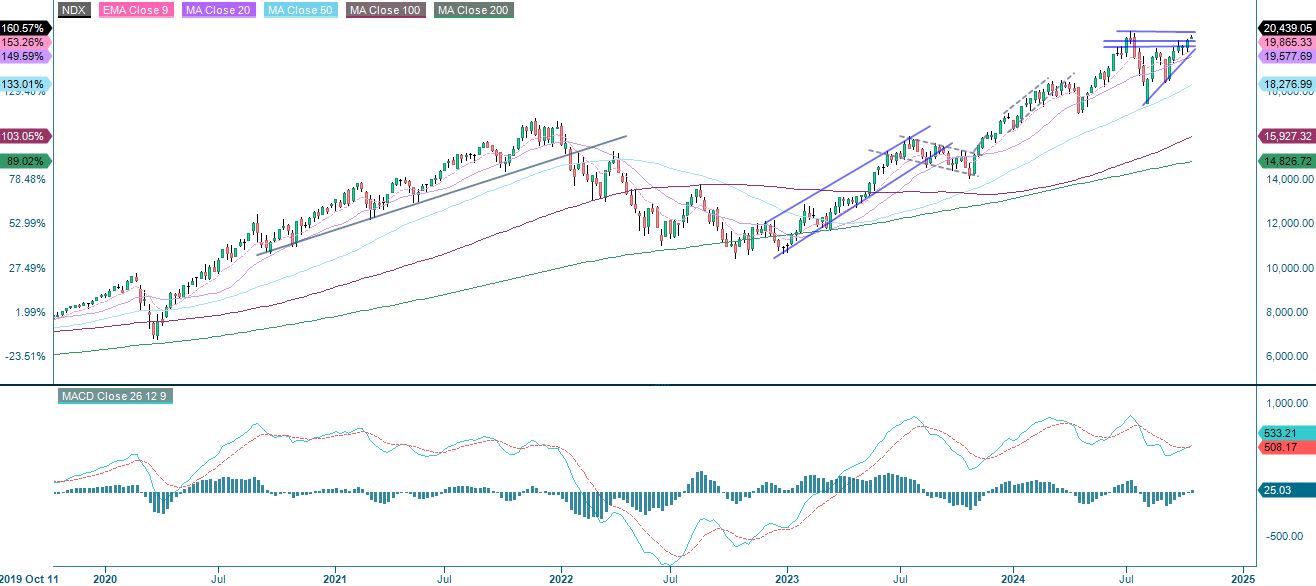
Nasdaq 100 (in USD), weekly five-year chart
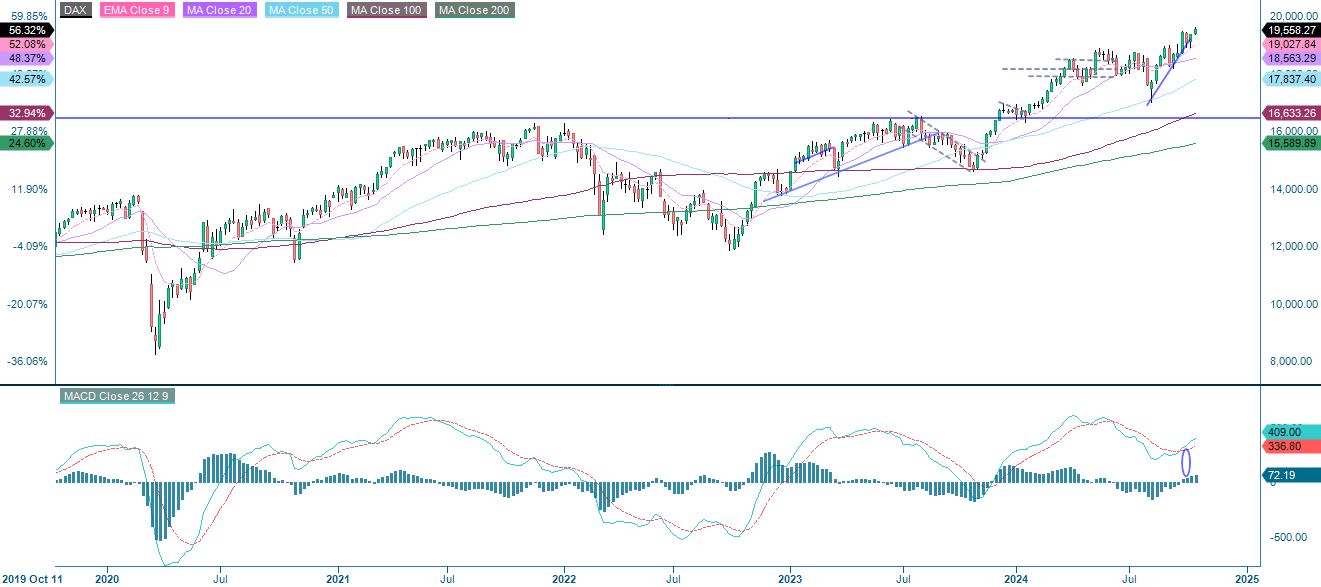
The German DAX managed to bounce nicely off the MA20. Meanwhile, the MACD histogram is rising again. Is there more energy ahead?
DAX (in EUR), one-year daily chart
DAX (in EUR), weekly five-year chart
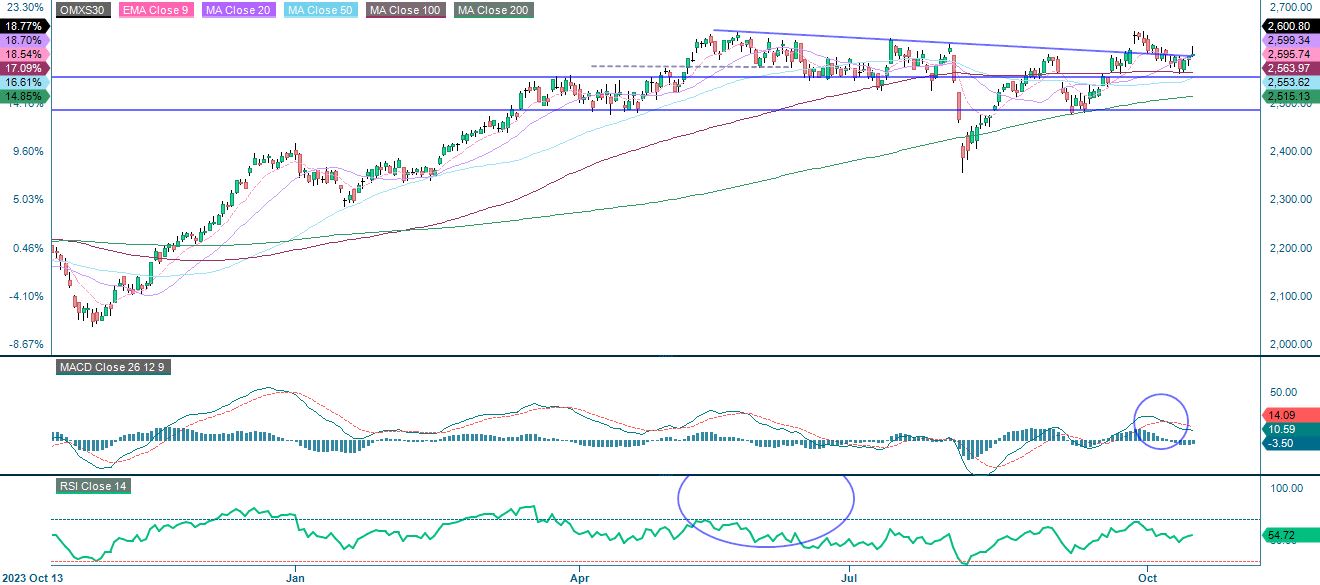
The OMXS30 made a nice bounce off the MA100 with a nice attempt to break above the resistance formed by the MA20. Note that the index is currently trading in the form of a doji, which is a candlestick pattern indicating high indecision in the market.
OMXS30 (in SEK), one-year daily chart
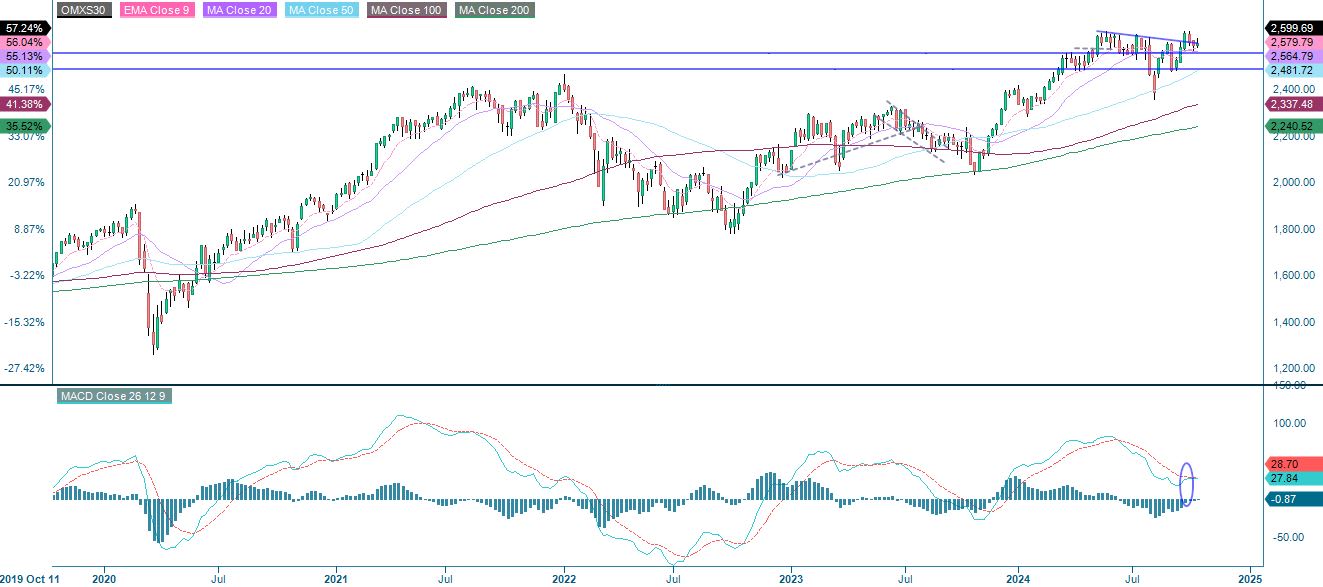
OMXS30 (in SEK), weekly five-year chart
The full name for abbreviations used in the previous text:
EMA 9: 9-day exponential moving average
Fibonacci: There are several Fibonacci lines used in technical analysis. Fibonacci numbers are a sequence in which each successive number is the sum of the two previous numbers.
MA20: 20-day moving average
MA50: 50-day moving average
MA100: 100-day moving average
MA200: 200-day moving average
MACD: Moving average convergence divergence
Risks
Credit risk of the issuer:
Investors in the products are exposed to the risk that the Issuer or the Guarantor may not be able to meet its obligations under the products. A total loss of the invested capital is possible. The products are not subject to any deposit protection.
Currency risk:
If the product currency differs from the currency of the underlying asset, the value of a product will also depend on the exchange rate between the respective currencies. As a result, the value of a product can fluctuate significantly.
External author:
This information is in the sole responsibility of the guest author and does not necessarily represent the opinion of Bank Vontobel Europe AG or any other company of the Vontobel Group. The further development of the index or a company as well as its share price depends on a large number of company-, group- and sector-specific as well as economic factors. When forming his investment decision, each investor must take into account the risk of price losses. Please note that investing in these products will not generate ongoing income.
The products are not capital protected, in the worst case a total loss of the invested capital is possible. In the event of insolvency of the issuer and the guarantor, the investor bears the risk of a total loss of his investment. In any case, investors should note that past performance and / or analysts' opinions are no adequate indicator of future performance. The performance of the underlyings depends on a variety of economic, entrepreneurial and political factors that should be taken into account in the formation of a market expectation.
Market risk:
The value of the products can fall significantly below the purchase price due to changes in market factors, especially if the value of the underlying asset falls. The products are not capital-protected
Product costs:
Product and possible financing costs reduce the value of the products.
Risk with leverage products:
Due to the leverage effect, there is an increased risk of loss (risk of total loss) with leverage products, e.g. Bull & Bear Certificates, Warrants and Mini Futures.
Disclaimer:
This information is neither an investment advice nor an investment or investment strategy recommendation, but advertisement. The complete information on the products (securities) mentioned herein, in particular the structure and risks associated with an investment, are described in the base prospectus, together with any supplements, as well as the final terms relating to the securities. The base prospectus and final terms constitute the solely binding sales documents for the products mentioned herein. It is recommended that potential investors read these documents before making any investment decision. The documents and the key information document are published on the website of the issuer, Vontobel Financial Products GmbH, Bockenheimer Landstrasse 24, 60323 Frankfurt am Main, Germany, on https://prospectus.vontobel.com and are available from the issuer free of charge. The approval of the prospectus should not be understood as an endorsement of the securities. The securities are products that are not simple and may be difficult to understand. This information includes or relates to figures of past performance. Past performance is not a reliable indicator of future performance. This information may only be distributed or published in countries where such distribution or publication is permitted by applicable law. As stated in the relevant base prospectus, the distribution of the securities mentioned in this information is subject to restrictions in certain jurisdictions. This advertisement may not be reproduced or redistributed without prior permission by Vontobel.
© Bank Vontobel Europe AG and / or affiliated companies. All rights reserved.