Micron stock due for a rebound?

This week's case is Micron Technology, there could be a significant potential for revenue and earnings growth in areas such as memory AI and data centre revenues. The stock has recently fallen by 40%, potentially creating a buying opportunity. The US Nonfarm Payrolls on Friday 6th September will be the most important macro figure this week. From a technical analysis perspective, US equity indices look rather weak with risks to the downside.
Case of the week: Micron Technology inc.
Micron Technology Inc., the world’s fifth-largest semiconductor company, specialises in the development and production of memory and storage solutions. Micron´s products are essential for powering AI and 5G technologies in consumer devices, networks, and data centers, with applications in industries like healthcare and automotive.
Despite strong fundamental development, Microns share price has decreased by approximately 40% since mid-June, eliminating six months gain. Interestingly, nothing has really changed fundamentally —only the sentiment. From late 2023 to mid-2024, AI stocks were highly sought after, but then the excitement faded.
Regardless of the share price decline, Micron remains a prominent player in the memory industry and is poised to continue to benefit from advances in AI. With purpose-built memory and storage solutions, Micron facilitates generative AI training, AI-generated content, and more. The company adeptly delivers the speed and capacity needed to run generative AI applications on endpoint devices. In addition, Micron leverages AI in its smart factories, harnessing data to transform operations and achieve unprecedented levels of output, yield, and quality in its industry-leading AI memory and storage solutions.
In its most recent report (fiscal Q3), Micron delivered a strong performance. Earnings Per Share (EPS) of $0.62 beat the consensus estimate by $0.09, a 17% beat. Revenues reached $6.81 billion, beating expectations by $140 million and up 81.6% year-on-year. Operating cash flow also improved significantly to $2.48 billion from $1.22 billion in the previous quarter.
Micron achieved a record high in data center SSD revenue and continued to gain market share in high-margin products such as High Bandwidth Memory. The CEO expressed enthusiasm about the expanding AI-driven opportunities, noting that Micron is well-positioned to achieve substantial revenue growth in fiscal 2025. For fiscal Q4, Micron provided guidance with anticipated revenues of $7.6 billion, slightly above the consensus estimate of $7.58 billion. The company also projected EPS of $1.08, compared to the consensus figure of $1.04. All in all, Micron delivered a fiscal Q3 report offering plenty of reasons for optimism about its prospects. There was nothing in the report that would justify a 40% drop in its stock price.
Micron could have significant potential for revenue and earnings growth. With opportunities in Memory AI, data center revenues, and other expanding markets, Micron could potentially achieve double-digit sales growth in the coming years. Additionally, the company may benefit from AI-driven efficiencies and other strategies aimed at maximising profitability.
However, Micron faces competition, along with geopolitical risks and other factors that could affect demand. The share may also experience volatility if the economy slows, or interest rates stay elevated. Additionally, Micron operates in a highly cyclical industry, where its products are susceptible to price declines due to oversupply and other market dynamics. Despite these challenges, the recent decline in the stock, coupled with strengthened fundamentals, makes Micron an intersting opportunity. With the next report expected on September 25th, it wouldn’t be a surprise if Micron emerges as one of the AI winners for the remainder of 2024.
Micron (MU), one-year daily chart

Micron (MU), five-year weekly chart

Macro comments
We are now coming out of the Q2 report with a good result, especially in the US. At the same time, the negative price reaction after Nvidia's latest interim report reminded us that investors are more demanding than before.
On the macro agenda for today, Wednesday 4 September, we have the August services Purchasing Managers Indices (PMIs) from Japan, China, Sweden, Spain, Italy, France, Germany and the UK. From the US, we get the July trade balance and industrial orders.
On Thursday, 5th September, Germany will publish its Industrial Orders for July. From the US, we get the ADP private employment and services PMI, both for August.
The most important macro figure this week will be the US Nonfarm Payrolls (NFP) on Friday, 6th September. July's NFP came in at 114K, well below the market's expectations of 176K. The market consensus is now looking for 164K new jobs in August. The outcome of the NFP could determine whether the Fed will cut its policy rate by 25 or 50 basis points next time.
US nonfarm payrolls, January 2023 to August 2024

Risks tilted to the downside ahead of job figures
For some time now, the S&P 500 has been consolidating around its previous high of mid-July 2024. The index is currently trading below the EMA9 on weak ISM manufacturing PMI, adding to concerns about the state of the economy. Tomorrow is the ISM non-manufacturing PMI. As the momentum is falling, as shown on the MACD histogram, the risk can be considered to be tilted to the downside. The next level on the downside is the MA20, currently at 5,526. Friday will see the release of the Non-Farm Payrolls. Any deviations are likely to have an even greater impact on the market.
Taking some profits from the gains made since the beginning of August may not be a bad idea for the more risk-averse. However, positive surprises on Friday could act as a trigger for the indices to approach new highs on the upside.
S&P 500 (in USD), one-year daily chart

S&P 500 (in USD), weekly five-year chart

Meanwhile, the Nasdaq 100 is currently trading at MA20. The next level on the downside is the MA100, currently at 18,937. Again, momentum is waning, as the MACD histogram shows. A break below this level will increase the downside risk as the next level is at 18,090 (MA200).
Nasdaq 100 (in USD), one-year daily chart

Nasdaq 100 (in USD), weekly five-year chart

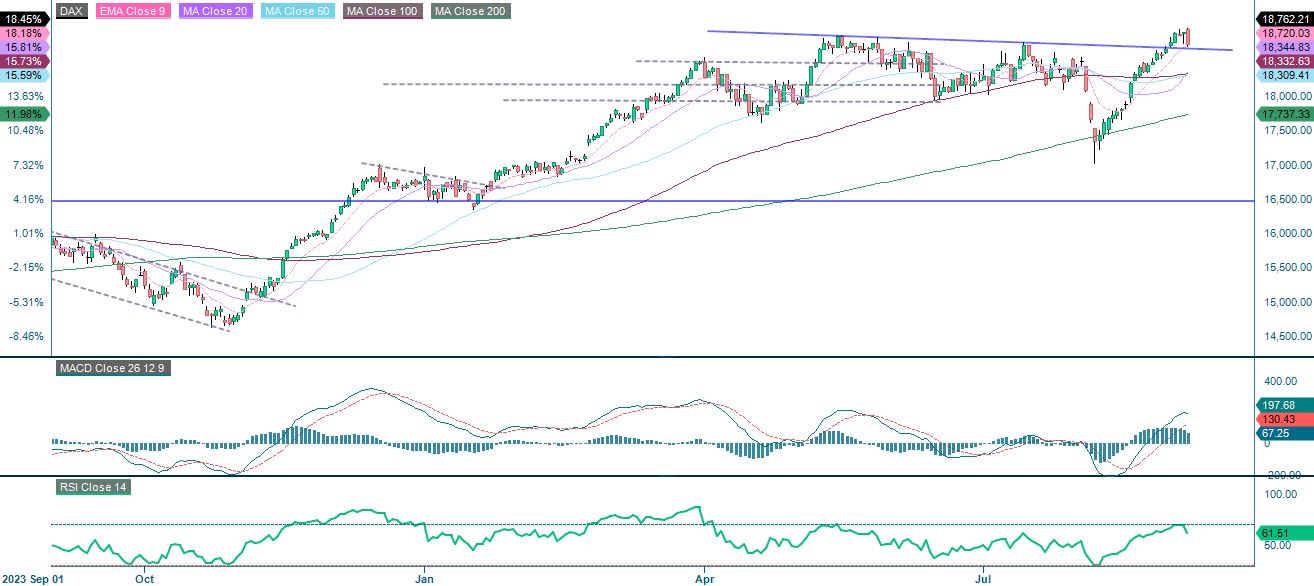
The German DAX managed to break above resistance which now acts as a support along with the EMA9 at 18,700. In case of a break to the downside, the next level is around 18,350. Again, the downside risk is quite juicy.
DAX (in EUR), one-year daily chart
DAX (in EUR), weekly five-year chart

The Swedish OMXS30 is trading at support at 2,560. A break to the downside and the next level is the MA20, currently at 2,528. The next level on the downside is at 2,485.
OMXS30 (in SEK), one-year daily chart

OMXS30 (in SEK), weekly five-year chart

The full name for abbreviations used in the previous text:
EMA 9: 9-day exponential moving average
Fibonacci: There are several Fibonacci lines used in technical analysis. Fibonacci numbers are a sequence in which each successive number is the sum of the two previous numbers.
MA20: 20-day moving average
MA50: 50-day moving average
MA100: 100-day moving average
MA200: 200-day moving average
MACD: Moving average convergence divergence
Risks
External author:
This information is in the sole responsibility of the guest author and does not necessarily represent the opinion of Bank Vontobel Europe AG or any other company of the Vontobel Group. The further development of the index or a company as well as its share price depends on a large number of company-, group- and sector-specific as well as economic factors. When forming his investment decision, each investor must take into account the risk of price losses. Please note that investing in these products will not generate ongoing income.
The products are not capital protected, in the worst case a total loss of the invested capital is possible. In the event of insolvency of the issuer and the guarantor, the investor bears the risk of a total loss of his investment. In any case, investors should note that past performance and / or analysts' opinions are no adequate indicator of future performance. The performance of the underlyings depends on a variety of economic, entrepreneurial and political factors that should be taken into account in the formation of a market expectation.
Credit risk of the issuer:
Investors in the products are exposed to the risk that the Issuer or the Guarantor may not be able to meet its obligations under the products. A total loss of the invested capital is possible. The products are not subject to any deposit protection.
Market risk:
The value of the products can fall significantly below the purchase price due to changes in market factors, especially if the value of the underlying asset falls. The products are not capital-protected
Risk with leverage products:
Due to the leverage effect, there is an increased risk of loss (risk of total loss) with leverage products, e.g. Bull & Bear Certificates, Warrants and Mini Futures.
Product costs:
Product and possible financing costs reduce the value of the products.
Currency risk:
If the product currency differs from the currency of the underlying asset, the value of a product will also depend on the exchange rate between the respective currencies. As a result, the value of a product can fluctuate significantly.