Focus on ECB on Thursday and US NFP on Friday

This week's case concerns gold, which has weakened on the prospect of lower interest rates and increased investor risk appetite. However, many remain long gold, not least as an inflation hedge. This week’s big events are the ECB rate decision on Thursday 6 June and the US Nonfarm payroll (NFP) data on Friday 7 June.
Case of the week: Gold bounces back as risk appetite increases
Since 20th May, the gold market has shown a rare correction trend. This price volatility mainly comes from a certain wobble in the market's expectations of future interest rate cuts by the Federal Reserve. The performance of silver, which has stronger industrial attributes and stronger physical demand, is relatively better. Overall, the precious metal market is sensitive to positive factors and blunt to negative factors.
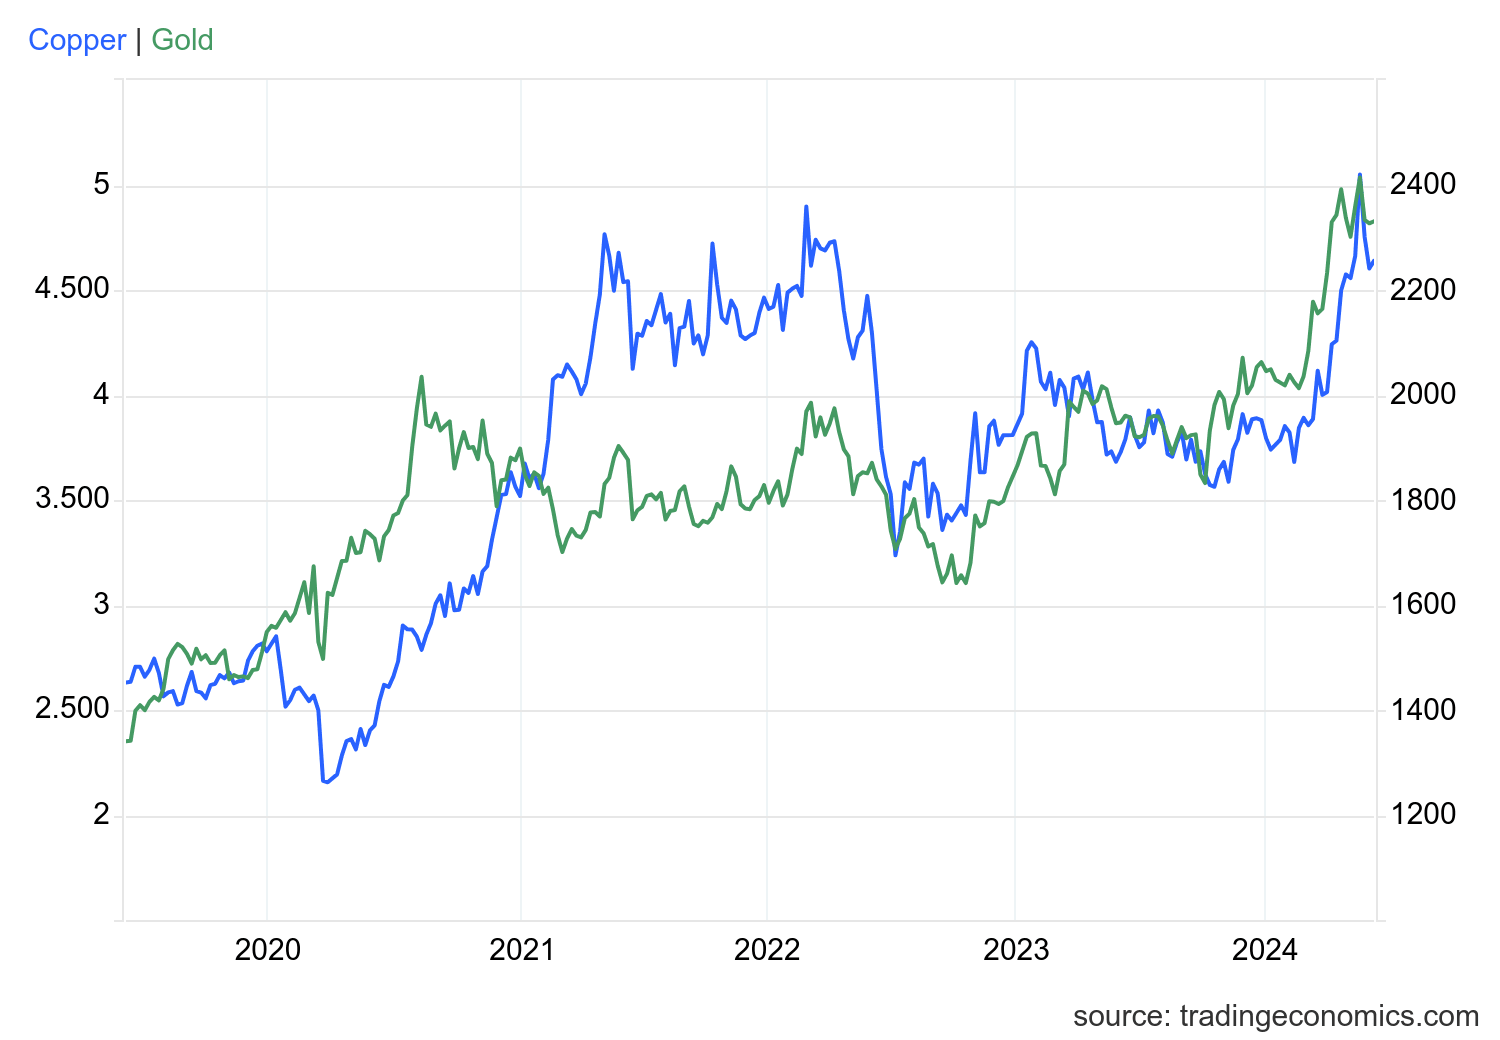
Since late 2022 there has been a strong correlation between the price of gold and copper, despite gold being a precious metal and copper being one of the leading indicators for demand driven by the industrial sector.
Gold USD/oz (green, right axis) versus copper USD/lb (blue, left axis), five-year chart
US first quarter Gross Domestic Product (GDP) was revised down to an annualised rate of 1.3% from an initial estimate of 1.6%, reflecting weaker than expected consumer spending. The latest data showed that the Personal Consumption Expenditures (PCE) price index in the United States came in at a lower-than-expected 0.2% monthly rate in April (0.3%). Economists believe that the core index is a better indicator of inflation than the headline index. In addition, the monthly rate of personal spending in the United States came in at 0.2% in April, also down sharply from 0.8% in the previous month. Following the release of the data, gold futures staged a wave of gains, but after about an hour, futures prices were pushed down by short forces and closed at around 2,347.7 by the end of the day.
An aide to Israeli Prime Minister Benjamin Netanyahu confirmed on Sunday 2 June that Israel had accepted a framework deal proposed by U.S. President Joe Biden aimed at ending the war in Gaza. This expectation of a ceasefire in Gaza increased risk appetite which resulted in the hitting of safe-haven property as gold.
Easing inflationary pressures and the possibility of interest rate cuts could diminish gold's appeal in the short term, as investors are likely to favour equities because of lower borrowing costs and improving stock market conditions. However, if inflationary pressures rise again, gold could again gain investors’ confidence as hedging tool.
As one of the world's largest gold consumers, China's demand for gold has a significant impact on the global gold price. There have been some signs of economic recovery in China in recent months, although these have yet to be fully confirmed.
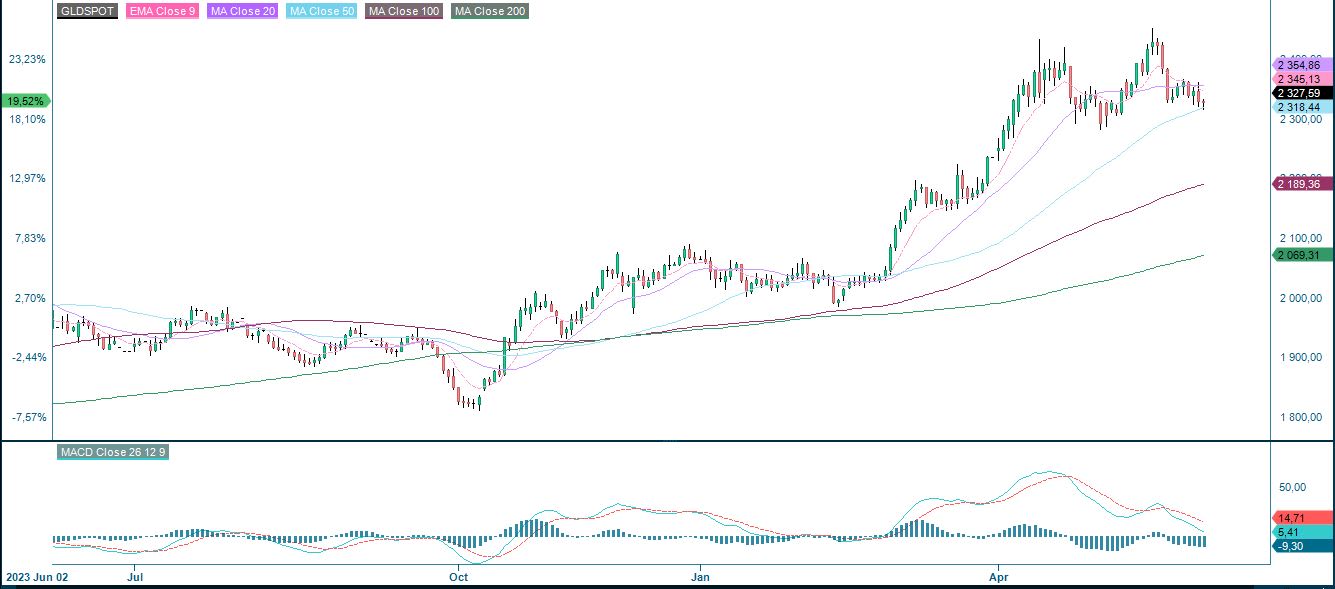
While short-term volatility is likely to persist, the long-term outlook for gold remains strong, supported by fundamental and technical factors. This seems to indicate a Buy.
Gold (USD/Ounce) one-year daily chart
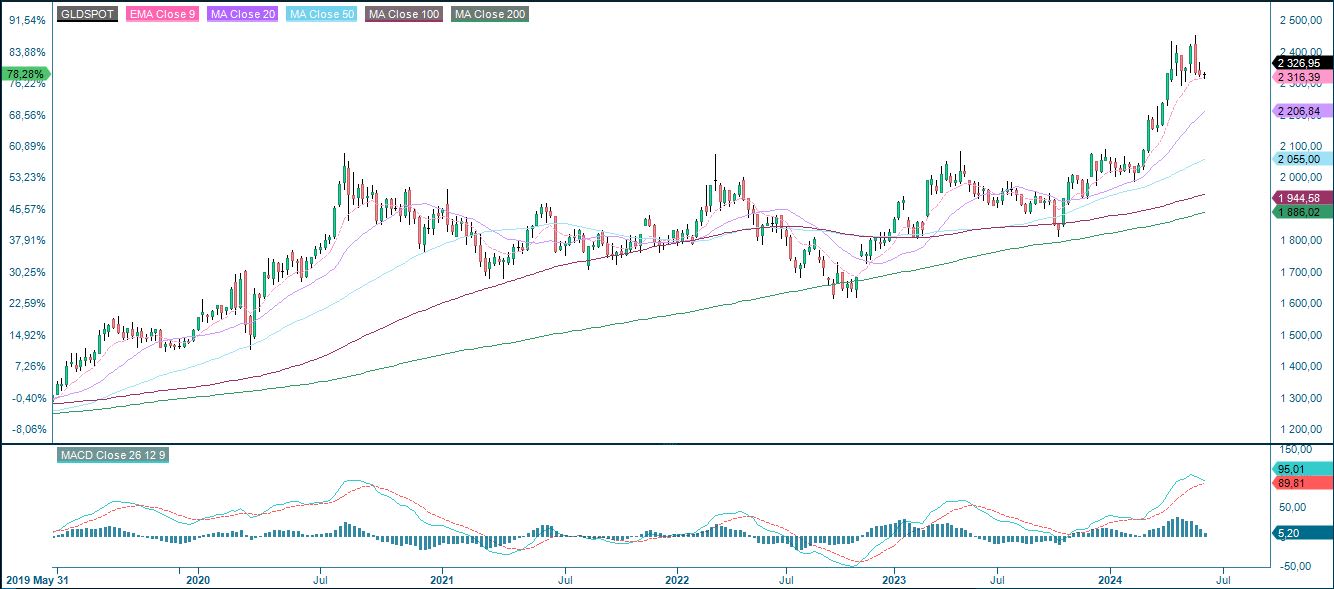
Gold (USD/Ounce), five-year weekly chart
Macro comments
US equities ended the week on Friday 31st May with the S&P500 up 0.8%. US core PCE (producer price inflation) rose 0.2% in April and 2.8% on an annualised basis, in line with expectations. As a result, US two-year and ten-year Treasury yields fell by 5 basis points each.
Today's macro calendar (Wednesday 5 June) is dominated by the May services PMIs from Japan, China, Sweden, Spain, Italy, France, Germany, the UK, and the US. We also get ADP private employment from the US and Inditex (one of H&M's competitors) releases a quarterly report.
On Thursday 6th June we get German Industrial Orders and the US Trade Balance for April.
There will also be some focus on the ECB's interest rate decision. Even though the latest inflation figure was higher than expected, the market set a 94 per cent likelihood that the ECB will cut its key rates by 25 basis points to 3.75% (deposit rate) and 4.25% (refinancing rate).
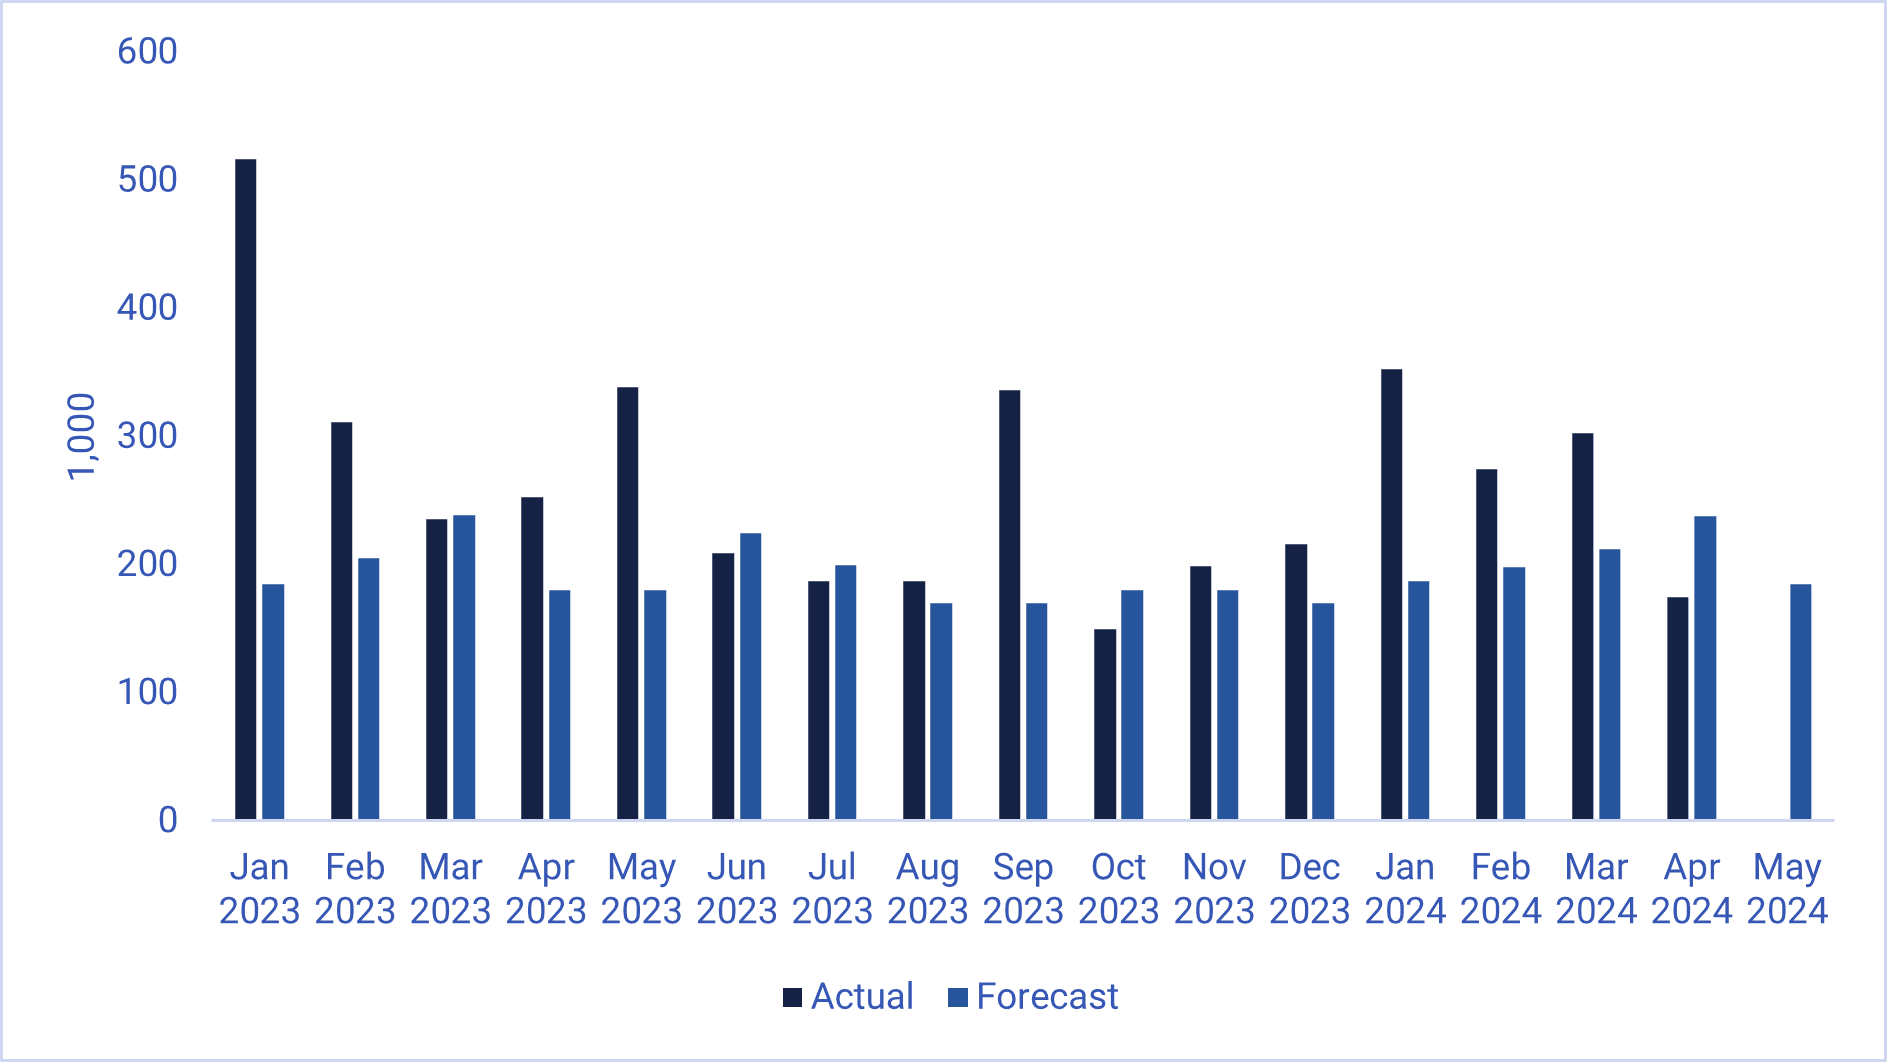
On Friday the 7th of June, markets will focus on the US Non-Farm Payrolls report, which is expected to show that 185,000 new jobs were created in May.
US nonfarm payrolls, January 2023 to May 2024 (actual and forecast)
Risk is tilted to the downside
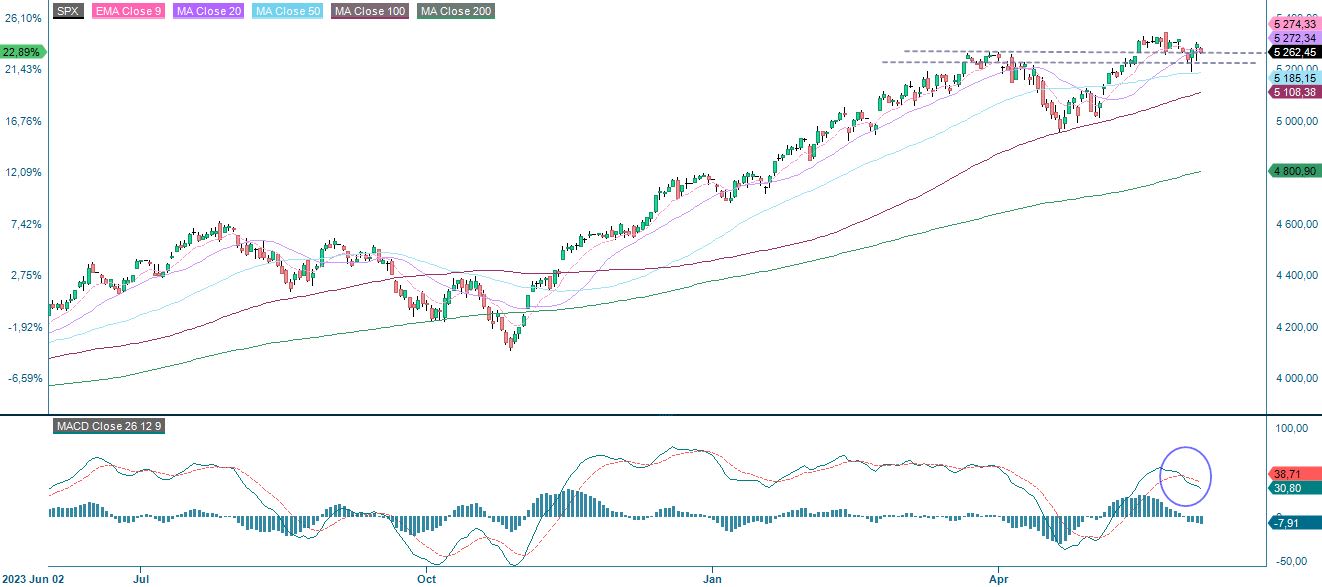
The week’s macro agenda is relatively full. Nevertheless, the S&P 500 is currently trading below MA20 but above MA50 and support lines. However, MACD has generated a soft sell signal. Thus, the risk is found on the downside from a TA perspective. A break below MA50 and MA200, currently at 5,108 may be next.
S&P 500 (in USD), one-year daily chart
S&P 500 (in USD), weekly five-year chart

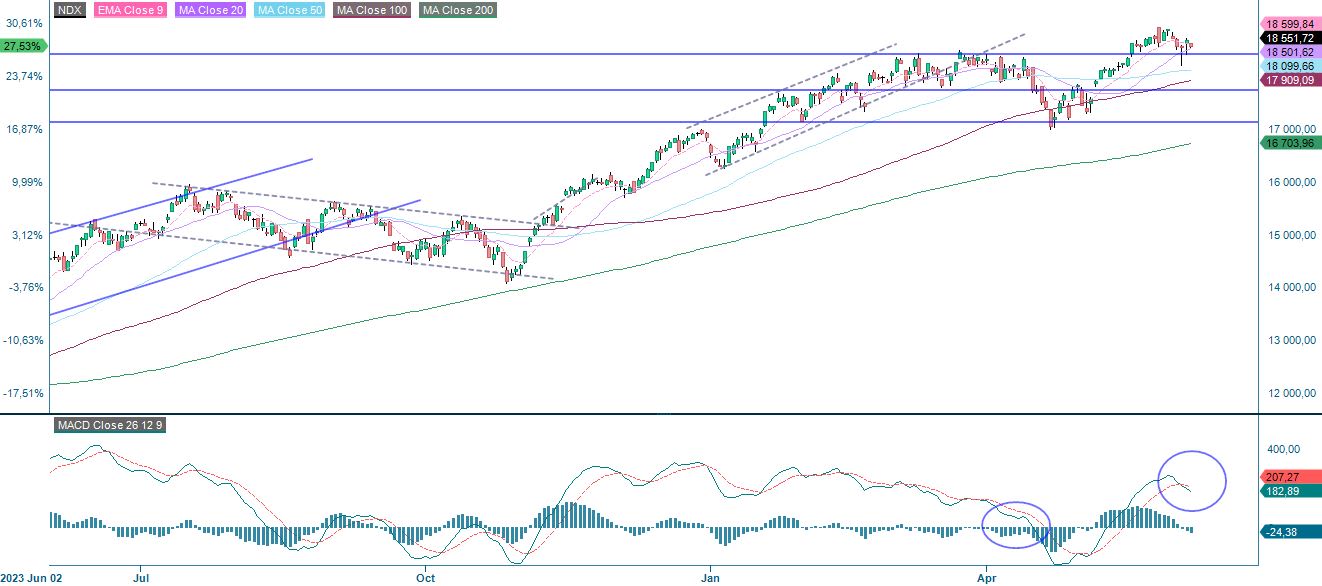
A similar setup is found in Nasdaq 100.
Nasdaq 100 (in USD), one-year daily chart
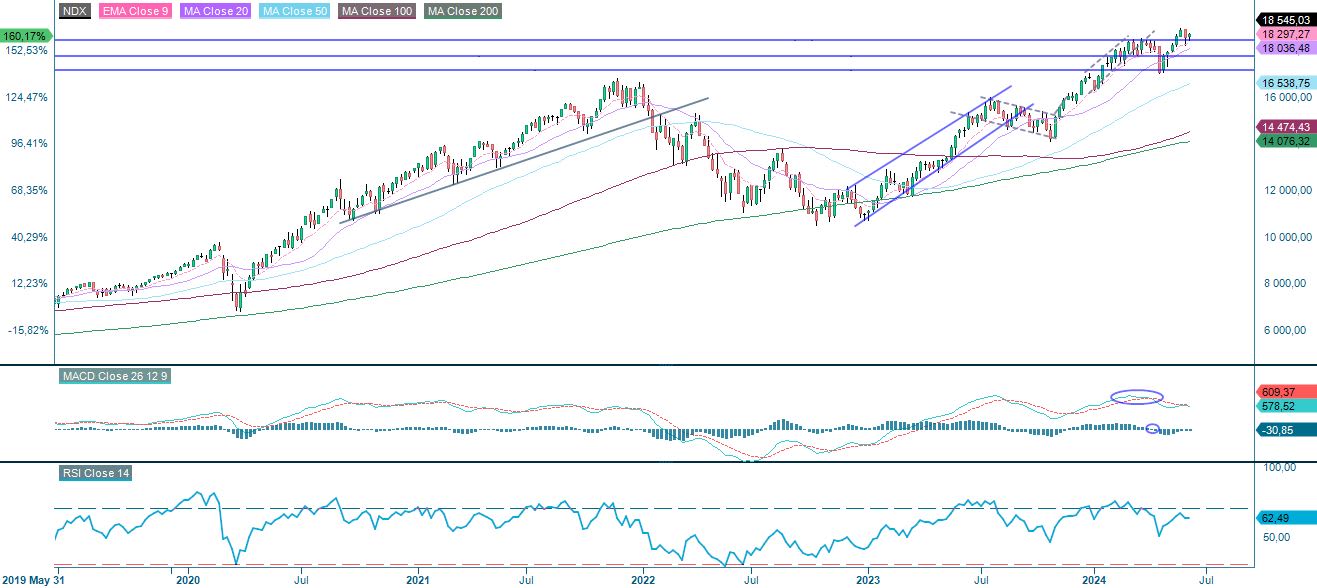
Nasdaq 100 (in USD), weekly five-year chart
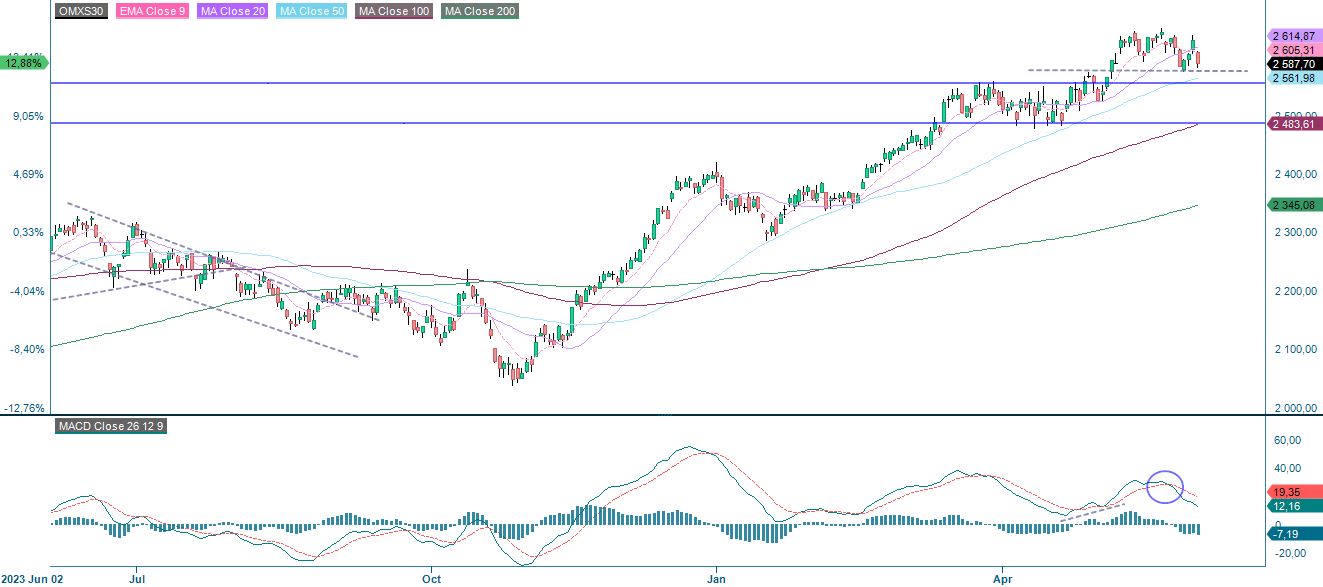
As the chart below shows, the Swedish OMXS30 is trading below MA20 close to a cluster of support levels. MACD has generated a soft signal and risk is on the downside. A breakthrough the cluster of support and MA200, currently at 2,484 may be next.
OMXS30 (in SEK), one-year daily chart
However, another (but shorter) flag pattern has formed on the weekly chart. These tend to break in the direction of the trend - up.
OMXS30 (in SEK), weekly five-year chart

The German DAX is trading close to MA50 serving as first level of support. That is followed by 18,175.
DAX (in EUR), one-year daily chart

DAX (in EUR), weekly five-year chart

The full name for abbreviations used in the previous text:
EMA 9: 9-day exponential moving average
Fibonacci: There are several Fibonacci lines used in technical analysis. Fibonacci numbers are a sequence in which each successive number is the sum of the two previous numbers.
MA20: 20-day moving average
MA50: 50-day moving average
MA100: 100-day moving average
MA200: 200-day moving average
MACD: Moving average convergence divergence
Risks
External author:
This information is in the sole responsibility of the guest author and does not necessarily represent the opinion of Bank Vontobel Europe AG or any other company of the Vontobel Group. The further development of the index or a company as well as its share price depends on a large number of company-, group- and sector-specific as well as economic factors. When forming his investment decision, each investor must take into account the risk of price losses. Please note that investing in these products will not generate ongoing income.
The products are not capital protected, in the worst case a total loss of the invested capital is possible. In the event of insolvency of the issuer and the guarantor, the investor bears the risk of a total loss of his investment. In any case, investors should note that past performance and / or analysts' opinions are no adequate indicator of future performance. The performance of the underlyings depends on a variety of economic, entrepreneurial and political factors that should be taken into account in the formation of a market expectation.
Credit risk of the issuer:
Investors in the products are exposed to the risk that the Issuer or the Guarantor may not be able to meet its obligations under the products. A total loss of the invested capital is possible. The products are not subject to any deposit protection.
Market risk:
The value of the products can fall significantly below the purchase price due to changes in market factors, especially if the value of the underlying asset falls. The products are not capital-protected
Risk with leverage products:
Due to the leverage effect, there is an increased risk of loss (risk of total loss) with leverage products, e.g. Bull & Bear Certificates, Warrants and Mini Futures.
Product costs:
Product and possible financing costs reduce the value of the products.
Currency risk:
If the product currency differs from the currency of the underlying asset, the value of a product will also depend on the exchange rate between the respective currencies. As a result, the value of a product can fluctuate significantly.