Bellwether Apple could be the next shoe dropping

The Apple share has been relatively resilient despite the turbulent equity markets in 2022.
The Apple share has been relatively resilient despite the turbulent equity markets in 2022. It also led the way in the recent bear market rally while other important FAANG stocks such as Alphabet and Meta lagged on concerns of slowing revenue growth. In fact, during the summer, the shares traded close to all-time highs.
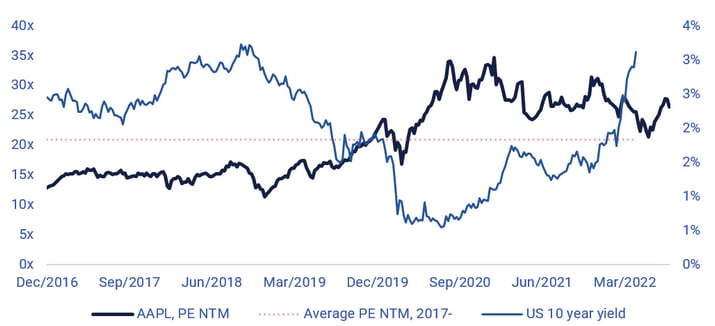
While Apple is a formidable business, consumers worldwide are under severe pressure from rising inflation and interest rates. Hence, we see a risk of Apple running into growth headwinds just like its’ Big Tech peers. In contrast to, e.g., Meta and Alphabet, the valuation is also still quite high from a historical perspective, especially considering the rise in interest rates. In 2018, when the ten-year US Treasury rate was also above three per cent, the Price/earnings (PE) ratio was around 15x, well below the current ratio of some 25x.
Apple PE NTM (Next Twelve Months) versus US 10-year Treasury yield, all in USD
From a technical perspective, the Apple share recently broke below the rising support line of the upward move that started at the end of June. It is now once again trading below MA200. We would not rule out a short-term positive bounce at this point after the recent share price weakness. However, if this long-term support is not regained soon, there is likely further volatility ahead. An ominous sign is that Nasdaq also is breaking down below its technical support.
Next week on September 7, Apple will be hosting a release event, which we would expect to revolve around iPhone 14, and there are rumours of, e.g., satellite phone functionality. However, share price reactions to similar release events in recent years have been mostly negative, according to Bloomberg, so we would not bet on a strong rebound from release-related news flow.
Apple share (in USD), daily 12-month price chart
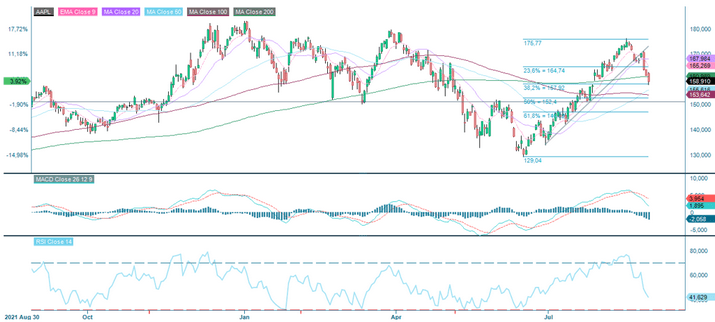
We believe the ~USD 150 level could be the first possible target as this represents March lows and June highs as well as the Fibonacci 50 level of the recent rally.
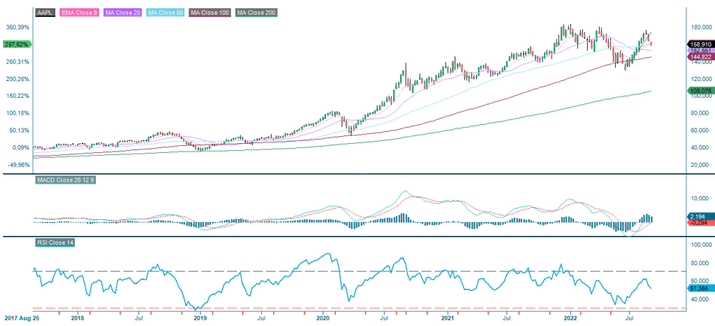
Apple (in USD), August 2017 to August 2022
The full name for abbreviations used in the previous text:
EMA 9: 9-day exponential moving average
Fibonacci: There are several Fibonacci lines used in technical analysis. Fibonacci numbers are a sequence of numbers in which each successive number is the sum of the two previous numbers.
MA20: 20-day moving average
MA50: 50-day moving average
MA100: 100-day moving average
MA200: 200-day moving average
MACD: Moving average convergence divergence
Risks
External author:
This information is in the sole responsibility of the guest author and does not necessarily represent the opinion of Bank Vontobel Europe AG or any other company of the Vontobel Group. The further development of the index or a company as well as its share price depends on a large number of company-, group- and sector-specific as well as economic factors. When forming his investment decision, each investor must take into account the risk of price losses. Please note that investing in these products will not generate ongoing income.
The products are not capital protected, in the worst case a total loss of the invested capital is possible. In the event of insolvency of the issuer and the guarantor, the investor bears the risk of a total loss of his investment. In any case, investors should note that past performance and / or analysts' opinions are no adequate indicator of future performance. The performance of the underlyings depends on a variety of economic, entrepreneurial and political factors that should be taken into account in the formation of a market expectation.
Disclaimer:
This information is neither an investment advice nor an investment or investment strategy recommendation, but advertisement. The complete information on the products (securities) mentioned herein, in particular the structure and risks associated with an investment, are described in the base prospectus, together with any supplements, as well as the final terms relating to the securities. The base prospectus and final terms constitute the solely binding sales documents for the products mentioned herein. It is recommended that potential investors read these documents before making any investment decision. The documents and the key information document are published on the website of the issuer, Vontobel Financial Products GmbH, Bockenheimer Landstrasse 24, 60323 Frankfurt am Main, Germany, on https://prospectus.vontobel.com and are available from the issuer free of charge. The approval of the prospectus should not be understood as an endorsement of the securities. The securities are products that are not simple and may be difficult to understand. This information includes or relates to figures of past performance. Past performance is not a reliable indicator of future performance. This information may only be distributed or published in countries where such distribution or publication is permitted by applicable law. As stated in the relevant base prospectus, the distribution of the securities mentioned in this information is subject to restrictions in certain jurisdictions. This advertisement may not be reproduced or redistributed without prior permission by Vontobel.
© Bank Vontobel Europe AG and / or affiliated companies. All rights reserved.