Gold could benefit from higher inflation

Fed chairman Jerome Powell lowered investors' hopes on Friday, August 26th, by saying the central bank will have to raise policy rates to curb inflation.
Fed chairman Jerome Powell lowered investors' hopes on Friday, August 26th, by saying the central bank will have to raise policy rates to curb inflation. The yield on a two-year US Treasury bond rose to 3.38%, higher than the equivalent 10-year rate (3.11%), indicating that the bond market is pricing in a recession in the US. This is in line with Powell's observation that a weaker economy and labour market are needed to bring down the rate of inflation and that this could be painful for some households.
The fall in stock prices has erased some of the earlier gains in July in the stock markets, especially in Europe (save the FTSE index in London). Technically, the chart for the leading S&P500 index in New York looks ugly now, with a continued decline looking more likely than vice versa. Buyers need to come into the market and prove otherwise, and it didn't happen on Monday, August 29th.
The HYG ETF, which reflects investors' risk appetite for US junk bonds, is, like equity markets, still in a downtrend.
US HYG ETF (in USD), a weekly five-year price chart

On Thursday, 1 September, the August Purchasing Managers' Index will be released from the US, but also from Japan, China, the UK, Germany, France, Italy, Spain, etc. The Purchasing Managers' Index should be above 50 to indicate continued growth in the economy. In the case of the United States (ISM for manufacturing), expectations are 52.0.
This will be followed on Friday, 2 September, by the US employment report for August and an unemployment figure. Last time (in July), the US labour market over-performed. This time, the forecast for Non-Farm Payrolls is for 285K new jobs, which would be just over half of the 528K new jobs posted in July. Expectations have come down, and there may be a chance for a positive surprise again. At the same time, there is a risk that a strong labour market could trigger further increases in interest rates.
Hence, it can be challenging to see the stock market turning from Bear to Bull in the short term. Rising interest rates seem to be preventing that. Therefore, an investment in gold, could be a classic hedge in times of high inflation. Notably, the gold price performed very strongly in the early 1970s in the context of the oil crisis linked to the Yom Kippur War and the high inflation that followed, which given low GDP growth during the same period, became stagflation.
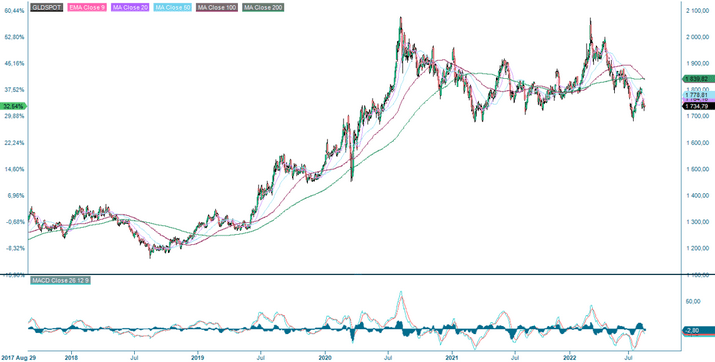
GOLD Spot (in USD per troy ounce), a daily one-year price chart

Technically, the USD 1700 level looks like a floor for the gold price. The rising USD has also depressed the price of USD-denominated commodities (including Gold), all else equal.
GOLD Spot (in USD per troy ounce), a weekly five-year price chart
The full name for abbreviations used in the previous text:
EMA 9: 9-day exponential moving average
Fibonacci: There are several Fibonacci lines used in technical analysis. Fibonacci numbers are a sequence of numbers in which each successive number is the sum of the two previous numbers.
MA20: 20-day moving average
MA50: 50-day moving average
MA100: 100-day moving average
MA200: 200-day moving average
MACD: Moving average convergence divergence
Risks
External author:
This information is in the sole responsibility of the guest author and does not necessarily represent the opinion of Bank Vontobel Europe AG or any other company of the Vontobel Group. The further development of the index or a company as well as its share price depends on a large number of company-, group- and sector-specific as well as economic factors. When forming his investment decision, each investor must take into account the risk of price losses. Please note that investing in these products will not generate ongoing income.
The products are not capital protected, in the worst case a total loss of the invested capital is possible. In the event of insolvency of the issuer and the guarantor, the investor bears the risk of a total loss of his investment. In any case, investors should note that past performance and / or analysts' opinions are no adequate indicator of future performance. The performance of the underlyings depends on a variety of economic, entrepreneurial and political factors that should be taken into account in the formation of a market expectation.
Disclaimer:
This information is neither an investment advice nor an investment or investment strategy recommendation, but advertisement. The complete information on the products (securities) mentioned herein, in particular the structure and risks associated with an investment, are described in the base prospectus, together with any supplements, as well as the final terms relating to the securities. The base prospectus and final terms constitute the solely binding sales documents for the products mentioned herein. It is recommended that potential investors read these documents before making any investment decision. The documents and the key information document are published on the website of the issuer, Vontobel Financial Products GmbH, Bockenheimer Landstrasse 24, 60323 Frankfurt am Main, Germany, on https://prospectus.vontobel.com and are available from the issuer free of charge. The approval of the prospectus should not be understood as an endorsement of the securities. The securities are products that are not simple and may be difficult to understand. This information includes or relates to figures of past performance. Past performance is not a reliable indicator of future performance. This information may only be distributed or published in countries where such distribution or publication is permitted by applicable law. As stated in the relevant base prospectus, the distribution of the securities mentioned in this information is subject to restrictions in certain jurisdictions. This advertisement may not be reproduced or redistributed without prior permission by Vontobel.
© Bank Vontobel Europe AG and / or affiliated companies. All rights reserved.