Strong Q1 2024 season and outlook in the US

Gold initially fell last week on the back of US macroeconomic data, before rallying on the back of the weak employment report. Next week, China's trade balance is likely to have some impact on gold. Longer term, we believe the bull case for gold remains solid. The fundamentals for the stock market look solid after strong Q1 reports from Amazon and Apple, as well as rather weak US non-farm payrolls last week.
Case of the week: Gold price moved by US and Chinese macro data
On Tuesday the 30th of April, the gold price reversed course and fell to its lowest level in more than three weeks, dropping below $2,298 per ounce, a one-day loss of more than 2%. Earlier in the day, data from the United States showed that the Employment Cost Index rose by 1.2% in the first quarter. This was up from 0.9% in the fourth quarter of 2023 and helped push US Treasury yields higher and the gold price lower. Meanwhile, the US dollar continued to strengthen. The Wall Street Journal's Nick Timiraos reported that with strong inflation data in the first quarter of 2024, the Fed will emphasize that it is prepared to keep interest rates on hold for longer than previously expected.
On Wednesday 1st May the Fed left its key interest rate unchanged at an expected 5.25-5.5%. In its statement, the US central bank announced that from 1 June it will reduce the pace at which it is shrinking its federal balance sheet, allowing only $25bn of Treasury bonds to be sold each month, down from the current $60bn.
With the Fed meeting not turning out to be as hawkish as the market had feared, the yield on the benchmark 10-year US Treasury note fell by more than 1% on Wednesday 1 May and the USD weakened against other currencies. As a result, gold prices climbed back above $2,300 per ounce. Meanwhile, the Bank of Japan appeared to intervene in the currency markets for the second time this week, putting further pressure on the USD.
The USD rallied on Thursday 2 April after the Bureau of Labor Statistics (BLS) reported that US labor costs rose 4.7% in the first quarter, limiting the upside for the gold price.
The US Bureau of Labor Statistics reported on Friday 3 that non-farm payrolls rose by 175,000 in April, the smallest increase in six months. Other details of the non-farm payrolls report showed that the unemployment rate ticked up slightly to 3.9%. In addition, average hourly earnings rose by 0.2% on the month, beating analysts' expectations of a 0.3% increase. Despite the weak employment data, the gold price failed to attract investors as the market remained risk positive heading into the weekend.
On Thursday 9 May, market participants will be watching China's trade balance data closely. It could be a positive development for the outlook for gold demand if China's trade surplus widens more than expected in April, with the initial market reaction helping to push gold prices higher. Generally, we have seen some signs of improvement of the Chinese economy in the last quarters, which would be good news for the gold price.
From a technical perspective, the Relative Strength Index (RSI) on the daily chart has dropped below 50, indicating a short-term bearish trend. In addition, gold has closed below its 20-day simple moving average (SMA) for the past five trading sessions. We expect gold to consolidate within a range this week. Longer term, however, gold remains an attractive investment. Powell's comments put a ceiling on interest rates, which should provide stable support for gold. The long-term bull case for gold remains solid as major countries continue to buy gold and investor demand to hedge sovereign debt grows.
Gold (USD per ounce), one-year daily chart

Gold (USD per ounce), five-year weekly chart

Macro comments
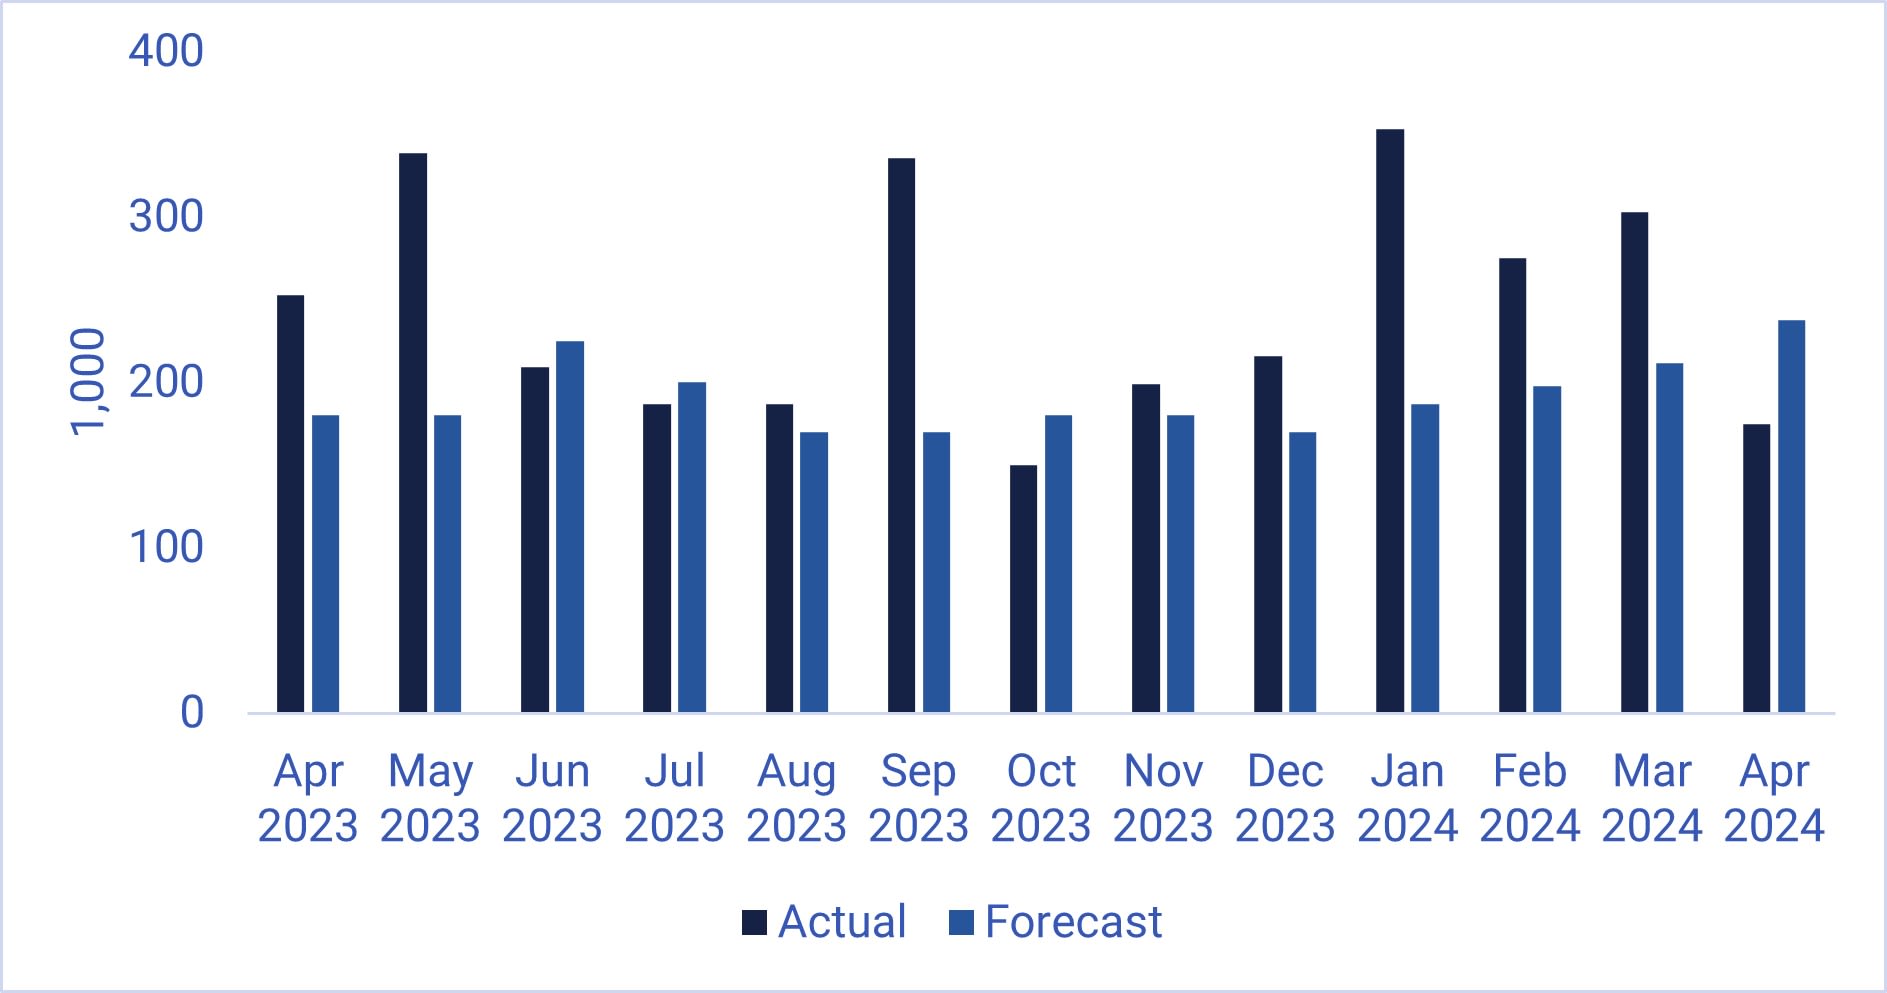
The US Q1 earnings season has continued to be strong, with both Amazon and Apple beating expectations last week. Sentiment on the New York Stock Exchange was further boosted by the weak US Non-Farm Payrolls data for April, which came in at 175,000 new jobs versus expectations for 238,000 on Friday 3rd May. As the chart below shows, US NFP figures have beaten forecasts for the last five months (November 2023 to March 2024).The US 2-year yield initially fell by 12 basis points from 4.87% to 4.75%.
US Nonfarm payrolls (1,000) April 2022-April 2024
As of Friday 3 May 2024, around 400 S&P 500 companies (80% of all companies) have reported their Q1 2024 results. 77% have reported positive earnings surprises and 61% have reported positive revenue surprises.
The average earnings growth rate for S&P500 companies for Q1 2024 is 5.0%. This compares with earnings growth of 3.4% ahead of Q1 reports on 31 March 2024.
Analysts now forecast earnings growth for S&P500 companies of 9.6% in Q2 2024, 8.4% in Q3 2024 and 17.1% in Q4 2024.
Healthcare is the best performing S&P500 sector with 90% of Q1 2024 earnings beating estimates. Information Technology is second best with 87% of earnings beating estimates, followed by Consumer Staples and Communications Services with 85% of Q1 earnings beating estimates. The four worst performing sectors are Consumer Discretionary, Financials, Real Estate and Energy with 69%, 69%, 68% and 57% of Q1 2024 earnings beating estimates respectively.
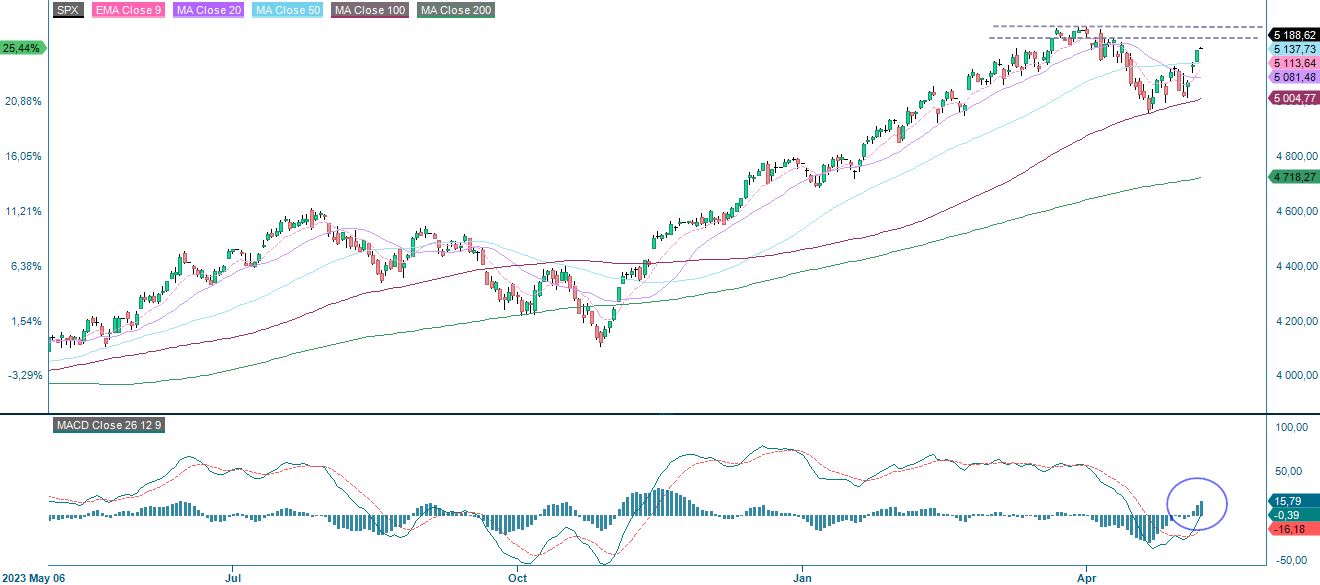
Will the S&P 500 next test the previous high?
The S&P 500 managed to break above both the MA20 and the MA50. Note that the MACD has given a buy signal. The next level to the upside is between 5,180 and 5,265. However, keep an eye on US Treasury yields as both the 10-year and 2-year yields are trading on support. If stocks turn south with a bounce in yields, the first level of support on the downside will be the MA50, currently at 5,137.
S&P 500 (in USD), one-year daily chart
S&P 500 (in USD), weekly five-year chart

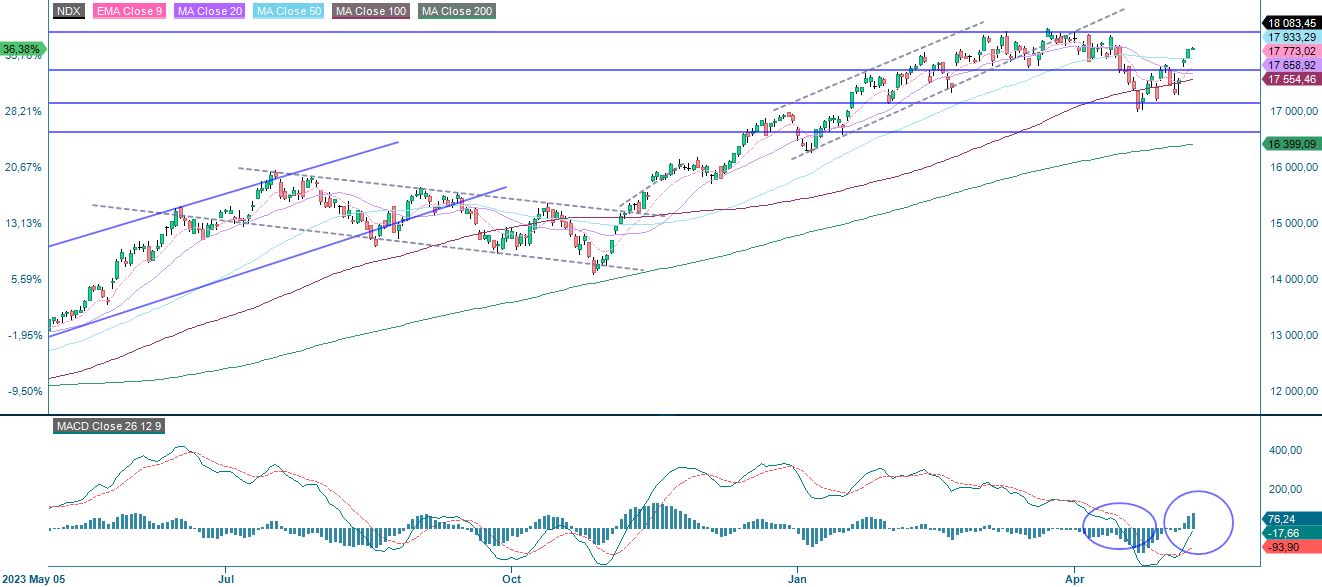
The tech-heavy Nasdaq 100 is also trading above its MA20 and MA50. The MACD is about to give a buy signal. There is a good chance that the 18,300 and 18,320 levels will be tested. However, it is important to keep an eye on US Treasury yields.
Nasdaq 100 (in USD), one-year daily chart
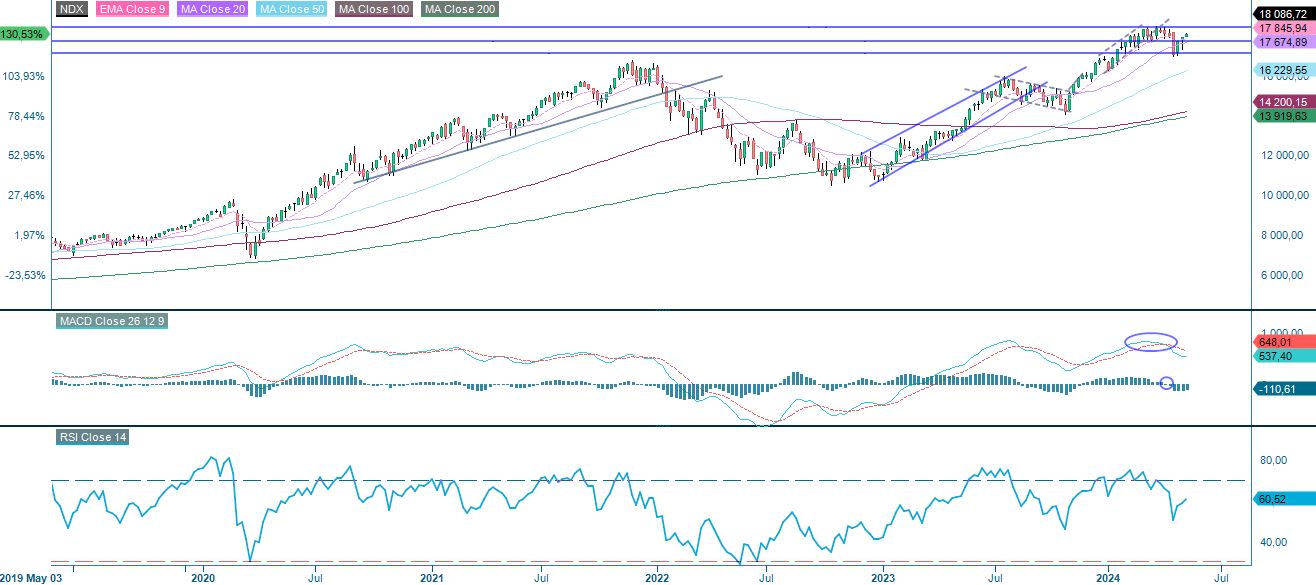
The Nasdaq 100 rather than the S&P 500 looks very convincing from a strict technical perspective on the weekly chart. A target level on the upside has thus been reached, and one could consider reducing the size of potential long positions.
Nasdaq 100 (in USD), weekly five-year chart
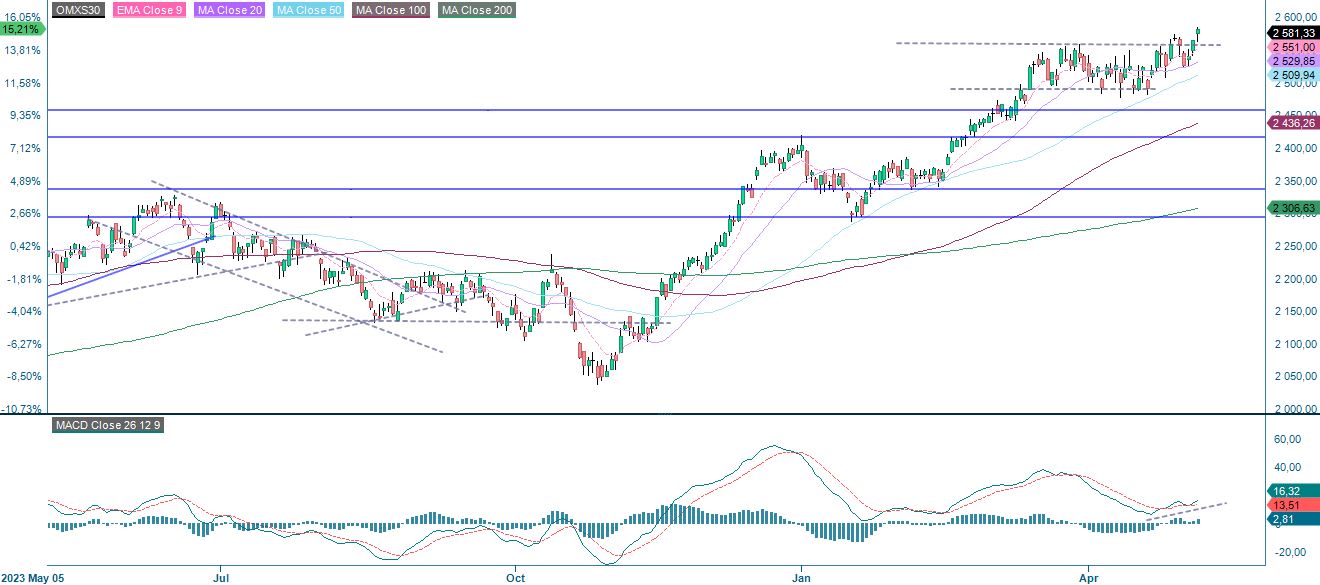
The Swedish OMXS30 has once again broken above the trading range... Momentum is positive and rising. So, with a little help from the US, the OMXS30 could continue to rise. It is also worth noting that there is room for the OMXS30 to catch up with the US equity indices.
OMXS30 (in SEK), one-year daily chart
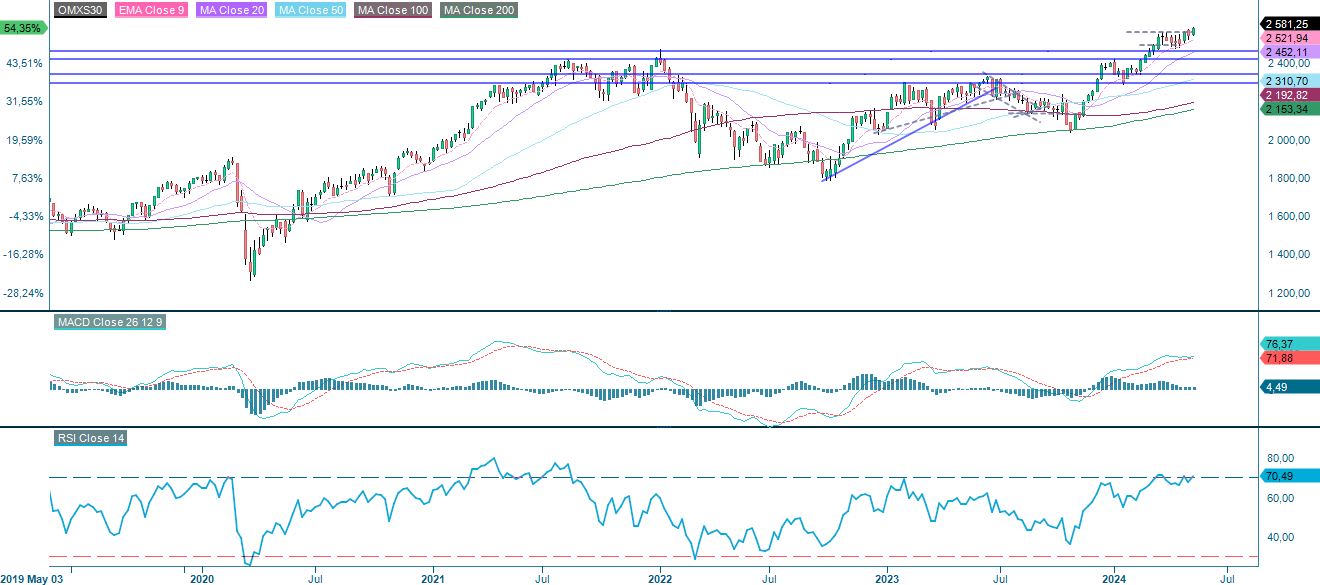
OMXS30 (in SEK), weekly five-year chart
The German DAX looks set to test its previous high just south of 18,500.
DAX (in EUR), one-year daily chart

DAX (in EUR), weekly five-year chart

The full name for abbreviations used in the previous text:
EMA 9: 9-day exponential moving average
Fibonacci: There are several Fibonacci lines used in technical analysis. Fibonacci numbers are a sequence in which each successive number is the sum of the two previous numbers.
MA20: 20-day moving average
MA50: 50-day moving average
MA100: 100-day moving average
MA200: 200-day moving average
MACD: Moving average convergence divergence
Risks
External author:
This information is in the sole responsibility of the guest author and does not necessarily represent the opinion of Bank Vontobel Europe AG or any other company of the Vontobel Group. The further development of the index or a company as well as its share price depends on a large number of company-, group- and sector-specific as well as economic factors. When forming his investment decision, each investor must take into account the risk of price losses. Please note that investing in these products will not generate ongoing income.
The products are not capital protected, in the worst case a total loss of the invested capital is possible. In the event of insolvency of the issuer and the guarantor, the investor bears the risk of a total loss of his investment. In any case, investors should note that past performance and / or analysts' opinions are no adequate indicator of future performance. The performance of the underlyings depends on a variety of economic, entrepreneurial and political factors that should be taken into account in the formation of a market expectation.
Credit risk of the issuer:
Investors in the products are exposed to the risk that the Issuer or the Guarantor may not be able to meet its obligations under the products. A total loss of the invested capital is possible. The products are not subject to any deposit protection.
Market risk:
The value of the products can fall significantly below the purchase price due to changes in market factors, especially if the value of the underlying asset falls. The products are not capital-protected
Risk with leverage products:
Due to the leverage effect, there is an increased risk of loss (risk of total loss) with leverage products, e.g. Bull & Bear Certificates, Warrants and Mini Futures.
Product costs:
Product and possible financing costs reduce the value of the products.
Currency risk:
If the product currency differs from the currency of the underlying asset, the value of a product will also depend on the exchange rate between the respective currencies. As a result, the value of a product can fluctuate significantly.