Market uncertainty persists

Gold has gained as the war in Gaza has spread to Yemen and the Red Sea, as well as Iran and Pakistan. However, the price of gold is being held back by uncertainty over inflation in the US, where December Personal Consumption Expenditure (PCE) figures will be released on Friday 26th January. Technically, the S&P500 and Nasdaq look overbought on the Relative Strenth Index (RSI), while the OMX and DAX look more promising.
Case of the week: Gold's next hurdle is uncertainty over US inflation
Gold rose sharply during the US morning session on Friday the 19th of January, approaching the round $2040 mark. The main reason for this was that tensions in the Middle East remained high, leading to increased safe-haven demand for gold over the weekend. The weaker USD index was another external factor supporting the precious metals market. We are quite positive about gold from a fundamental point of view. However, we would be more skeptical (from a technical point of view) if gold were to fall below $2,000 per troy ounce.
In addition to the Gaza war between Israel and Hamas, the US and its allies responded with military air strikes against launch pads in Yemen after Houthi militia robots attacked US military ships and Western cargo vessels. In addition, Pakistan carried out military strikes against Iran just over 24 hours after Iranian air strikes in Baluchistan. The Pakistani military retaliated, further raising tensions between the neighbours, and raising fears of a wider conflict.
Against this backdrop, precious metals have rallied sharply. However, the near-term outlook is not bullish as bets on a Fed rate cut in March 2024 have diminished, making further upside limited.
The outlook for US inflation remains uncertain. Price growth is gradually decelerating, but recent inflation data point to a strong US economy, in particular robust household spending. This adds to inflationary pressures and makes it more likely that the Fed will maintain a restrictive monetary policy stance for an extended period.
In addition, US consumer confidence reached its highest level since July 2021 in January 2024, with the preliminary reading of the University of Michigan's consumer sentiment index coming in at 78.8. Over the past two months, confidence in the US has risen by a cumulative 29%, the largest two-month increase since the end of the recession in 1991.
In summary, the gold price may struggle against the US-dollar as the Federal Reserve may keep monetary policy tighter for longer than the market expects. However, once the Fed begins to ease, the US-dollar is likely to depreciate, which is usually a positive for gold. We believe that the fundamental support for precious metals remains good.
Gold (USD per troy ounce), one-year daily chart

Gold (USD per troy ounce), five-year weekly chart

Macro comments
Equity markets are dependent on central banks starting to cut interest rates. For this to happen, inflation must continue to fall. On Friday the 26th we will get the US December inflation rate according to the Fed's target measure, the "PCE deflator" (Personal Consumption Expenditure deflator). It is expected to come in at 2.6%.
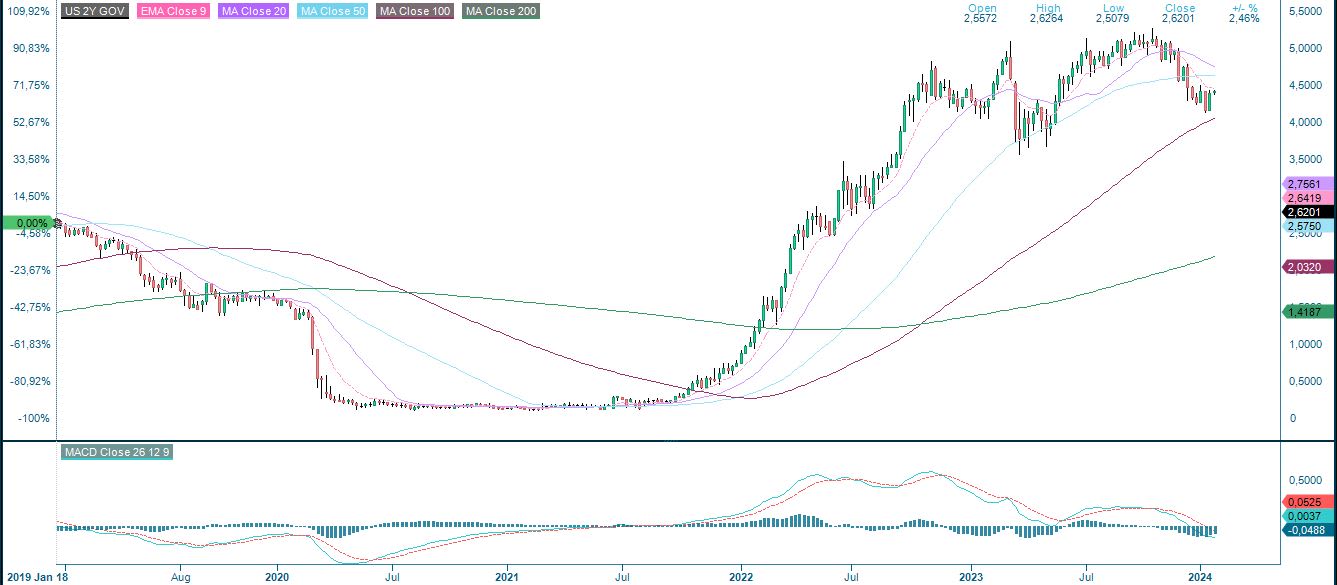
US PCE inflation was around 1.5% until March 2021, when it began to rise rapidly, peaking at 6.8% in July 2022. In March 2023, PCE is around 5%, and in May 2023 it is just over 4%, declining to 2.6% in December 2023. The US two-year Treasury yield has risen from a low of 4.09% on 12th January to 4.37% at the time of writing, indicating uncertainty about the future pace of inflation in the US.
US 2-year Treasury Yield (in %), one-year daily chart

US 2-year Treasury Yield (in %), five-year weekly chart
As of Friday 19 January 2024, around 50 S&P500 companies have reported their fourth quarter results. 62% of S&P companies have reported a positive EPS surprise and 62% have reported a positive revenue surprise.
For Q4 2023, the earnings decline for S&P500 companies is currently minus 1.7%. Seven out of eleven S&P500 sectors are expected to report lower earnings today compared to 31 December 2023. Utilities, Information Technology and Communication Services are expected to have the highest earnings growth in Q4 2023. Meanwhile, Health Care, Materials and Energy are expected to have the lowest earnings growth in Q4 2023.
After a setback in Q3 2023, the trend of declining net profit margins for S&P500 companies is expected to continue in Q4 2023, falling to an estimated 10.7%.
Swedbank, Epiroc, SAP, AT&T, Tesla, IBM, Abbott Research, ASML Holding, Kimberly-Clark, The Progressive, ServiceNow, and Elevance Health publish their quarterly reports on Wednesday 24 January. This will be followed on Thursday 25 January by interim reports from SEB, Sandvik, Atlas Copco, Nokia, LVMH, Intel, Visa, Blackstone, Comcast, NextEra Energy, T-Mobile US, and Union Pacific. On Friday 26 January, Q3 2023 interim reports are due from Telia, Volvo, SCA, Autoliv, American Express and Colgate Palmolive.
Uncertainty with RSI almost overbought
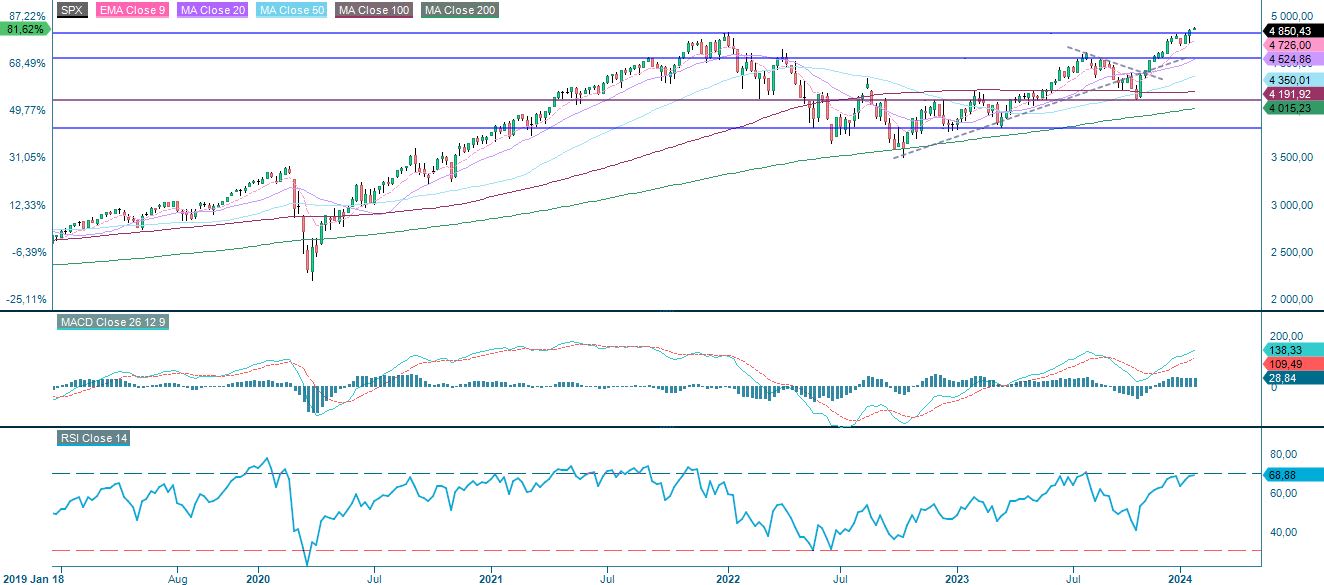
Despite little action on the bond market, the S&P 500 broke above the resistance. However, on Monday, a scary looking doji was created, implying uncertainty. Meanwhile, RSI is close to being overbought in both the daily chart and the weekly chart. Unless the rates start to come down clearly, one should be careful taking long new positions at these levels.
S&P 500 (in USD), one-year daily chart

S&P 500 (in USD), weekly five-year chart
As illustrated in the chart below, the Nasdaq 100 is already at overbought levels regarding RSI.
Nasdaq 100 (in USD), one-year daily chart

Nasdaq 100 (in USD), weekly five-year chart

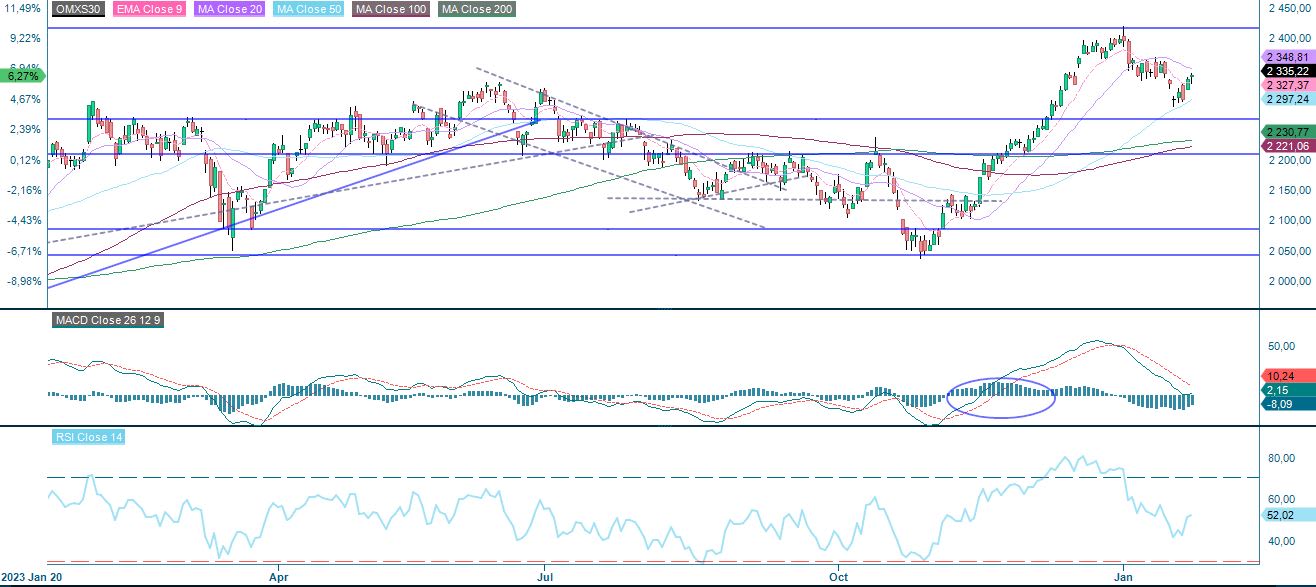
Swedish OMXS30 may be a little more interesting from the perspective of a long new position. As illustrated in the chart below, the index bounced nicely off MA50. A break above MA20, currently at 2,348 and the previous top around 2,400 may be next. To reduce risk, a spread being long OMXS30, and short S&P 500 may be an alternative.
OMXS30 (in SEK), one-year daily chart
OMXS30 (in SEK), weekly five-year chart

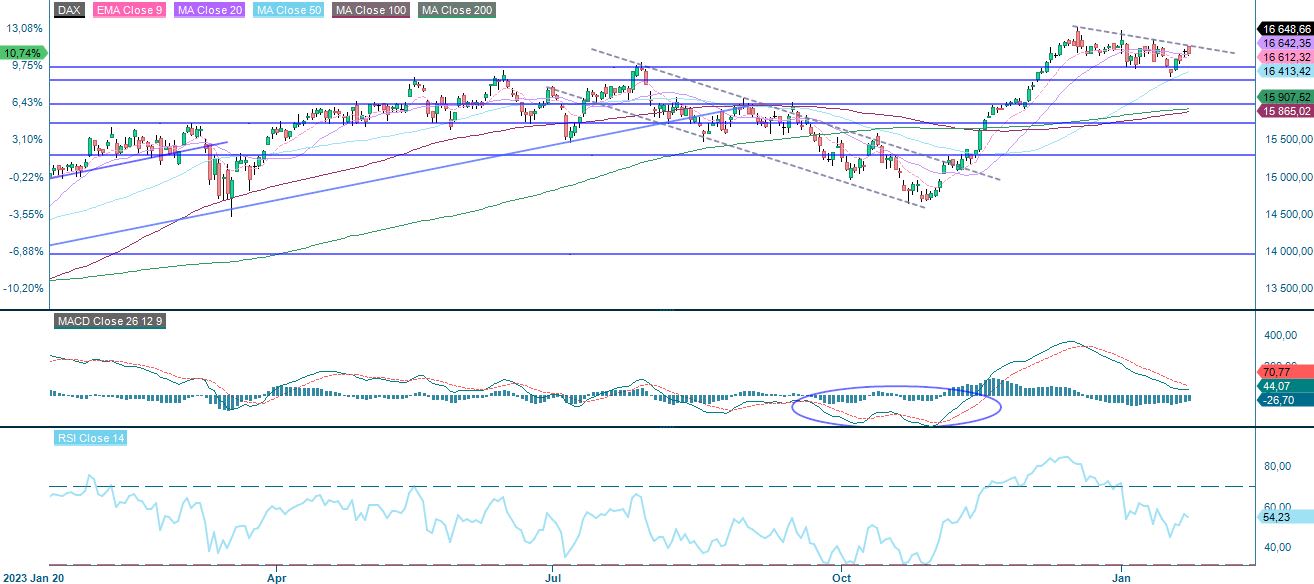
The German DAX also bounced nicely of MA50. The ceiling of the narrow falling trendline is the first resistance on the upside.
DAX (in EUR), one-year daily chart
DAX (in EUR), weekly five-year chart

The full name for abbreviations used in the previous text:
EMA 9: 9-day exponential moving average
Fibonacci: There are several Fibonacci lines used in technical analysis. Fibonacci numbers are a sequence in which each successive number is the sum of the two previous numbers.
MA20: 20-day moving average
MA50: 50-day moving average
MA100: 100-day moving average
MA200: 200-day moving average
MACD: Moving average convergence divergence
Risks
External author:
This information is in the sole responsibility of the guest author and does not necessarily represent the opinion of Bank Vontobel Europe AG or any other company of the Vontobel Group. The further development of the index or a company as well as its share price depends on a large number of company-, group- and sector-specific as well as economic factors. When forming his investment decision, each investor must take into account the risk of price losses. Please note that investing in these products will not generate ongoing income.
The products are not capital protected, in the worst case a total loss of the invested capital is possible. In the event of insolvency of the issuer and the guarantor, the investor bears the risk of a total loss of his investment. In any case, investors should note that past performance and / or analysts' opinions are no adequate indicator of future performance. The performance of the underlyings depends on a variety of economic, entrepreneurial and political factors that should be taken into account in the formation of a market expectation.
Credit risk of the issuer:
Investors in the products are exposed to the risk that the Issuer or the Guarantor may not be able to meet its obligations under the products. A total loss of the invested capital is possible. The products are not subject to any deposit protection.
Market risk:
The value of the products can fall significantly below the purchase price due to changes in market factors, especially if the value of the underlying asset falls. The products are not capital-protected
Risk with leverage products:
Due to the leverage effect, there is an increased risk of loss (risk of total loss) with leverage products, e.g. Bull & Bear Certificates, Warrants and Mini Futures.
Product costs:
Product and possible financing costs reduce the value of the products.
Currency risk:
If the product currency differs from the currency of the underlying asset, the value of a product will also depend on the exchange rate between the respective currencies. As a result, the value of a product can fluctuate significantly.