Time to take profits after a short-term rate rally?

This week we look at Baidu, the Chinese equivalent of Google, and its ERNIE search engine. Baidu will release its Q3 2023 report on 21 November. Baidu's stock, and its exposure to AI development, is cheaper than Google's, although it comes with a higher risk. We have seen a strong performance from the major equity indices over the past week, driven by lower long-term interest rates. It may be time to take some short-term profits.
Case of the week: Baidu inc, AI provided search for positive returns
Baidu, often referred to as the "Google of China," is a leading tech company specializing in internet-related services and artificial intelligence. Baidu is at the forefront of AI research and development in China, making significant strides in natural language processing, autonomous vehicles, and deep learning technologies, contributing significantly to China's tech landscape. In August 2023, Baidu introduced its own AI bot named ERNIE, which shares a lot of similarities with OpenAI´s popular AI-chatbot ChatGPT and Google´s chatbot Bard.
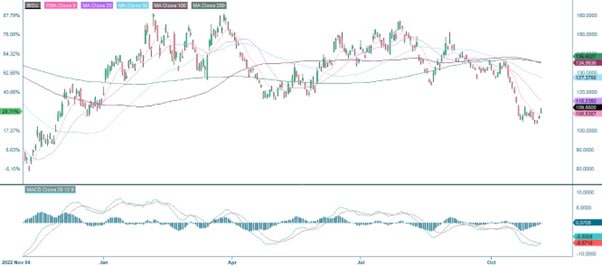
Baidu's share price has fallen by around 25% in the last three months, despite a strong Q2 2023 report showing 15% year-on-year growth in net revenues and 53% growth in operating income. Given the recent fall in the share price, Baidu currently trades at around 13.8x forward earnings. This is significantly cheaper than Google, which trades at 20.6x. On a P/S basis, Baidu is trading at around 2.3x, while Google is trading at 5.1x.
The ongoing AI chatbot frenzy began with OpenAI's introduction of ChatGPT, which amazed the public by swiftly responding to questions and engaging in conversations. The significant impact of AI chatbots on the market was highlighted when Microsoft committed a $10 billion investment in OpenAI, recognizing the potential in the technology. Google followed by launching its own chatbot, Bard, integrating it into key services like Google Cloud. Baidu recently unveiled its own AI bot called ERNIE, which has the potential to be seamlessly integrated into Baidu's search engine. Such integration could significantly increase user engagement and potentially result in improved conversions for merchants advertising on Baidu’s search platform.
According to Statista, Baidu is the most popular search engine in China, with a market share of more than 60%. Baidu's strong position in the Chinese and Asian markets allows it to easily gain momentum by integrating AI chatbot capabilities into its search business. This could further boost the company's already increasing revenue growth.
Given that Baidu's shares look cheaper than Google's, as indicated by both the Price/Earnings P/E and Price-toSales P/S ratios, combined with the recent fall in the share price, Baidu's shares could soon be on the verge of a rebound. However, as always with Chinese stocks, the risks are high. One of the main risk factors when investing in Chinese tech stocks is the high level of political risk. For example, unpredictable regulatory changes that add to existing commercial risks. However, keep an eye on Baidu's Q3 2023 report, which is due to be released on 21 November. It could very well provide a short-term boost to the share price, regardless of the current political risk.
Baidu Inc. (USD), one-year daily chart
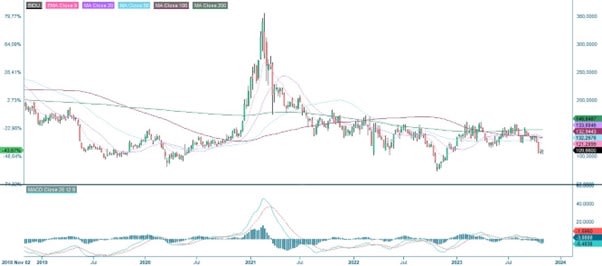
Baidu Inc. (USD), five-year weekly chart
Macro comments
As expected, the US Federal Reserve left its key interest rate unchanged on Wednesday 1st November. This was the second meeting in a row at which the rate was held steady. The market is now pricing in a 90% probability of an unchanged rate in December, up from 80% before the US employment report (see details below). At the same time, the probability that the Fed will begin tapering in June next year has risen.
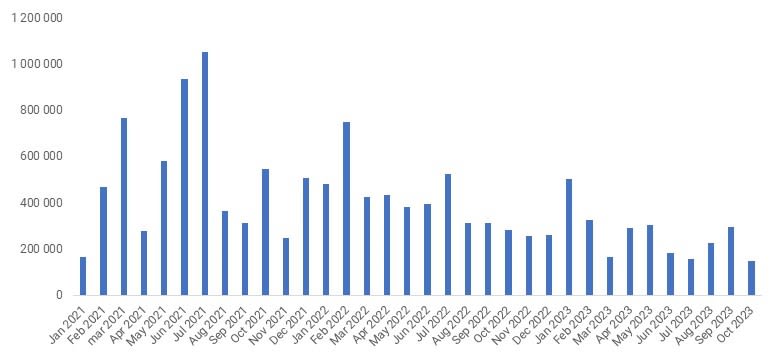
On Friday 3rd November the Non-Farm Payrolls in the United States came in at 150,000 new jobs in October against expectations of 180,000. Meanwhile, hourly earnings rose by 0.2% last month, an annual rate of 4.1% versus expectations for 4.0%. This should be a reasonably good number for both equity and bond markets. The yield on 10-year US Treasuries fell by 30 basis points from 4.89% on 31 October to 4.55% on 3 November. Since then, it has risen slightly to 4.61% on 7 November.
US Nonfarm Payrolls January 2021-October 2023
82% of S&P companies have reported a positive Earnings-per Share (EPS) surprise and 62% have reported a positive revenue surprise as of Friday 3 November.
Comparing the eleven S&P500 sectors, Commercial Services is now tied with Information Technology at the top of the EPS surprise list, with 94% of Q3 2023 EPS beating expectations. Industrials have gained ground and are now in third place, with 88% of Q3 2023 EPS beating expectations. The worst performing sectors in terms of Q3 2023 earnings surprises are Materials, Real Estate and Energy with 74%, 69% and 68% of their Q3 EPS beating expectations respectively.
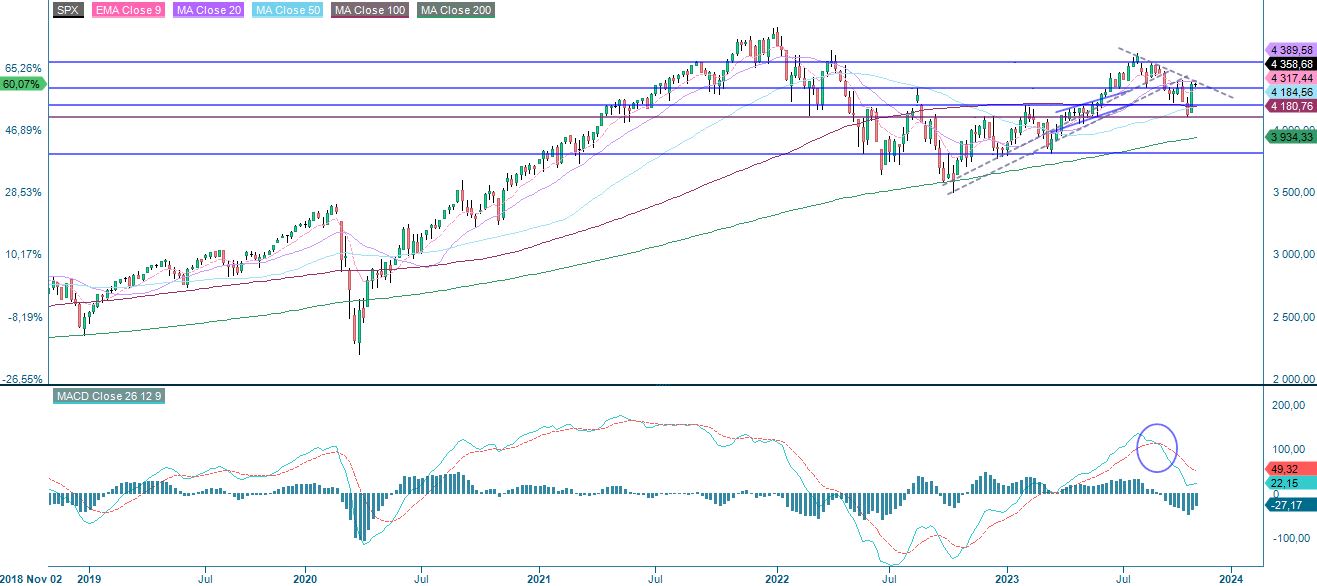
Scary doji calls for partial profit-taking
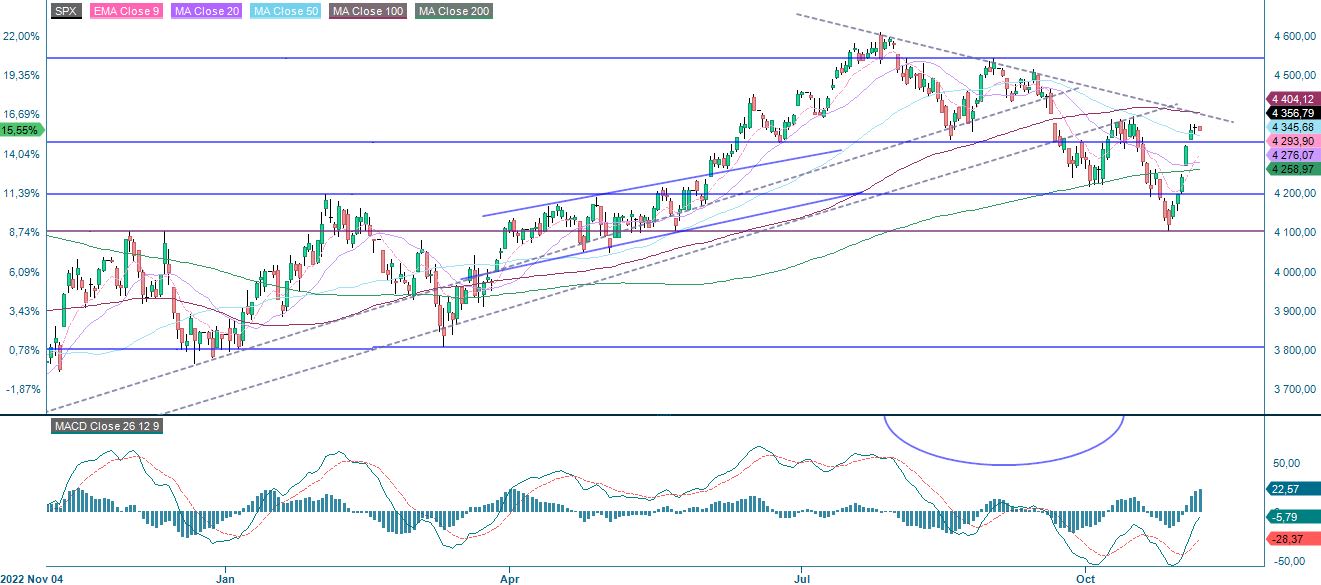
As illustrated in the chart below, a scary looking "doji" was formed on Monday 6 November in S&P 500. This implies uncertainty. However, one should not ignore MACD that is close to generating a buy signal. In case of a break above MA100, currently at 4,404, and 4,500 may be next. But in the end, equities have seen a strong week. Realising some profits on any long positions may not be a bad idea.
Related Products
S&P 500 (in USD), one-year daily chart
S&P 500 (in USD), weekly five-year chart
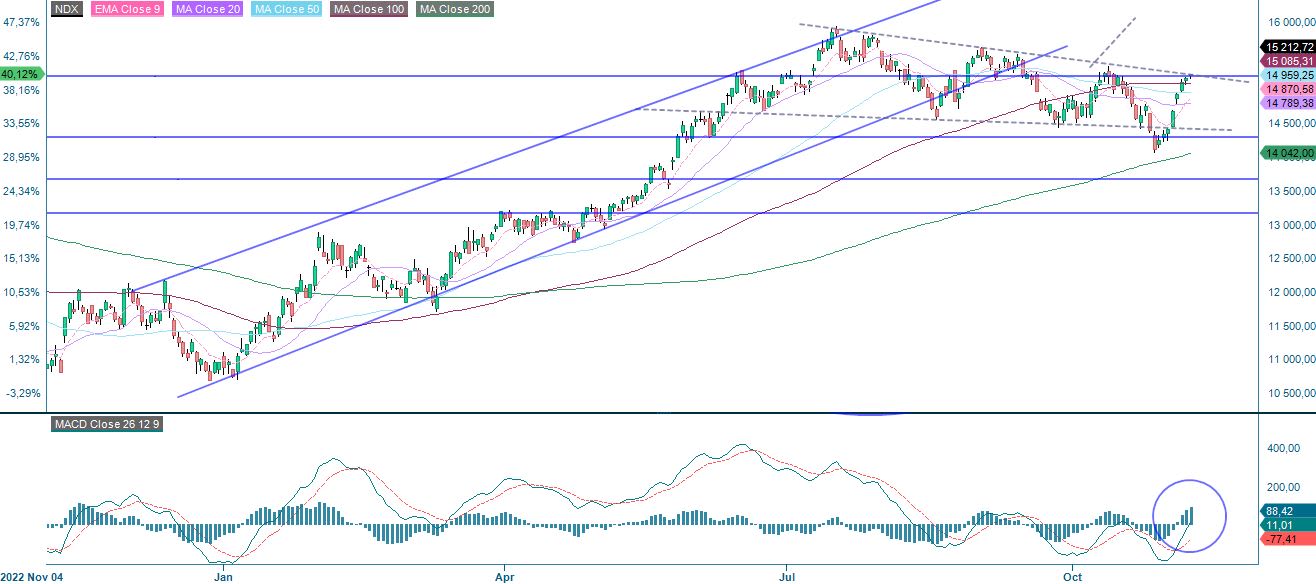
Nasdaq 100 is trading at resistance. Given the strong week we have seen, realising some profits may not be a bad idea either. However, one should also note that MACD has generated a buy-signal in the daily chart below. A break below 4,3% yield on the 10-year US T-bill may be a clear catalyst for equities to continue to show strength and challenge previous highs from the summer.
Related Products
Nasdaq 100 (in USD), one-year daily chart
Nasdaq 100 (in USD), weekly five-year chart
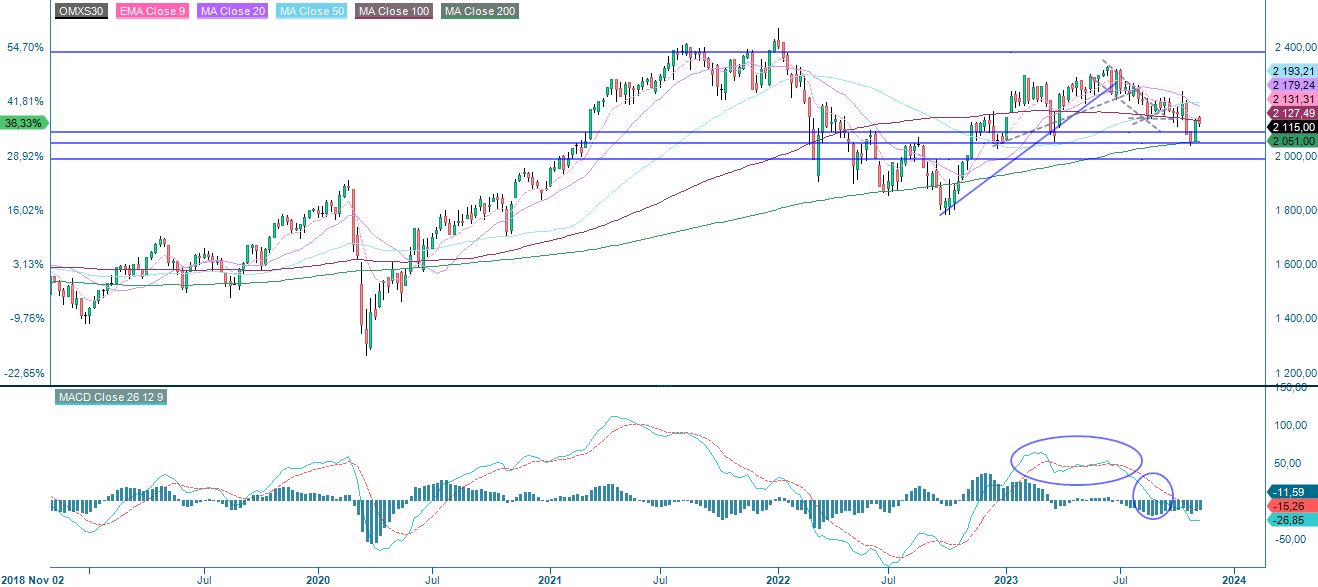
Swedish OMXS30 is once again trading below MA20. A break below EMA9, currently at 2,103 and the 2,085-level may be next. If instead a break above MA100, currently at 2,147, MA100 at 2,186 may be next.
OMXS30 (in SEK), one-year daily chart
OMXS30 (in SEK), weekly five-year chart
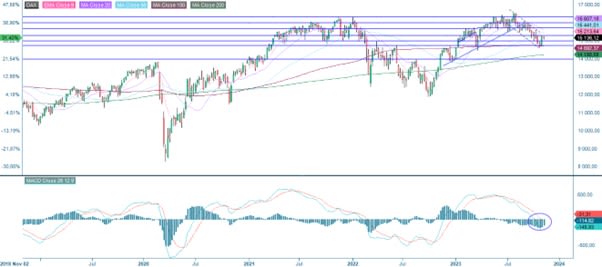
DAX tested the top of the bearish trend but failed to break above. A break below the MA20 and EMA9 just above 15,000 and 14,800 may be next. Instead, a break above 15,300 and 15,640 could be next.
DAX (in EUR), one-year daily chart
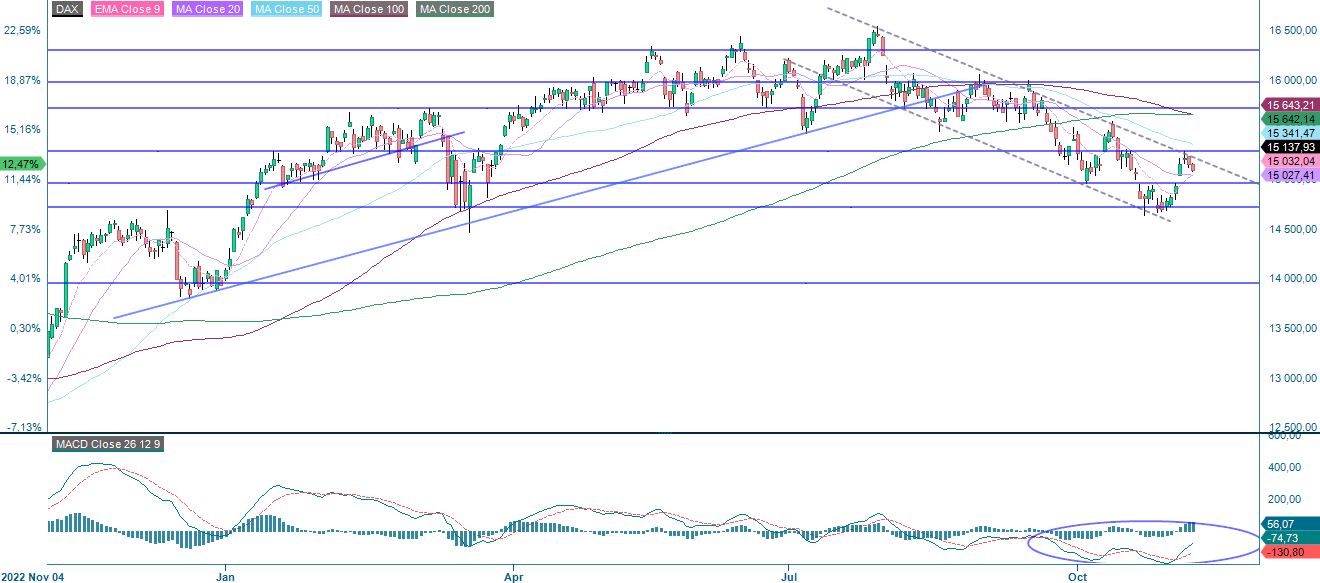
DAX (in EUR), weekly five-year chart
The full name for abbreviations used in the previous text:
EMA 9: 9-day exponential moving average
Fibonacci: There are several Fibonacci lines used in technical analysis. Fibonacci numbers are a sequence in which each successive number is the sum of the two previous numbers.
MA20: 20-day moving average
MA50: 50-day moving average
MA100: 100-day moving average
MA200: 200-day moving average
MACD: Moving average convergence divergence
Risks
External author:
This information is in the sole responsibility of the guest author and does not necessarily represent the opinion of Bank Vontobel Europe AG or any other company of the Vontobel Group. The further development of the index or a company as well as its share price depends on a large number of company-, group- and sector-specific as well as economic factors. When forming his investment decision, each investor must take into account the risk of price losses. Please note that investing in these products will not generate ongoing income.
The products are not capital protected, in the worst case a total loss of the invested capital is possible. In the event of insolvency of the issuer and the guarantor, the investor bears the risk of a total loss of his investment. In any case, investors should note that past performance and / or analysts' opinions are no adequate indicator of future performance. The performance of the underlyings depends on a variety of economic, entrepreneurial and political factors that should be taken into account in the formation of a market expectation.
Disclaimer:
This information is neither an investment advice nor an investment or investment strategy recommendation, but advertisement. The complete information on the products (securities) mentioned herein, in particular the structure and risks associated with an investment, are described in the base prospectus, together with any supplements, as well as the final terms relating to the securities. The base prospectus and final terms constitute the solely binding sales documents for the products mentioned herein. It is recommended that potential investors read these documents before making any investment decision. The documents and the key information document are published on the website of the issuer, Vontobel Financial Products GmbH, Bockenheimer Landstrasse 24, 60323 Frankfurt am Main, Germany, on https://prospectus.vontobel.com and are available from the issuer free of charge. The approval of the prospectus should not be understood as an endorsement of the securities. The securities are products that are not simple and may be difficult to understand. This information includes or relates to figures of past performance. Past performance is not a reliable indicator of future performance. This information may only be distributed or published in countries where such distribution or publication is permitted by applicable law. As stated in the relevant base prospectus, the distribution of the securities mentioned in this information is subject to restrictions in certain jurisdictions. This advertisement may not be reproduced or redistributed without prior permission by Vontobel.
© Bank Vontobel Europe AG and / or affiliated companies. All rights reserved.
Credit risk of the issuer:
Investors in the products are exposed to the risk that the Issuer or the Guarantor may not be able to meet its obligations under the products. A total loss of the invested capital is possible. The products are not subject to any deposit protection.
Market risk:
The value of the products can fall significantly below the purchase price due to changes in market factors, especially if the value of the underlying asset falls. The products are not capital-protected
Risk with leverage products:
Due to the leverage effect, there is an increased risk of loss (risk of total loss) with leverage products, e.g. Bull & Bear Certificates, Warrants and Mini Futures.
Currency risk:
If the product currency differs from the currency of the underlying asset, the value of a product will also depend on the exchange rate between the respective currencies. As a result, the value of a product can fluctuate significantly.