FTC speculation puts spotlight on Amazon's premium valuation

Amazon may be facing a lawsuit by the U.S. Federal Trade Commission (FTC). This has put a spotlight on the company's dominance of the e-commerce landscape, as well as its high valuation relative to peers in all sub-sectors. The European Central Bank will announce its interest rate decision on Thursday, 14 September. The Fed and the Swedish Riksbank follow on Wednesday, 20 September. The Fed is expected to keep its policy rates unchanged. Technical momentum is generally fading for the stock indices.
Case of the week: FTC Lawsuit Casts Shadows on Amazon's Dominance in the E-commerce Landscape
Recently, there has been a growing crescendo of speculation about the U.S. Federal Trade Commission's antitrust unit preparing to initiate legal action against Amazon concerning its management of the world's foremost e-commerce platform. Speculation suggests that the government is considering potentially dismantling Amazon into separate entities to foster greater competition in the online retail landscape.
Should the company split into several distinct entities, beginning with its e-commerce retail segment, this move could potentially elicit dissatisfaction among current Amazon shareholders concerning their financial outcomes. Such a restructuring might stifle growth rates and introduce fresh accounting, managerial, and marketing expenses for each separate entity, challenging the prompt attainment and sustenance of individual and overall operational profitability.
On the contrary, some argue that Amazon would be better off as several entities, making achieving a 10-20 per cent annual growth rate easier than its current structure.
Regardless of whether an eventual split is negative or positive, Amazon's business model, characterised by its ownership and control over a substantial portion of the online retail marketplace, is currently facing mounting scrutiny and challenges.
Looking at valuation, the Amazon share is currently trading at $138. Although this is lower than the all-time high of $186.6, the share price has increased by 64% year to date. Amazon's share price can be seen as inflated compared to various peers. Amazon can be classified within several sectors, from tech to goods delivery. In our peer group, we have chosen tech (Microsoft, Apple, Alphabet and Meta), retail (Walmart and Target), and goods delivery companies (FedEx and UPS). As shown in the chart below, Amazon trades at significantly higher levels than its peers, regardless of sector, with a staggering next twelve months Price-to-Earnings (P/E) ratio of 68.3x.
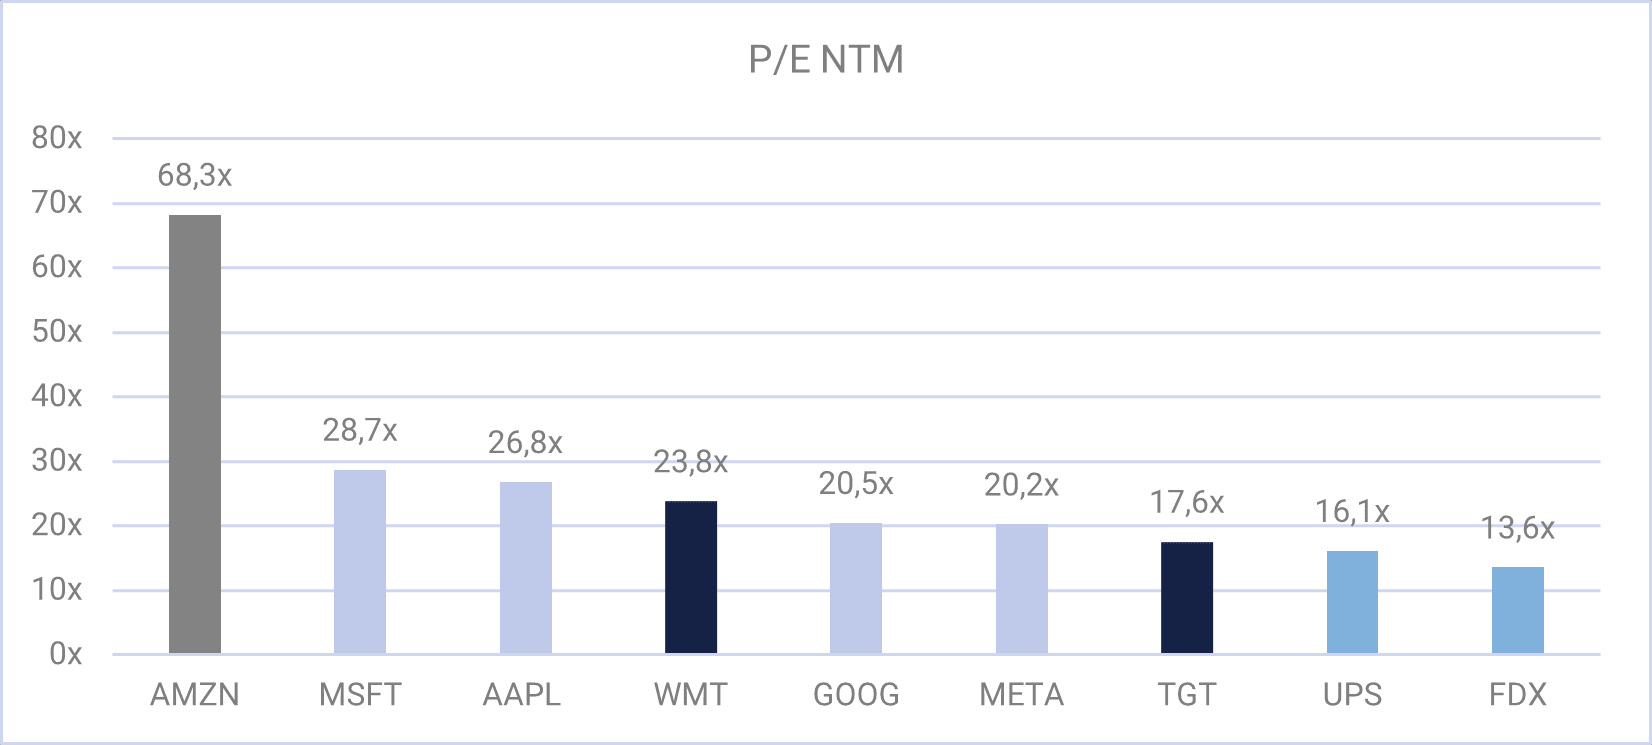
For the tech companies, the average next twelve months P/E is currently 24,1x. The retail companies showcase an average next twelve months P/E of 20.7x, while the goods delivery players come in at 14.8x.
Regarding profitability, Amazon's profit margin last twelve months amounts to 8.3%. Amazon's profitability is low compared to the tech companies, which, on average, showcase 27% in profit margins. Compared to UPS (9.44%) and FedEx (7.01%), Amazon is pretty much on point, while the profitability is lower for Walmart and Target (average 2.4%).

The share price is arguably high regardless of which sector investors place Amazon in. The market seems to have largely overlooked the potential FTC antitrust lawsuit against Amazon thus far, with Amazon's stock maintaining its high valuation. Given the FTC's lengthy investigation, it is likely that they will proceed with the lawsuit. Consequently, Amazon's shares may experience increased volatility in the foreseeable future, with an underlying downside risk.
Amazon stock price chart (in USD), one-year daily chart

Amazon stock price chart (in USD), five-year weekly chart

Macro comments
US interest rates fluctuated last week but rose on Friday, the 8th of September. Today, Wednesday the 13th of September, investors will focus on the US August consumer price index. Tomorrow, on Thursday, the 14th of September, US producer price index figures for August are due. The Fed's next meeting is scheduled for Wednesday, the 20th of September. The market is pricing over a 90% chance that the Fed will leave its policy rates unchanged.
The probability that the European Central Bank will raise its policy rate on Thursday, the 14th of September, is around 40%, while the Riksbank is expected to raise the Swedish policy rate on the 20th of September with a 90% probability. Swedish Consumer Price Index figures for August will be released on Thursday, the 14th of September.
US 10-year yield (%), one-year daily chart

US 10-year yield (%), five-year weekly chart

On Thursday morning, 14th September, Japan's Machinery Orders and Industrial Production for July are due.
On the morning of Friday, 15th September, we will get statistics from China on the country's industrial production, investment, retail trade and unemployment in August. The US Industrial production for August is due later on Friday afternoon.
Momentum is fading
S&P 500 is struggling to maintain the positive momentum, as illustrated by MACD. The index is currently trading down below EMA9 but above MA20. A beak below MA20 and MA100, currently at 4,365, may be next.
S&P 500 (in USD), one-year daily chart

Also, MACD has generated a soft sell signal in the weekly chart below.
S&P 500 (in USD), weekly five-year chart

Nasdaq 100 is also struggling to keep the positive momentum going.
Nasdaq 100 (in USD), one-year daily chart

Again, MACD has generated a soft sell signal in the weekly chart.
Nasdaq 100 (in USD), weekly five-year chart

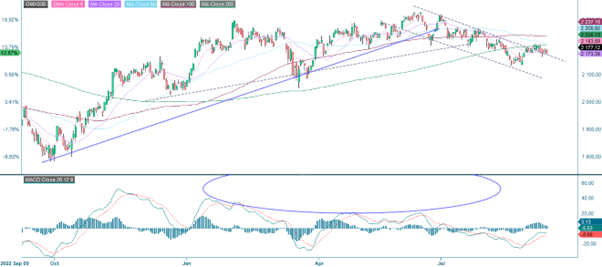
OMXS30 did not break up above MA200 and is trading downwards along the ceiling of a falling trend channel.
OMXS30 (in SEK), one-year daily chart
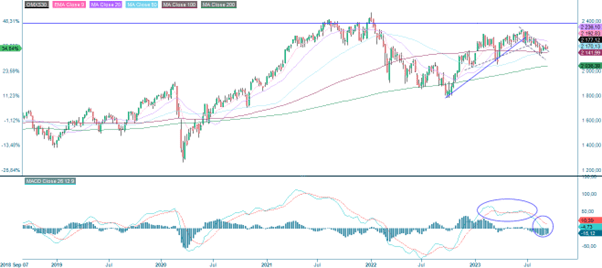
As shown in the weekly chart below, MACD generated a sell signal some time ago.
OMXS30 (in SEK), weekly five-year chart
DAX looks somewhat scary as the index is testing the support around 15,700 again. The next level on the downside is made up by MA200, currently just below 15,500. In case of a break below this level 15,000 may be next.
DAX (in EUR), one-year daily chart

DAX (in EUR), weekly five-year chart

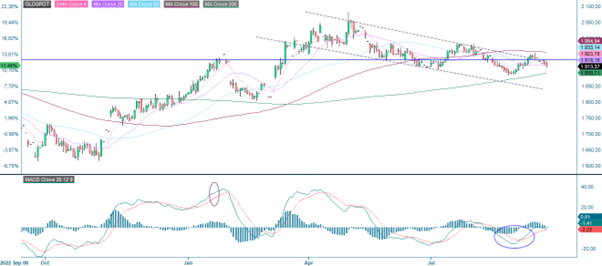
The gold price is approaching MA200 after a failed attempt to break up above the ceiling of a falling trend channel. Meanwhile, the EUR/USD may have bottomed out for now. A weakened USD may fuel yet another upward move in gold.
Gold (in USD per troy ounce), one-year daily chart
Gold (in USD per troy ounce), weekly five-year chart

The full name for abbreviations used in the previous text:
EMA 9: 9-day exponential moving average
Fibonacci: There are several Fibonacci lines used in technical analysis. Fibonacci numbers are a sequence in which each successive number is the sum of the two previous numbers.
MA20: 20-day moving average
MA50: 50-day moving average
MA100: 100-day moving average
MA200: 200-day moving average
MACD: Moving average convergence divergence
Risks
External author:
This information is in the sole responsibility of the guest author and does not necessarily represent the opinion of Bank Vontobel Europe AG or any other company of the Vontobel Group. The further development of the index or a company as well as its share price depends on a large number of company-, group- and sector-specific as well as economic factors. When forming his investment decision, each investor must take into account the risk of price losses. Please note that investing in these products will not generate ongoing income.
The products are not capital protected, in the worst case a total loss of the invested capital is possible. In the event of insolvency of the issuer and the guarantor, the investor bears the risk of a total loss of his investment. In any case, investors should note that past performance and / or analysts' opinions are no adequate indicator of future performance. The performance of the underlyings depends on a variety of economic, entrepreneurial and political factors that should be taken into account in the formation of a market expectation.
Disclaimer:
This information is neither an investment advice nor an investment or investment strategy recommendation, but advertisement. The complete information on the products (securities) mentioned herein, in particular the structure and risks associated with an investment, are described in the base prospectus, together with any supplements, as well as the final terms relating to the securities. The base prospectus and final terms constitute the solely binding sales documents for the products mentioned herein. It is recommended that potential investors read these documents before making any investment decision. The documents and the key information document are published on the website of the issuer, Vontobel Financial Products GmbH, Bockenheimer Landstrasse 24, 60323 Frankfurt am Main, Germany, on https://prospectus.vontobel.com and are available from the issuer free of charge. The approval of the prospectus should not be understood as an endorsement of the securities. The securities are products that are not simple and may be difficult to understand. This information includes or relates to figures of past performance. Past performance is not a reliable indicator of future performance. This information may only be distributed or published in countries where such distribution or publication is permitted by applicable law. As stated in the relevant base prospectus, the distribution of the securities mentioned in this information is subject to restrictions in certain jurisdictions. This advertisement may not be reproduced or redistributed without prior permission by Vontobel.
© Bank Vontobel Europe AG and / or affiliated companies. All rights reserved.