S&P500 on the verge of a breakout in weak September

The S&P500 appears to be in an uptrend. However, September is seasonally the weakest month of the year. For those concerned about downside risk, the US volatility index VIX is trading at an attractive level of 14.4, representing a daily move of around 0.9%. The OMX and the DAX are about to diverge, with the OMX potentially rising and the DAX lagging.
Case of the week: Can S&P500 overcome weak seasonality?
US equity markets have rebounded following the retracement at the beginning of August 2023. The rise in yields has levelled off on mixed economic signals that, e.g., seem to support the case for the FED abstaining from further rate hikes in 2023. On Friday, 1 September, the jobs report for August was cheered by bulls as the revisions to past data, an increased participation rate and lower wage inflation compensated for a somewhat stronger-than-expected headline increase in non-farm payrolls. More specifically, the AI hype has regained momentum and fueled equity markets following a blow-out earnings report from Nvidia. Energy stocks have also had a strong run from the rise in the oil price in recent weeks.
S&P500 (in USD) and US 10-year yield, one-year daily chart
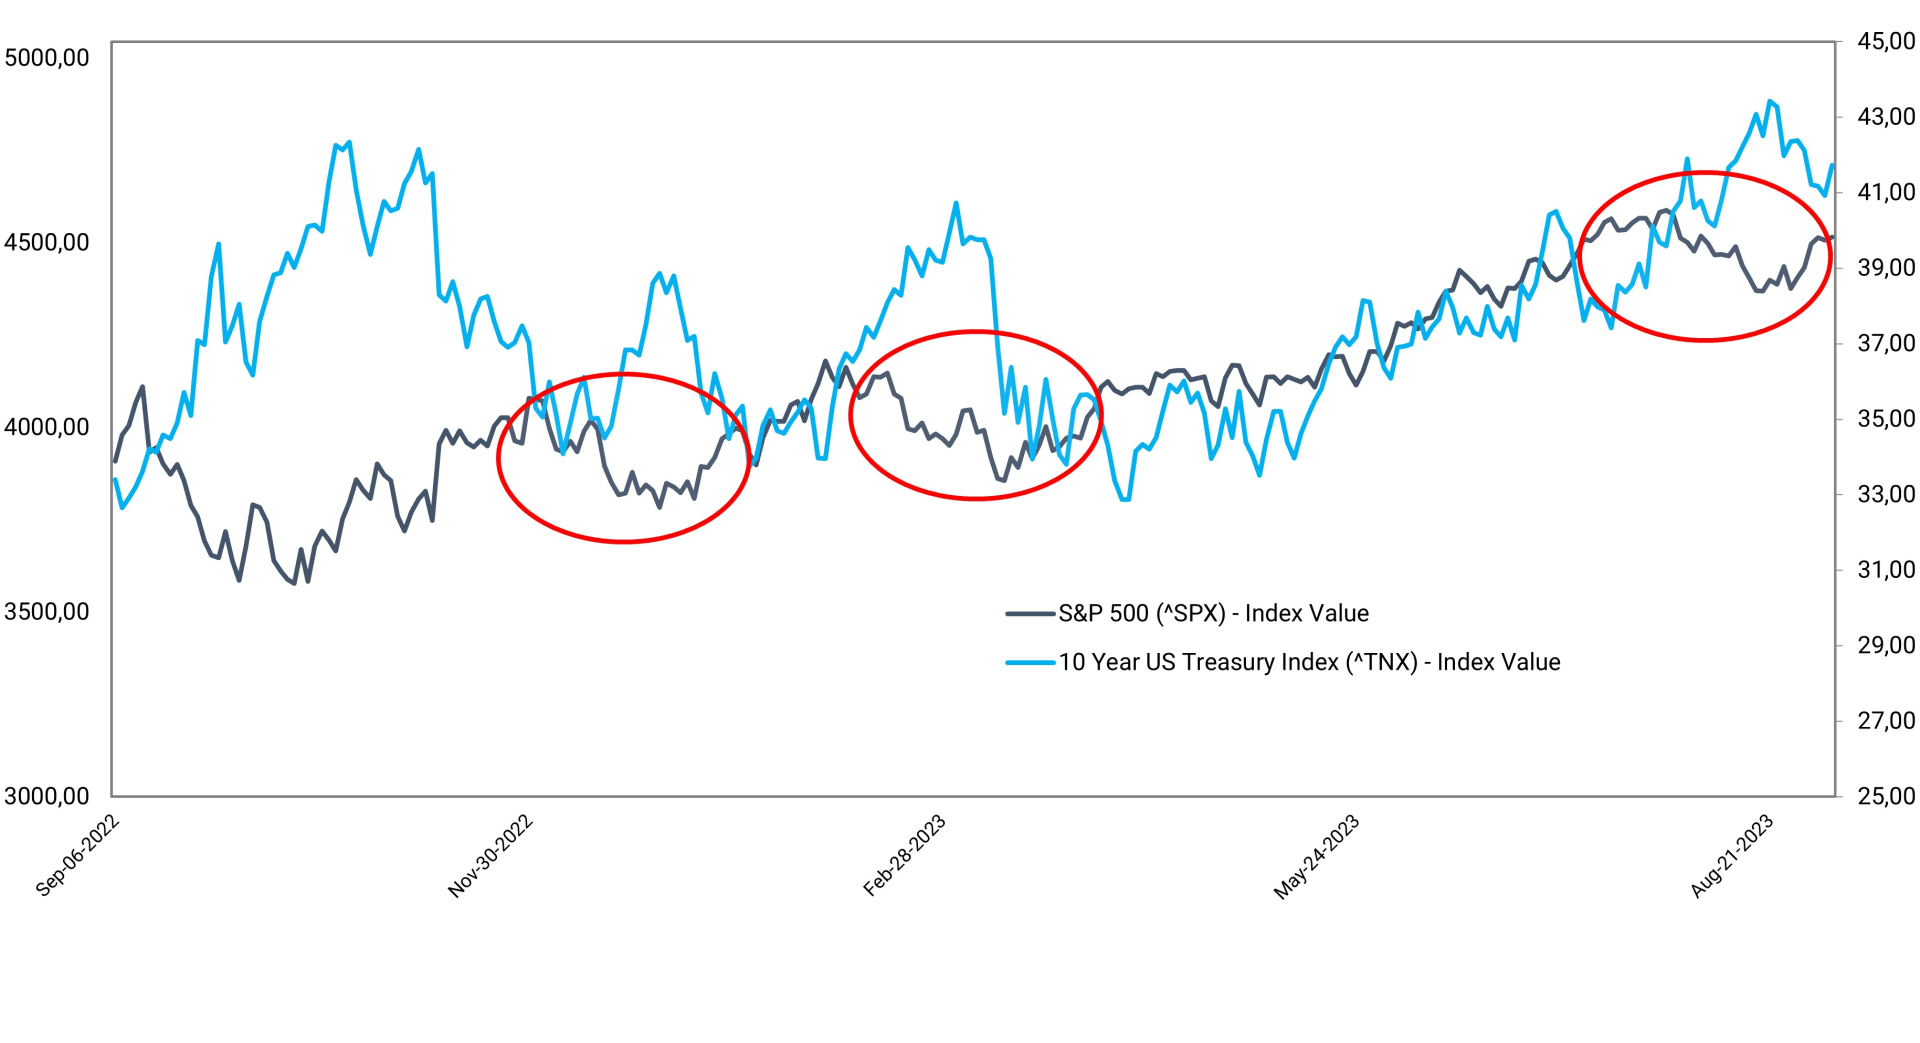
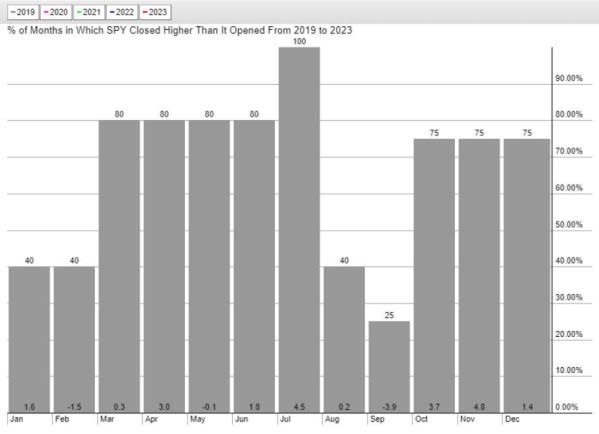
Thus, “buying the dip” was again a successful strategy in August. As the chart above shows, buying the dip has worked well since the S&P 500 bottomed out in October 2022. For the month, the index ended down 1.3 per cent, the weakest month since February. Traders should beware (or relish, depending on how you look at it) that we are in a seasonally volatile period, and September is, on average, the worst month of the year; see below.
Monthly performance for S&P500 (in USD), five-year average
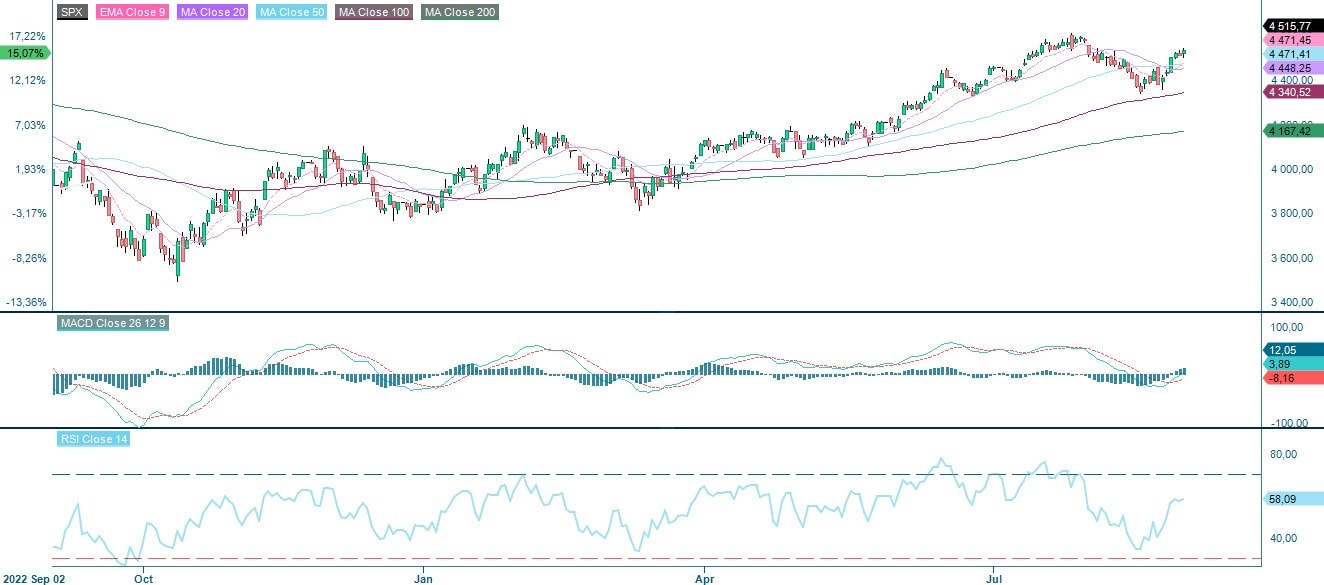
However, in the meantime, the S&P500 looks set to revisit the top from July at ~4,600. Last week, it broke above the MA20 and MA50 levels, and MACD generated a buy signal. Reviewing the bets or adding downside protection might be wise if the index returns to year-high levels. Changes in interest rate levels and the USD could give additional clues.
S&P500 price chart (in USD), one-year daily chart
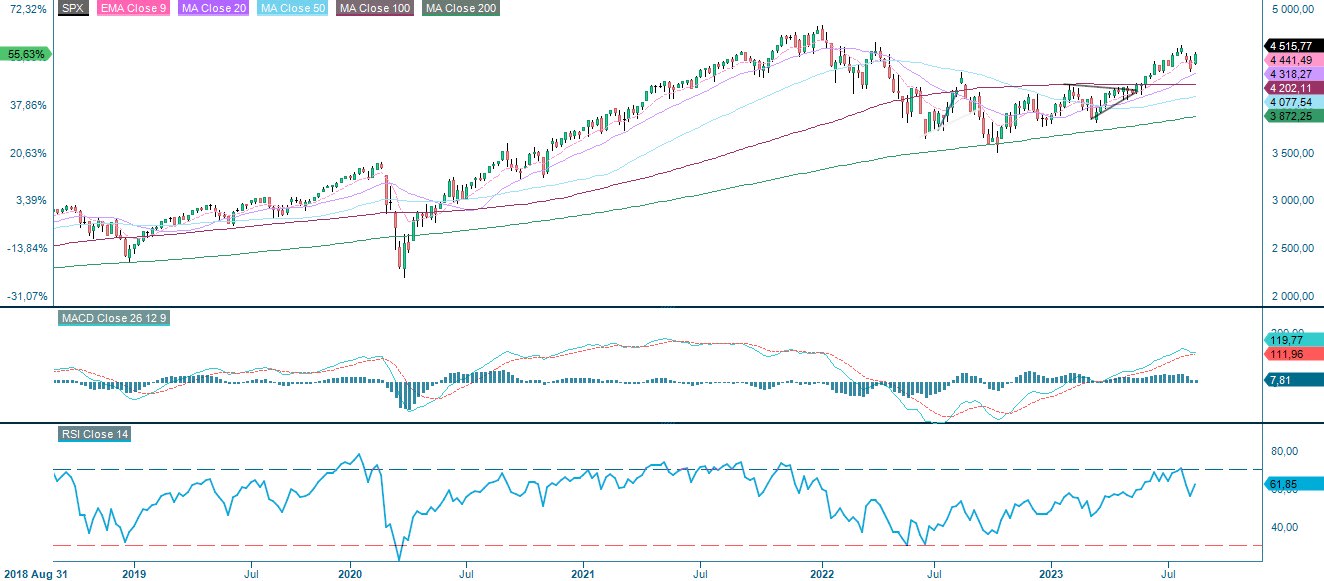
S&P500 price chart (in USD), five-year weekly chart
Macro comments
On Friday, 31st August, the US Non-Farm Payrolls for August were published. The number of new jobs rose to 187 thousand (expected 170 thousand), while the unemployment rate rose to 3.8% (expected 3.5%), and wages rose by 0.2% month-on-month (expected 0.3%).
The Fed's sharp rate hikes over the past 18 months have taken the Fed Funds rate to a level above the general pace of wage growth for the first time since 2008. The next FOMC meeting in the US is on 20 September.
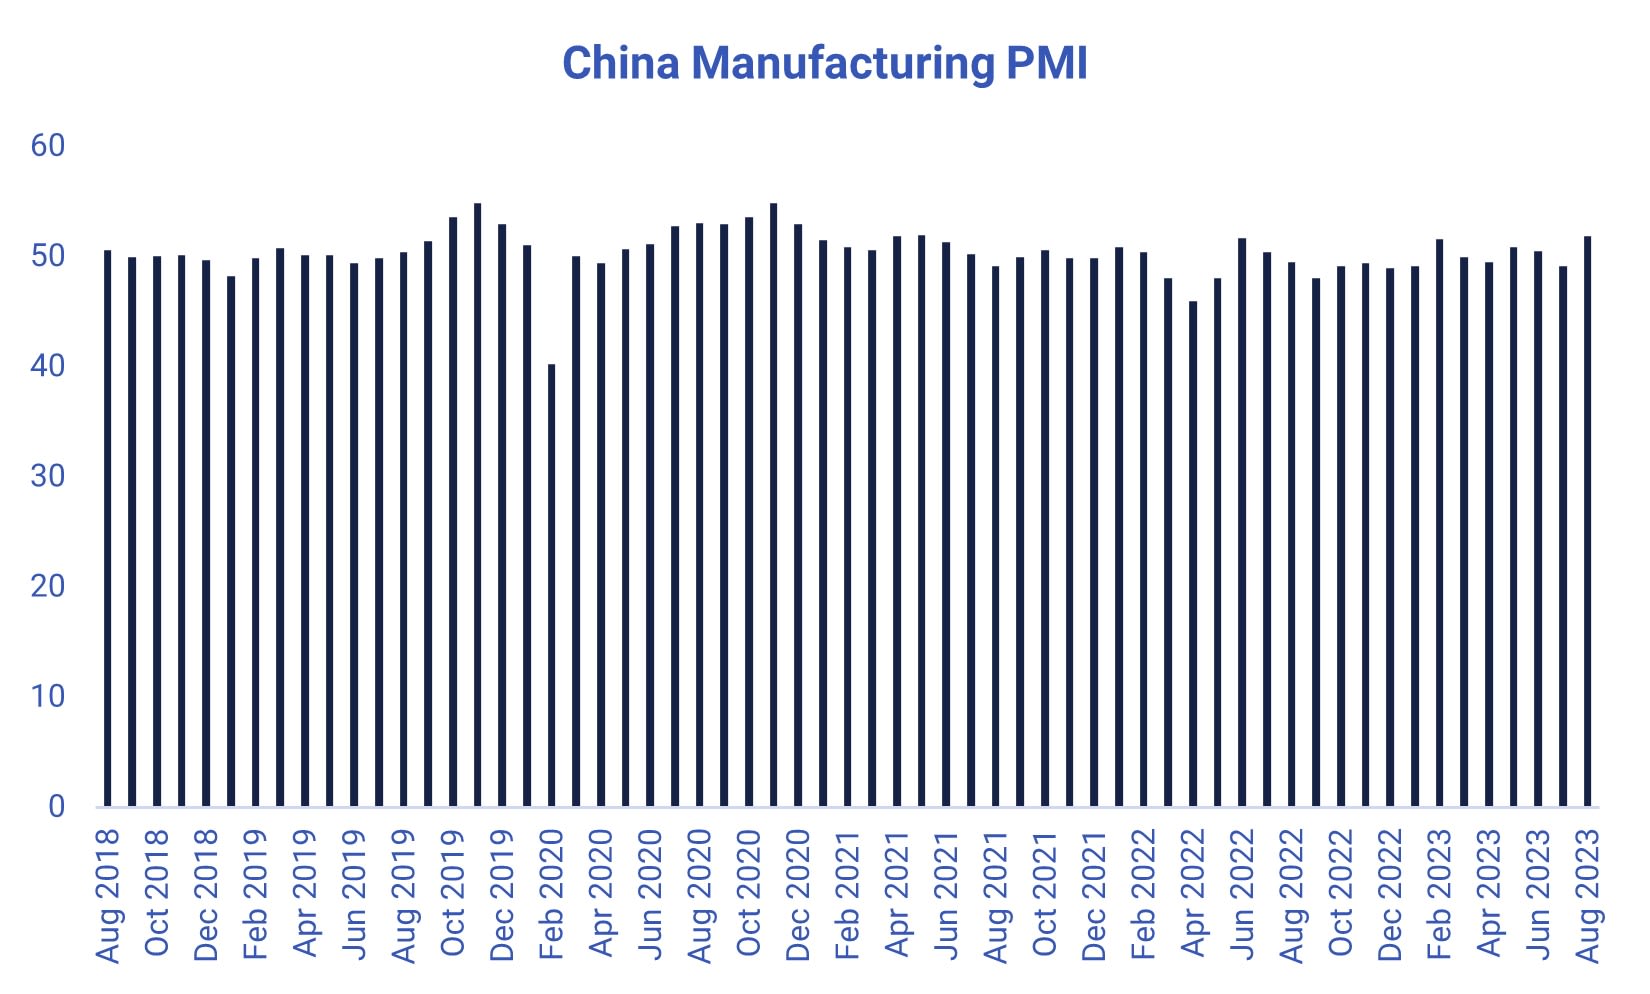
China's Purchasing Managers' Index (PMI) improved markedly in August with a weighted index of 51, the highest reading since the reopening after the Covid in February and better than the anticipated 49.3. The increase was driven by all components, with new orders showing the most significant improvement from July. However, new export orders remain weak (48).
The Chinese authorities recently introduced additional stimulus measures for the housing sector. The minimum down payment requirement for home purchases was lowered to 20 -30% from 30-40%, 40 bps lowered the national mortgage interest rate floor, and the requirements to qualify as a first-time buyer. It reminds us that China is amid a housing crisis weighing rather severely on the economy.
China Manufacturing PMI August 2018 to August 2023
US Volatility Index (VIX) is at attractive levels, while OMXS30 may break on the upside
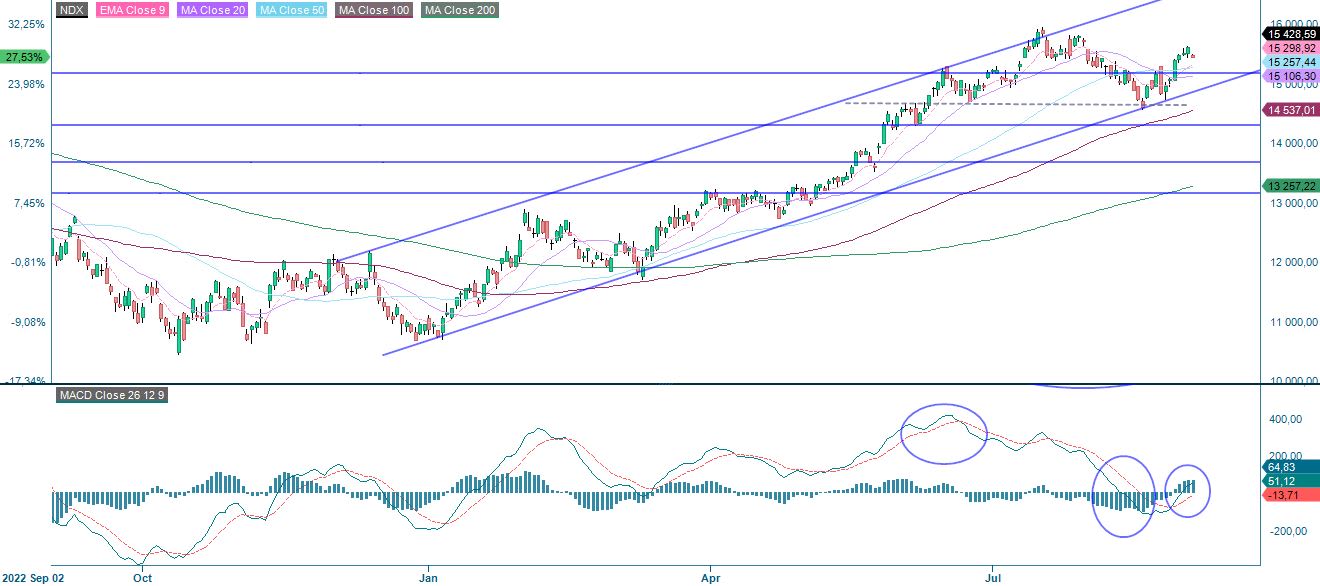
Nasdaq 100 has been performing strongly over the last few days but is currently trading down. EMA9, just below 15,300 and MA20, just above 15,100, must hold for the short-term trend to continue to be considered rising. A break and the floor of the rising trend is the next level on the downside.
Related Products
Nasdaq 100 (in USD), one-year daily chart
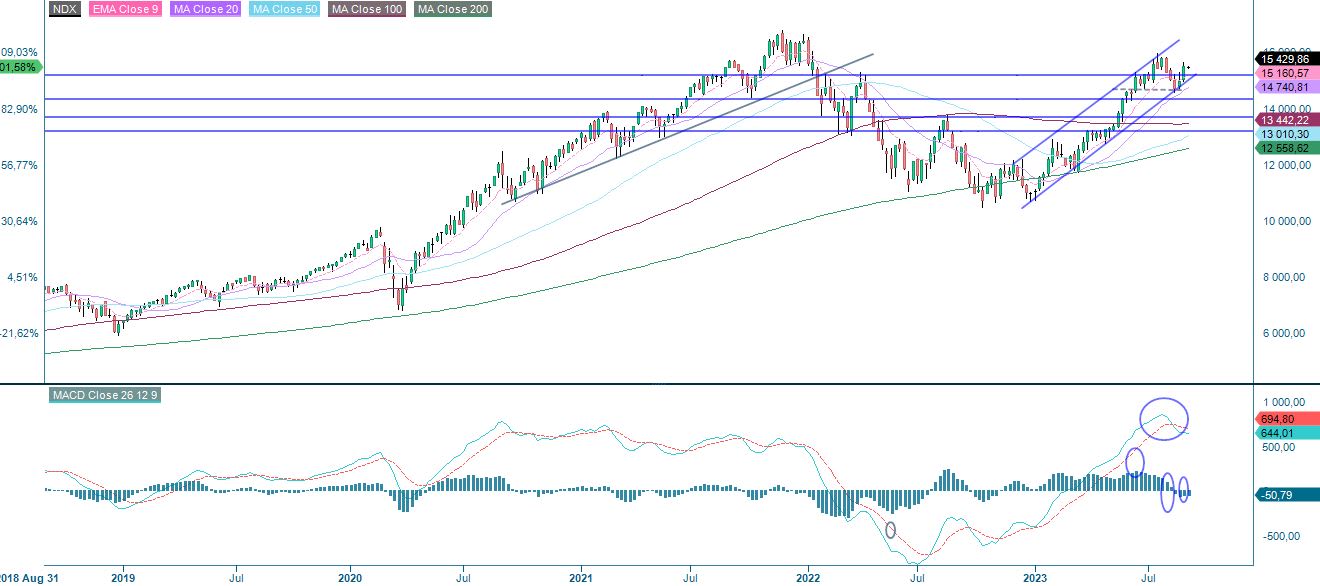
Nasdaq 100 (in USD), weekly five-year chart
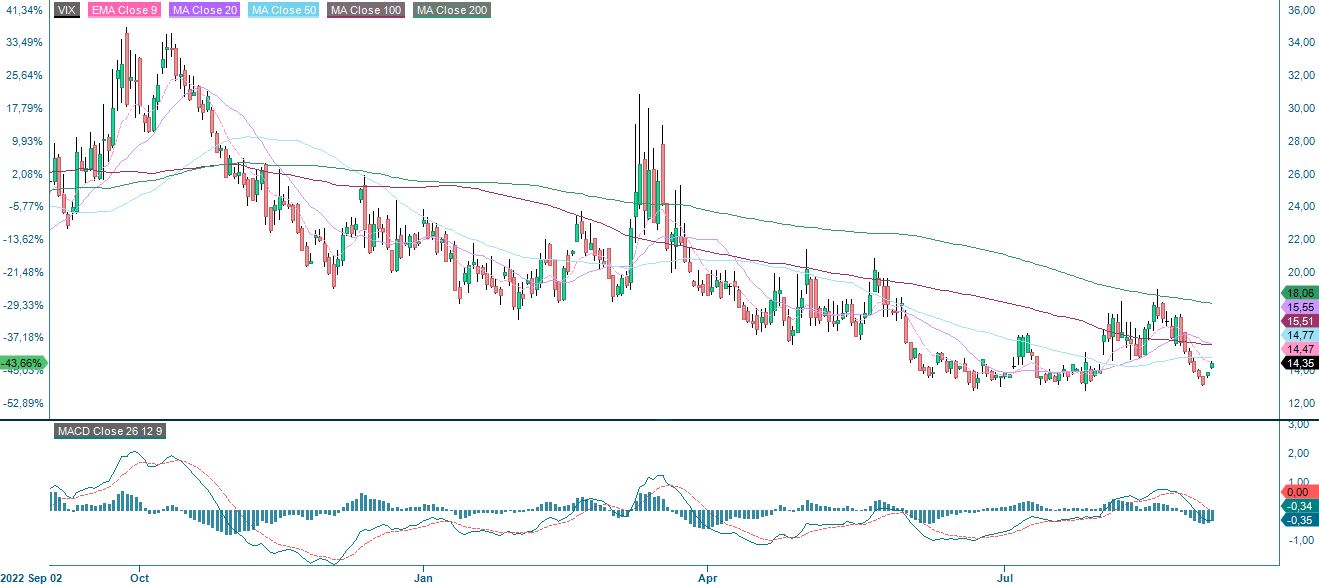
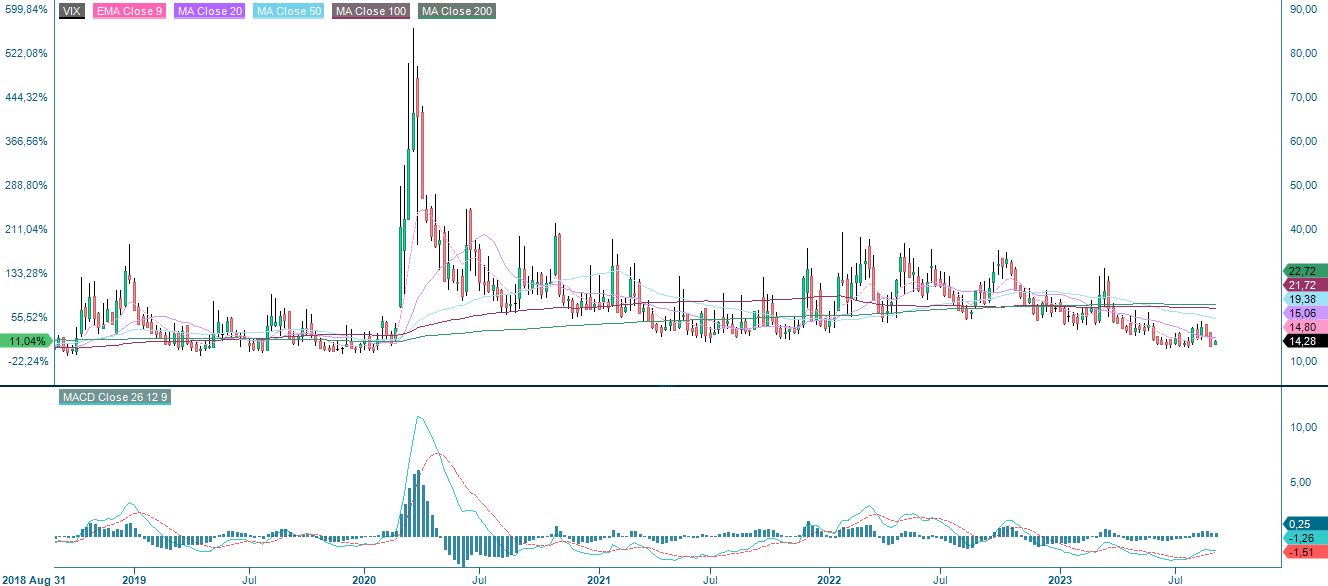
For those worried about the downside risk, VIX trades at attractive levels at 14.4, corresponding to a daily move of about 0.9%.
Related Products
VIX (in USD), one-year daily chart
VIX (In USD), five-year weekly chart
OMXS30 is at an exciting point. As illustrated in the chart below, OMXS30 is trading above the ceiling of the falling trend. However, at these levels, MA200 serves as a second resistance level. A breakup above and MA100 at 2,240 may be subsequent.
OMXS30 (in SEK), one-year daily chart
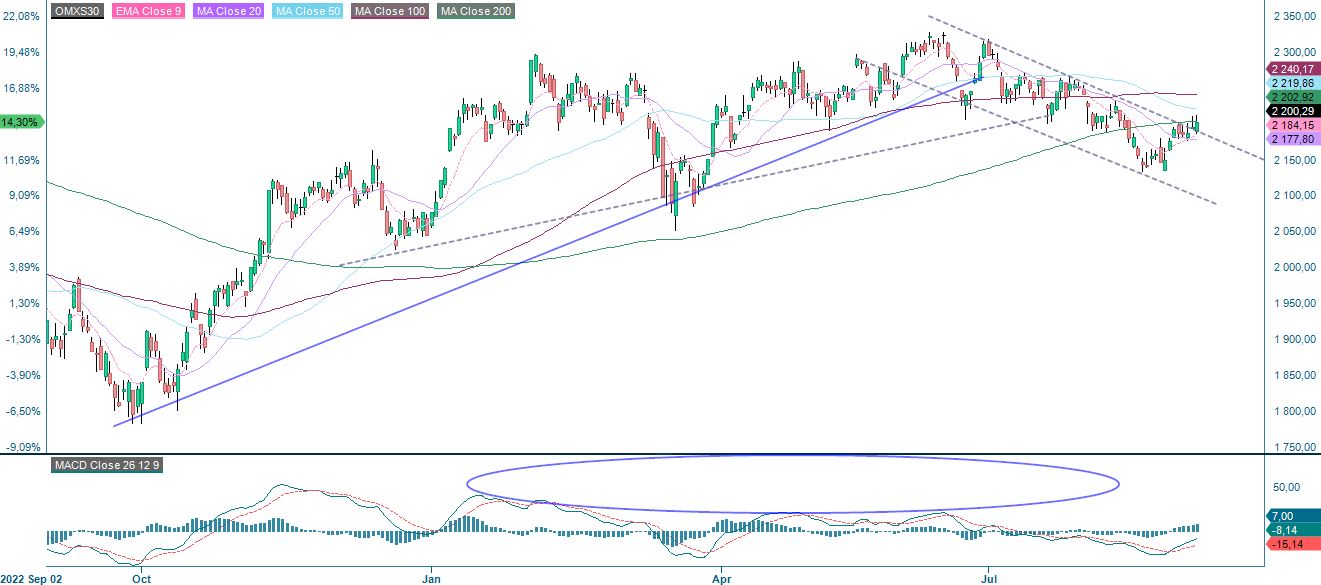
OMXS30 (in SEK), weekly five-year chart

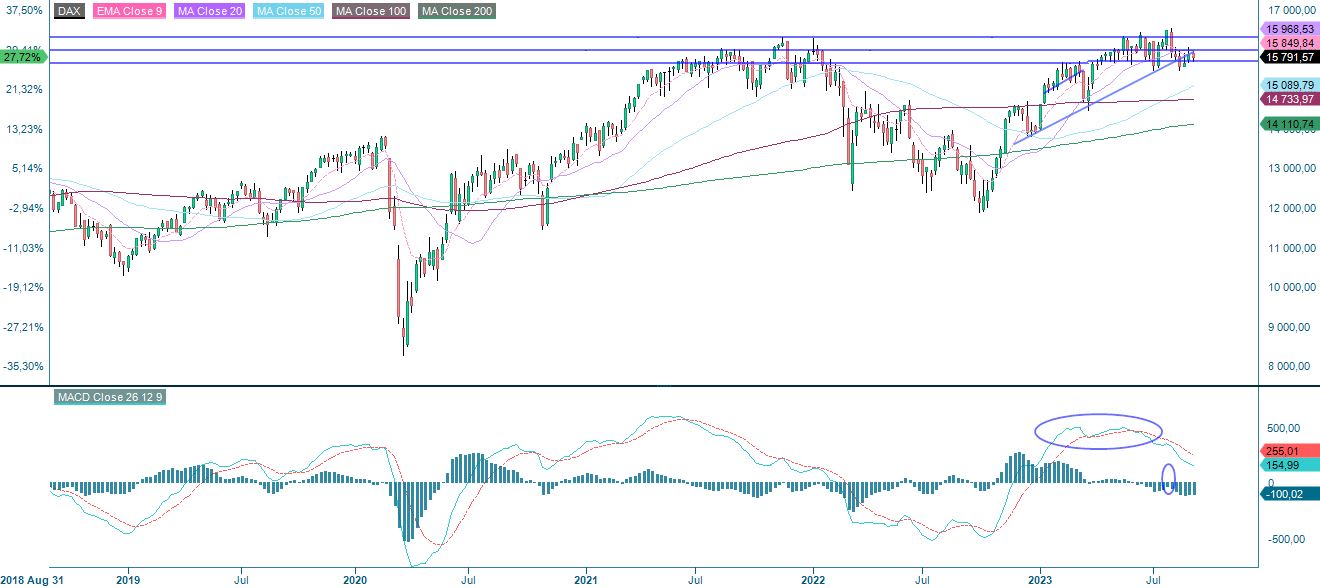
German DAX is lagging. The index is once again testing support around 15,700. A break below MA200, currently at 15,463, could be next.
DAX (in EUR), one-year daily chart
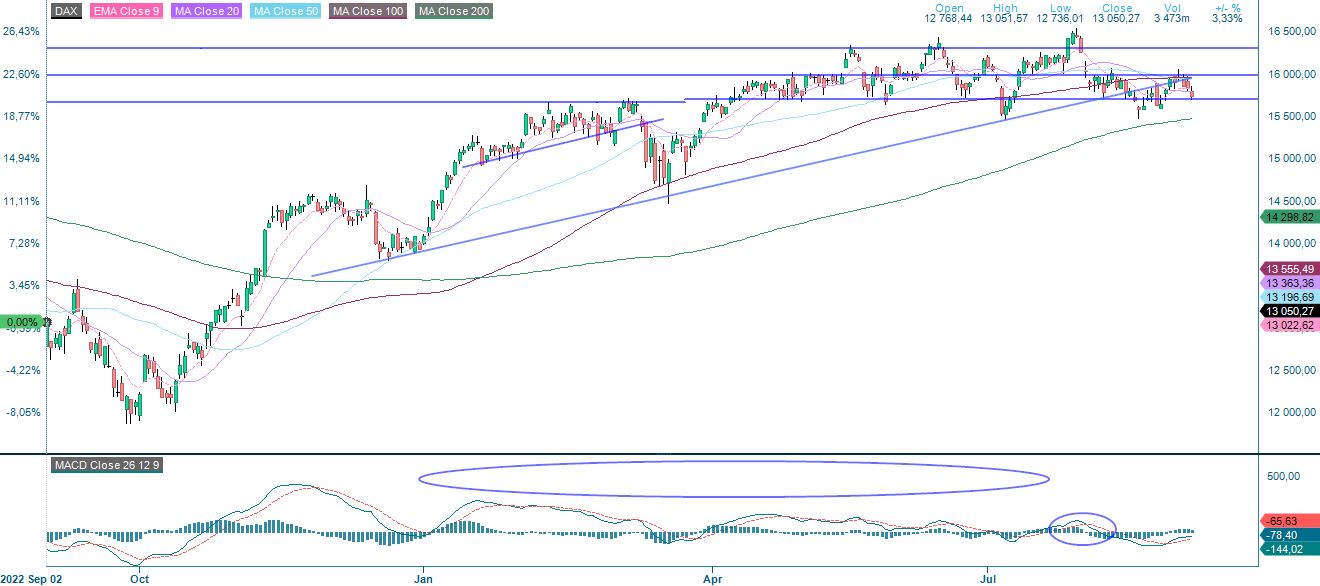
DAX (in EUR), weekly five-year chart
The full name for abbreviations used in the previous text:
EMA 9: 9-day exponential moving average
Fibonacci: There are several Fibonacci lines used in technical analysis. Fibonacci numbers are a sequence in which each successive number is the sum of the two previous numbers.
MA20: 20-day moving average
MA50: 50-day moving average
MA100: 100-day moving average
MA200: 200-day moving average
MACD: Moving average convergence divergence
Risks
External author:
This information is in the sole responsibility of the guest author and does not necessarily represent the opinion of Bank Vontobel Europe AG or any other company of the Vontobel Group. The further development of the index or a company as well as its share price depends on a large number of company-, group- and sector-specific as well as economic factors. When forming his investment decision, each investor must take into account the risk of price losses. Please note that investing in these products will not generate ongoing income.
The products are not capital protected, in the worst case a total loss of the invested capital is possible. In the event of insolvency of the issuer and the guarantor, the investor bears the risk of a total loss of his investment. In any case, investors should note that past performance and / or analysts' opinions are no adequate indicator of future performance. The performance of the underlyings depends on a variety of economic, entrepreneurial and political factors that should be taken into account in the formation of a market expectation.
Disclaimer:
This information is neither an investment advice nor an investment or investment strategy recommendation, but advertisement. The complete information on the products (securities) mentioned herein, in particular the structure and risks associated with an investment, are described in the base prospectus, together with any supplements, as well as the final terms relating to the securities. The base prospectus and final terms constitute the solely binding sales documents for the products mentioned herein. It is recommended that potential investors read these documents before making any investment decision. The documents and the key information document are published on the website of the issuer, Vontobel Financial Products GmbH, Bockenheimer Landstrasse 24, 60323 Frankfurt am Main, Germany, on https://prospectus.vontobel.com and are available from the issuer free of charge. The approval of the prospectus should not be understood as an endorsement of the securities. The securities are products that are not simple and may be difficult to understand. This information includes or relates to figures of past performance. Past performance is not a reliable indicator of future performance. This information may only be distributed or published in countries where such distribution or publication is permitted by applicable law. As stated in the relevant base prospectus, the distribution of the securities mentioned in this information is subject to restrictions in certain jurisdictions. This advertisement may not be reproduced or redistributed without prior permission by Vontobel.
© Bank Vontobel Europe AG and / or affiliated companies. All rights reserved.