Risk of volatile wheat price linked to war in Ukraine

Despite a strong reporting season, the average price reaction for S&P500 companies has been adverse for the first time in many quarters. In addition, inflation and rising interest rates continue to weigh on equity indices, particularly in Europe. This week's case is wheat, whose price has been influenced by the ongoing war between Russia and Ukraine.
Case of the week: Expect further volatility in wheat prices
Ukraine plays a crucial role in supplying staple foods to many regions of the world. As the world's fifth largest exporter of wheat, wheat prices are struggling with the impact of the ongoing Russian invasion of Ukraine, the newly re-imposed Russian blockade of Ukrainian ports, and growing pressure from African countries on Russia to restore the previous export agreement (the Black Sea Grain Initiative) that ensured safe passage for ships to and from Ukrainian ports.
The previous export deal expired on 17 July 2023, with Russia opting not to renew it. The following week, the wheat price jumped to a five-month high, rising from USD 611.8/Bushel (Bu) to USD 775/Bu. An increase of around 27%. Since then, the price has fallen back to about 645 USD/Bu. Vladimir Putin looked to Africa to increase support from other regions and countries and hosted the Russia-Africa Summit on 28 July. However, only 17 countries attended. This was a significantly lower number than the 2019 summit, which saw 43 African countries showing up. Putin hoped that the countries present would show their support for Russia. However, most attendees called for the revival of the Black Sea grain initiative, as the ongoing blockade severely hampered food supplies in large parts of the African continent. In other words, Putin's plan to build support in Africa backfired as he came under even more pressure to reopen Ukrainian ports.
Today, Ukrainian farmers can only ship their grain on the Danube, by road or rail through Europe. This is far more expensive for the farmers, pushing prices even higher. Moreover, the Danube port was attacked by Russian missiles last week. So this route may not be available for shipping for much longer. In addition, weekly reports of Russian attacks on grain stores in several other parts of Ukraine are causing further supply shortages. This is a common tactic Russia uses in response to Western support for Ukraine, a significant factor in wheat prices. Until an export agreement is reached, attacks on grain storage facilities will likely continue.
According to the Turkish authorities, Vladimir Putin will visit Turkey in August, with a new export deal on the agenda. Turkey was a key player in negotiating the previous agreement. Still, whether a new deal is signed before or after the Istanbul meetings (or at all), we can expect continued volatility in the wheat price. Mounting pressure from African countries and possible stress from Turkey may persuade Vladimir Putin to sign a new export deal.
Wheat price chart (in USD/Bu), one-year daily chart

Wheat price chart (in USD/Bu), three-year weekly chart

US credit downgrade has dampened investor sentiment
Last week's downgrade of Fitch’s United States credit rating from AAA to AA+ has dampened confidence in global stock markets. Fitch's reason is that it expects the US budget deficit to rise from 3.9% of GDP in 2022 to more than 6% of GDP in 2023-2025 due to increased spending and interest costs. The US government will increase the amount of Treasury bonds it issues between August and October 2023, pushing US long-term Treasury yields higher last week.
US interest rates are influenced by the inflation rate, which has been falling, albeit more slowly than expected. On Thursday, 10th August, the US Consumer Price Index (CPI) for July will be released, followed by the US Producer Price Index for July on Friday, 11th August.
Economic data this summer has generally been worse than expected, especially in the eurozone and China. The US has been a positive surprise, not least in the labour and housing markets. Data for June and July suggest that companies worldwide have entered a phase of inventory liquidation, negatively impacting new orders and production in the short term.
While the Nasdaq, S&P 500, and Nikkei have all performed strongly in recent months, Dow Jones and the FTSE has been the best performer of the major indices over the past month, rising by some 4%.
Significant stock indices performance in one week, one month and three months
For Q2 2023 (with 84% of the S&P 500 companies reporting actual results), 79% of S&P companies have reported a positive Earnings-per-Share EPS surprise, while 65% have reported a positive revenue surprise. So far, the average earnings decline for the S&P 500 in Q2 2023 is 5.2%, the most significant earnings decline since Q3 2020. However, the aggregate positive earnings surprise is 7.2% in Q2 2023.
The three best-performing sectors regarding Q2 2023 earnings are Information Technology, Consumer Staples, and Health Care, with 92%, 88% and 88% of their results beating expectations. Energy, Real Estate and Utilities are the least successful, with 71%, 68% and 64% of their Q2 2023 results exceeding market expectations.
On average, S&P 500 stocks with positive earnings surprises have gained 1.0% since Q3 2018. In Q1 2023, this price reaction was positive, 0.4%. In Q2 2023, it deteriorated to minus 0.5%.

The valuation of the S&P 500 has exceeded the ten-year trailing EPS growth curve since 2013. The valuation of the S&P 500, which currently trades at 19.2x, is also higher than its historical ten-year average of 17.4x.

We have also compiled the results of the Q2 2023 reports of 83 OMX Stockholm companies. Overall, there were strong results from OMX companies this quarter, with 64% of Q2 2023 results exceeding analysts’ expectations. Weak earnings guidance for Q3 2023, mainly from industrial companies, contributed to OMX underperforming the global equity index in July.
Among the major US companies, Walt Disney reports its quarterly results today, Wednesday, 9 August.
The short-term trend is negative
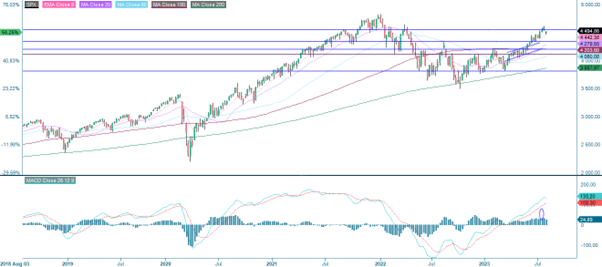
As mentioned above, the valuations are high in the US. Looking at the broad S&P 500, the short-term trend is negative as the index trades below MA20 in the daily chart below. Momentum is positive but falling as MACD recently generated a soft sell signal. MA50, currently at 4,430, is the first level of support on the downside.
S&P 500 (in USD), one-year daily chart

Note that EMA9, currently at 4,440, is still intact and rising in the weekly chart below. Perhaps levels between 4,430 and 4,440 are a good opportunity to position for a short bounce back up, keeping stop-losses tight.
S&P 500 (in USD), weekly five-year chart
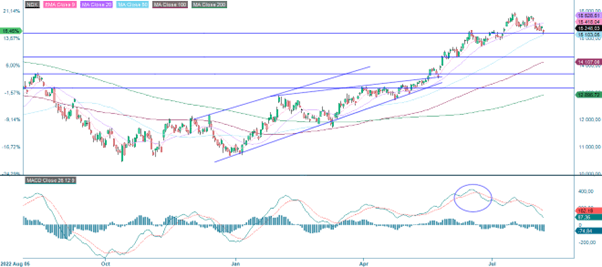
Momentum has been fading for quite some time in the Nasdaq 100. A negative divergence has been created between the index and MACD. MA50, currently at 15,103, serves as support. In case of a break to the downside, the next level of support is around 14,700.
Nasdaq 100 (in USD), one-year daily chart
Related Products
Nasdaq 100 (in USD), weekly five-year chart
OMXS30 is trading close to support made up of MA200. In case of a break to the downside, the next level can be found at around 2,100. If the index breaks below MA200, a short position could look attractive from a risk/reward perspective.
OMXS30 (in SEK), one-year daily chart

OMXS30 (in SEK), weekly five-year chart

The German DAX closed below MA200, but a support line is around 15,675. In case of a break to the downside, the next level is around 15.420. Note that MACD has generated a sell signal.
DAX (in EUR), one-year daily chart

DAX (in EUR), weekly five-year chart

Time to take profits in oil
Brent oil has performed strong but is currently at levels where it has bounced back down from several times this year. Maybe history will repeat itself, and it is time to take profits.
Brent oil (in USD), one-year daily chart

Related Products
Brent oil (in USD), weekly five-year chart

Risks
External author:
This information is in the sole responsibility of the guest author and does not necessarily represent the opinion of Bank Vontobel Europe AG or any other company of the Vontobel Group. The further development of the index or a company as well as its share price depends on a large number of company-, group- and sector-specific as well as economic factors. When forming his investment decision, each investor must take into account the risk of price losses. Please note that investing in these products will not generate ongoing income.
The products are not capital protected, in the worst case a total loss of the invested capital is possible. In the event of insolvency of the issuer and the guarantor, the investor bears the risk of a total loss of his investment. In any case, investors should note that past performance and / or analysts' opinions are no adequate indicator of future performance. The performance of the underlyings depends on a variety of economic, entrepreneurial and political factors that should be taken into account in the formation of a market expectation.
Disclaimer:
This information is neither an investment advice nor an investment or investment strategy recommendation, but advertisement. The complete information on the products (securities) mentioned herein, in particular the structure and risks associated with an investment, are described in the base prospectus, together with any supplements, as well as the final terms relating to the securities. The base prospectus and final terms constitute the solely binding sales documents for the products mentioned herein. It is recommended that potential investors read these documents before making any investment decision. The documents and the key information document are published on the website of the issuer, Vontobel Financial Products GmbH, Bockenheimer Landstrasse 24, 60323 Frankfurt am Main, Germany, on https://prospectus.vontobel.com and are available from the issuer free of charge. The approval of the prospectus should not be understood as an endorsement of the securities. The securities are products that are not simple and may be difficult to understand. This information includes or relates to figures of past performance. Past performance is not a reliable indicator of future performance. This information may only be distributed or published in countries where such distribution or publication is permitted by applicable law. As stated in the relevant base prospectus, the distribution of the securities mentioned in this information is subject to restrictions in certain jurisdictions. This advertisement may not be reproduced or redistributed without prior permission by Vontobel.
© Bank Vontobel Europe AG and / or affiliated companies. All rights reserved.