Strong quarterly results from Alphabet and Microsoft

It has been a reasonably strong reporting season in the US but a weaker one in Sweden. The market may get some support from last night's robust earnings reports from Alphabet and Microsoft. This week we are looking at the US Volatility Index VIX (which can be a good hedge against a fall in the stock markets) and AMD, where we believe the risk is to the downside ahead of next week's Q1 2023 report.
Strong PMI figures but a mixed picture of the industry
Better-than-anticipated US Purchasing Managers' Indices (PMIs) for April pushed US interest rates higher on Friday, 21 April. The 2-year US Treasury yield rose almost 10 points, while the 10-year US Treasury yield rose slightly less. However, on Tuesday, 25 April, the US 2-year Treasury yield fell by 11 basis points.
Fed members have entered a quiet period before the next 2 and 3 May meetings from which the market expects a 25bp policy rate hike. Later this year, the market expects interest rate cuts. On Friday, 28th April, we will get the last piece of US inflation data before the Fed meeting, the Personal Consumer Expenditure (PCE) index.
The recovery trend in the US junk bond ETF HYG has petered out. Historically, there has been a strong correlation between the performance of the HYG and the S&P 500.
HYG ETF (US high yield bonds), two-year daily chart, in USD

The Purchasing Managers' Index (PMI) for Friday, 21st April, was better than expected in Europe and the US for the service sectors and composite and in the US also for the manufacturing sector. However, the manufacturing PMI in Europe was weaker than anticipated.

In contrast, Sandvik, reporting its Q1 2023 on Friday, 21 April, sees upward trends in most segments and regions, except for infrastructure in general and engineering and automotive in Asia.

A week to watch as US big tech is set to dominate
For Q1 2023 (with around 90 companies reporting as of Friday, 21 April), 76% of S&P 500 companies have reported a positive EPS surprise, while 63% have reported a positive revenue surprise.
Five sectors (Commercial Services, Consumer Staples, Energy, Health Care and Materials) have 100% of companies reporting better than expected Q1 2023 earnings. The three worst-performing sectors are Information Technology, Financials and Real Estate, with 75, 53 and 50% positive earnings surprises for Q1 2023.
As of 31 March 2023, analysts were forecasting a -6.7% decline in earnings for Q1 2023. This expected earnings decline has decreased to -6.2% as of 21 April 2023.
This week, 60 S&P 500 companies will report their Q1 2023 results, and the big US tech companies will set the tone. US companies reporting include Alphabet and Microsoft on Tuesday, 25 April; Meta Platforms on Wednesday, 26 April; Amazon, Intel, Caterpillar, Merck, Amgen and Eli Lilly on Thursday, 27 April and Exxon Mobil and Chevron on Friday, 28 April.
After yesterday’s closing in the US, Microsoft reported sales and earnings above expectations. The share is currently up 4.6 per cent in the after-hour trading: Google, or Alphabet, beat expectations on both sales and earnings. The share is currently up 4.3 per cent in the after-hours trading.
Risk on the downside from a technical perspective. Is VIX interesting at these levels?
The broad S&P 500 closed yesterday’s trading down below MA20. At the same time, MACD has generated a soft sell signal, which has been a good indicator during the past 12 months. From a technical point of view, MA200, currently at 3,956, may be next. However, Friday’s inflation data can change the negative outlook - especially the markets’ belief in future potential rate hikes. Also, note that the S&P 500 future is pointing up by 0.4% after yesterday's report from Microsoft and Alphabet. Meta Platforms report today after closing.
S&P 500 (in USD), one-year daily chart

S&P 500 (in USD), weekly five-year chart

Nasdaq is more attractive from a technical perspective. Despite rate setbacks, Nasdaq closed near its low and well below MA20. Also, note the clear negative divergence between the index and MACD. The next level on the downside is found around 12,585. Again, Friday’s inflation figure may quickly change the picture. Strong tech figures, such as from Microsoft and Alphabet, and lower interest may also boost the index and stocks.
Nasdaq 100 (in USD), one-year daily chart

Nasdaq 100 (in USD), weekly five-year chart

The interim reporting season in Sweden has been weaker than in the US. With 18 larger OMX companies having reported their Q1 2023 numbers, only 53% have been better than anticipated in earnings. OMXS30 consolidates in a neutral wedge formation, while MACD is close to generating a soft sell signal. The formation indicates a potential downside close to 18 per cent. Also note the negative divergence between the index and MACD: However, before this potential downside becomes relevant, the neutral wedge formation must be broken.
OMXS30 (in SEK), one-year daily chart

OMXS30 (in SEK), weekly five-year chart

Momentum is fading even for the German DAX, as visualised by the falling MACD histogram, as MACD is close to generating a soft sell signal.
DAX (in EUR), one-year daily chart

DAX (in EUR), weekly five-year chart

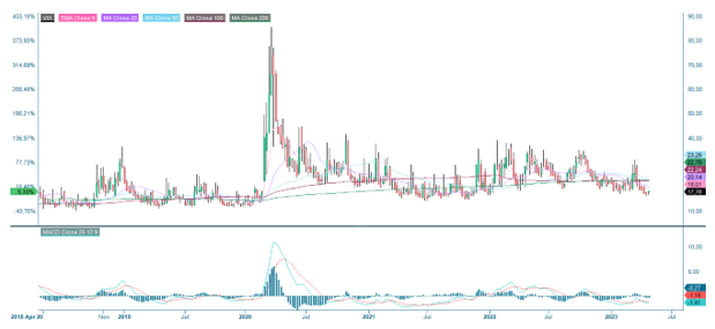
VIX is trading at low levels despite bearish technical, reporting season and many points of uncertainty. Is VIX an excellent hedge at these levels?
VIX (in USD), one-year daily chart

Related Products
VIX (in USD), weekly five-year chart
Rally in Bitcoin. Does the crypto have more to give?
Year-to-date, bitcoin has outperformed equities. It is trading above its moving averages, but momentum seems to be fading. MACD illustrates that. There may be an opportunity to buy into the dips. Are levels around 28,500 exciting levels to enter a long trade with a target price just above 35,000?
Bitcoin (in USD), two-year daily chart

Bitcoin (in USD), weekly five-year chart

Case of the week: Advanced Micro Devices
Next Tuesday, 2 May, Advanced Micro Devices, Inc (AMD) will report its first-quarter results. AMD's share price is up around 30% year-to-date, setting the stage for a drop if the report disappoints investors. The last four quarterly reports have been below average for AMD regarding reported EPS compared to estimates, while revenues have been above expectations, except for Q3 2022.
Looking at analyst estimates for Q1 2023; the consensus is for revenues of approximately $5.31 billion. In the Q4 2022 earnings call, AMD management guided Q1 2023 revenues to be $5.0 - $5.6 billion, which is lower than Q1 2022 revenues, totalling approximately $5.9 billion. Management also stated that overall demand is expected to be stronger in the second half of 2023 compared to the first half, so a decline in revenues compared to Q1 2022 should be familiar to the market. However, given the strong rally in the share price so far in 2023, there is a risk of a decline if revenues come in at the lower end of the guidance range of USD 5.0-5.6 billion.
On a more positive note, following the Q4 earnings report, which missed consensus estimates, AMD's shares jumped around 20% in just two trading days as CEO Lisa Su provided upbeat guidance. Therefore, a negative earnings surprise does not necessarily mean the share price will fall as the market seems to look beyond the immediate results. However, it should be noted that the stock had not experienced a 3-month rally before the Q4 2022 report, which is a significant difference compared to today's situation. Therefore, a disappointing Q1 2023 earnings report could send AMD shares to lower levels, even though the long-term macroeconomic outlook is strong.
AMD (in USD), one-year daily share price chart

AMD (in USD), five-year weekly share price chart

The full name for abbreviations used in the previous text:
EMA 9: 9-day exponential moving average
Fibonacci: There are several Fibonacci lines used in technical analysis. Fibonacci numbers are a sequence of numbers in which each successive number is the sum of the two previous numbers.
MA20: 20-day moving average
MA50: 50-day moving average
MA100: 100-day moving average
MA200: 200-day moving average
MACD: Moving average convergence divergence
Risks
External author:
This information is in the sole responsibility of the guest author and does not necessarily represent the opinion of Bank Vontobel Europe AG or any other company of the Vontobel Group. The further development of the index or a company as well as its share price depends on a large number of company-, group- and sector-specific as well as economic factors. When forming his investment decision, each investor must take into account the risk of price losses. Please note that investing in these products will not generate ongoing income.
The products are not capital protected, in the worst case a total loss of the invested capital is possible. In the event of insolvency of the issuer and the guarantor, the investor bears the risk of a total loss of his investment. In any case, investors should note that past performance and / or analysts' opinions are no adequate indicator of future performance. The performance of the underlyings depends on a variety of economic, entrepreneurial and political factors that should be taken into account in the formation of a market expectation.
Disclaimer:
This information is neither an investment advice nor an investment or investment strategy recommendation, but advertisement. The complete information on the products (securities) mentioned herein, in particular the structure and risks associated with an investment, are described in the base prospectus, together with any supplements, as well as the final terms relating to the securities. The base prospectus and final terms constitute the solely binding sales documents for the products mentioned herein. It is recommended that potential investors read these documents before making any investment decision. The documents and the key information document are published on the website of the issuer, Vontobel Financial Products GmbH, Bockenheimer Landstrasse 24, 60323 Frankfurt am Main, Germany, on https://prospectus.vontobel.com and are available from the issuer free of charge. The approval of the prospectus should not be understood as an endorsement of the securities. The securities are products that are not simple and may be difficult to understand. This information includes or relates to figures of past performance. Past performance is not a reliable indicator of future performance. This information may only be distributed or published in countries where such distribution or publication is permitted by applicable law. As stated in the relevant base prospectus, the distribution of the securities mentioned in this information is subject to restrictions in certain jurisdictions. This advertisement may not be reproduced or redistributed without prior permission by Vontobel.
© Bank Vontobel Europe AG and / or affiliated companies. All rights reserved.