Strong US corporate profits have been discounted

A US aircraft carrier strike group has gathered near the Persian Gulf. The question is whether President Trump will launch a military attack on Iran or simply threaten to do so. If the US were to launch a military strike on Iran, both the VIX Index and the price of Brent crude oil could be affected. Although S&P 500 companies experience increased profit growth in Q4 2025, the S&P 500 and other major US stock indexes have underperformed European and Asian indexes thus far in 2026.
Case of the week: What if the US were to attack Iran?
On 28 December 2025, massive protests broke out in Iran, directed against the Islamic regime that has governed the country since 1979. As with many revolutions before it, this one was sparked by hunger. Food prices had been rising for a long time, coupled with a decline in the value of the Iranian currency, the rial. The riots quickly developed into a widespread popular movement calling for the overthrow of the Islamic Republic. In response, the Iranian Revolutionary Guard opened fire on the crowds, killing several thousand people. The Iranian regime also attempted to prevent information from spreading by shutting down the internet.
US President Trump posted a message on social media assuring the protesters that support was on the way. The US currently has a naval force positioned near the Persian Gulf under the command of the aircraft carrier USS Abraham Lincoln, and it maintains military bases in Bahrain and Qatar. These bases, located across the Persian Gulf from Iran, could be vulnerable to Iranian counterattacks. Alternatively, Iran could try to sink US warships or lay mines in the Persian Gulf, thereby blocking vital trade routes. About a quarter of the world's oil is transported through the Strait of Hormuz.
There are various possible consequences of a US military attack. The most likely outcome is the collapse of the regime and its replacement by military rule. The least likely outcome is a transition to a democratically elected new government. Another possibility is that the Iranian clerical regime survives but is forced to moderate its policies towards the US and Israel. A potential military attack on Iran would also serve US military objectives, primarily preventing the country from developing its own nuclear arsenal and eliminating its ballistic missiles. On 22 June 2025, the US Air Force and Navy launched an attack on three nuclear facilities in Iran. Called Operation Midnight Hammer, this attack was part of the war between Israel and Iran.
Recently, an Iranian government plane landed in Moscow. There was no explanation as to who was on board or the purpose of the trip. The passengers could have been anything from government officials seeking military support from Russia to officials fleeing Iran ahead of an alleged US military attack. Following the capture of Venezuelan President Maduro by the US on 3 January, some within the Iranian regime may be concerned. Meanwhile, President Trump may recall President Carter's unsuccessful attempt to rescue the hostages held at the US embassy in Tehran between November 1979 and January 1981.
Iran is the world's seventeenth-largest country by both population (approximately 93 million) and area (around 1.65 million square kilometres). The most significant factor affecting the world's stock markets is probably that Iran is the world's eighth-largest oil producer and has the potential to block the important Persian Gulf. As the chart below shows, the price of Brent crude oil has fallen from between 120-130 USD per barrel in 2022 to around 60 USD per barrel today. A US military strike on Iran would likely cause the price of Brent crude oil to rise.
Brent Oil (in USD per Barrel), five-year weekly chart

President Trump likely to be deterred from undertaking a similarly extensive operation against Iran due to previous US military operations in Libya and Iraq. This is partly because both countries descended into civil war and chaos, but primarily because the US lost many soldiers while fighting various guerrilla forces, including al-Qaeda and the Islamic State group.
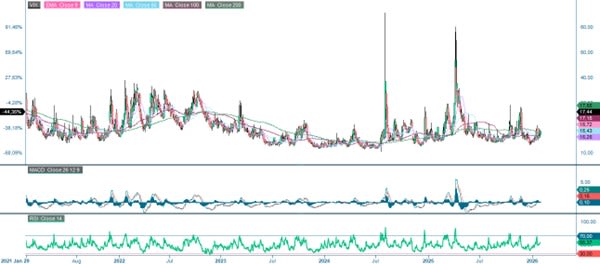
Nevertheless, there is a possibility that military action against Iran could be taken within the next few weeks. This could cause the Brent oil price and the VIX to rise, as both are currently at historically low levels.
Related Products
Related Products
VIX, five-year weekly chart
Macro comments
As of 30 January 2026, 33% of S&P 500 companies had reported their Q4 2025 results. According to Earnings Insight, 75% of these companies reported positive earnings per share (EPS), with 65% experiencing a positive revenue surprise. Earning growth in Q4 2025 increased from 8% a week ago to nearly 12%. Information Technology and Industrials were the two sectors with the highest earnings growth in Q4 of 2025,were, at 30% and 25% respectively. Three out of the eleven S&P 500 sectors reported negative earnings growth in Q4 of 2025: Consumer Discretionary (-1.4%), Energy (-1.8%), and Health Care (-2.4%).
By Friday, 30 January 2026, 43 of the Swedish OMX companies for which there were consensus figures had published their Q4 2025 earnings. 56% of these results were better than expected, while revenues exceeded analysts' estimates in 44% of cases. Of the six companies that reported order intake for which there were consensus expectations, four (67%) exceeded them.
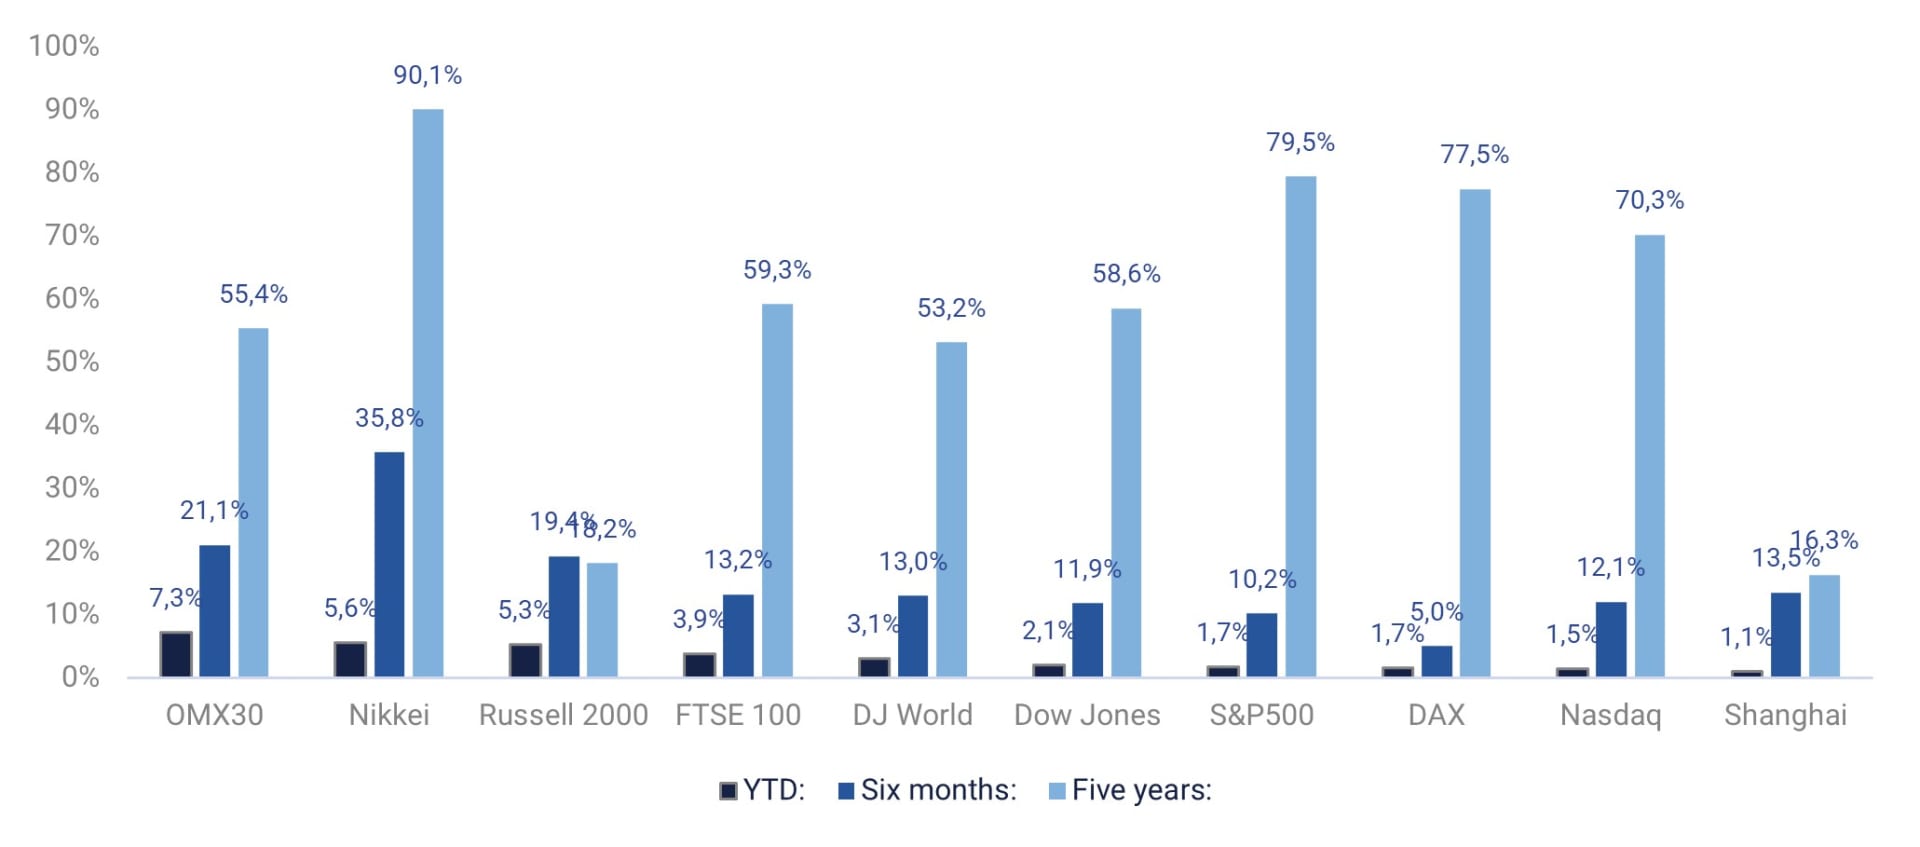
The OMX30 index has performed relatively strongly so far in 2026. As shown in the graph below, which compares it with several other major stock indices in the US, Europe, and Asia, this has been the case. With the exception of the Russell 2000 Index, which comprises US small companies with domestic exposure to the US economy, US stock market indices have underperformed this year. Note that the price changes are expressed in local currencies and do not account for the weakening of the USD.
Year-to-date (YTD), six-months and five-year performance (in %) of world equity indices, ranked by year-to-date performance.
On Wednesday, February 4, the Swedish companies Husqvarna, Handelsbanken, Loomis, Peab, and Securitas, Finnish Stora Enso, UPM and Wärtsilä, Norwegian DNB, Danish Carlsberg, Novo Nordisk, Swiss UBS, and Novartis will report their quarterly results. In the US, quarterly results are expected from Alphabet, AbbVie, Boston Scientific, Eli Lilly, Glaxosmithkline, Qualcomm, and Timken. Turning to the macro news flow, the January services purchasing managers' index from Japan, China, Sweden, Spain, Italy, France, Germany, the Eurozone, the UK and the US will dominate Wednesday's agenda. Otherwise, the December Producer Price Index for the Eurozone will be published, as will the January Consumer Price Indices for the Eurozone and Italy. The US will also contribute ADP (Automatic Data Processing) private employment data for January and weekly oil inventory statistics from the Department of Energy.
On Thursday, 5 February, interim reports from several companies listed on the Stockholm and Copenhagen Stock Exchanges will be published, including Volvo Cars, NCC, Saab, Assa Abloy and AAK, as well as Danske Bank, Maersk and Vestas. Interim reports from Kesko, Konecranes and Neste in Finland are also expected. Among the quarterly reporting companies outside the Nordic region, are British Vodafone, American Amazon, Bristol-Myers Squibb, and Conoco Philips, as well as Japanese Sony. The macro news flow begins with industrial orders from Germany and industrial production in France for December. We will also receive interest rate announcements from the Bank of England and the ECB (European Central Bank), as well as weekly jobless claims from the US.
On Friday 6 February, interim results from the Swedish companies as Skanska, Lagercrantz, Balder and Industrivärden will be released. From the rest of the Nordic region, Telenor, Kone, Coloplast, Kongsberg, and Valmet are scheduled to report their quarterly results. Outside Europe, the American companies Biogen and Philip Morris, as well as the Japanese company Toyota are expected to report their interim results.Turning to the macro agenda, we will start with Japanese household consumption in December, followed by an interest rate announcement from India. The SCB will publish Sweden's CPI (Consumer Price Index) for January. Germany will contribute with data on the trade balance and industrial production in December. Later in the afternoon, the macro session will conclude with what is likely to be the most important figure of the week: US employment figures. We will also receive the Michigan Index from the US in February.
Where will the energy come from?
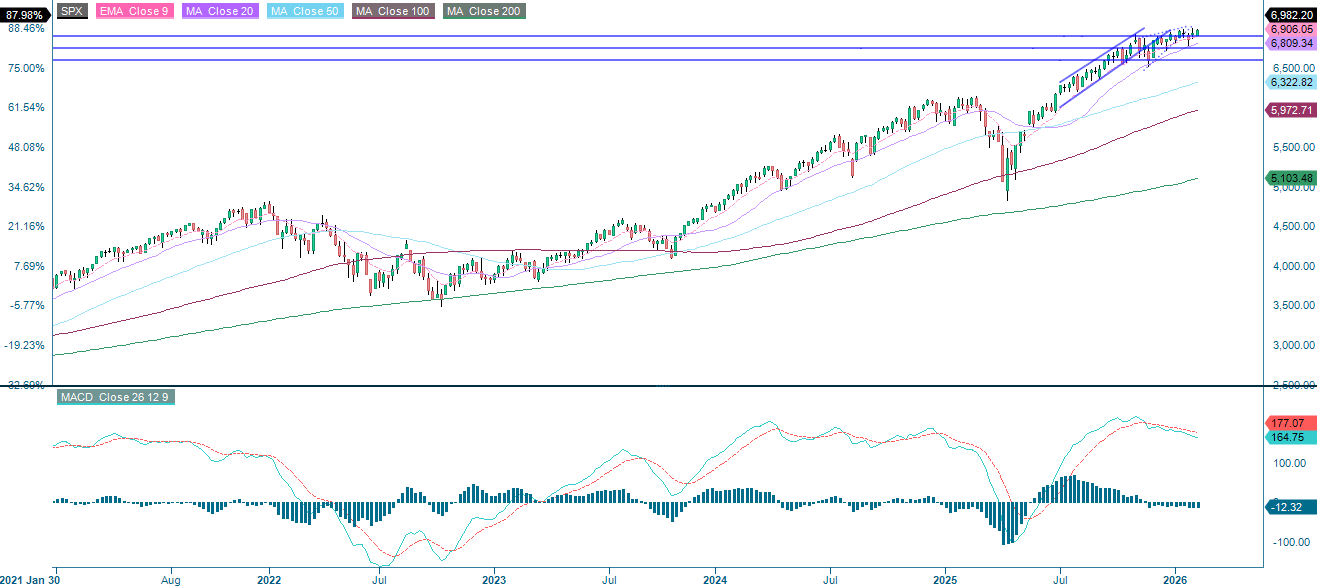
The S&P 500 is currently hovering just below its previous high, suggesting that some sort of trigger is needed for the index to reach new highs. Conversely, the RSI is in neutral territory, suggesting that further gains are possible.
Related Products
S&P 500 (in USD), one-year daily chart

S&P 500 (in USD), five-year weekly chart
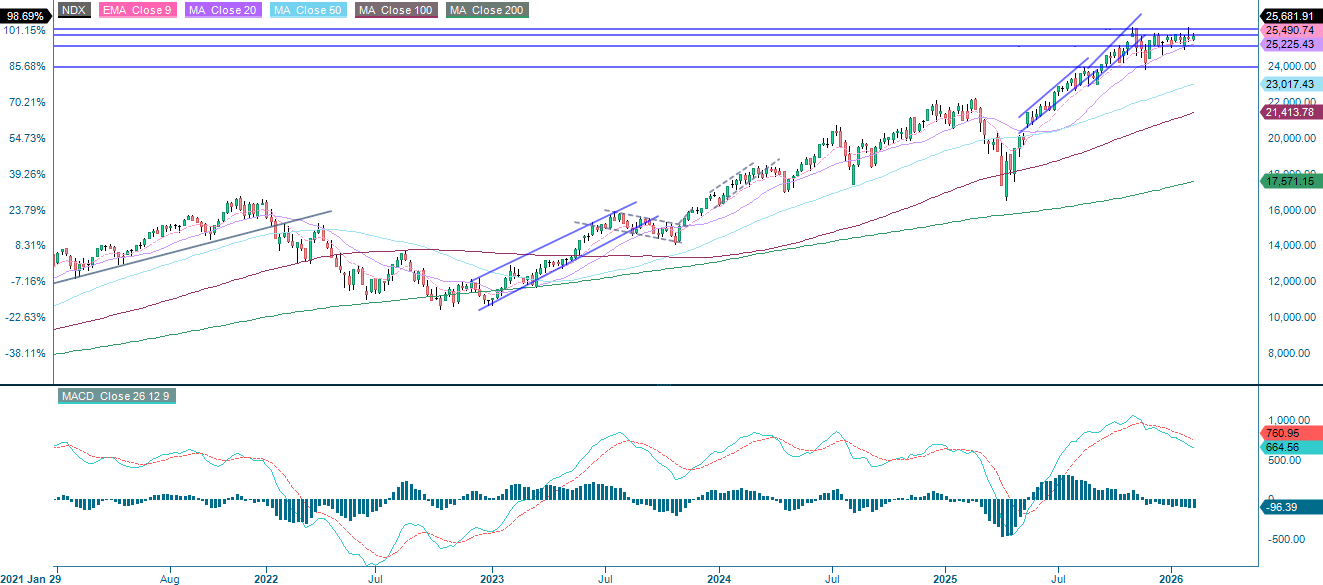
The NASDAQ-100 is currently facing resistance at around 25,740. The next step could be a break above the previous high of around 26,120. However, if sentiment turns sour, the index may start to approach the MA100, which is currently at 25,188.
Related Products
NASDAQ-100 (in USD), one-year daily chart

NASDAQ-100 (in USD), five-year weekly chart
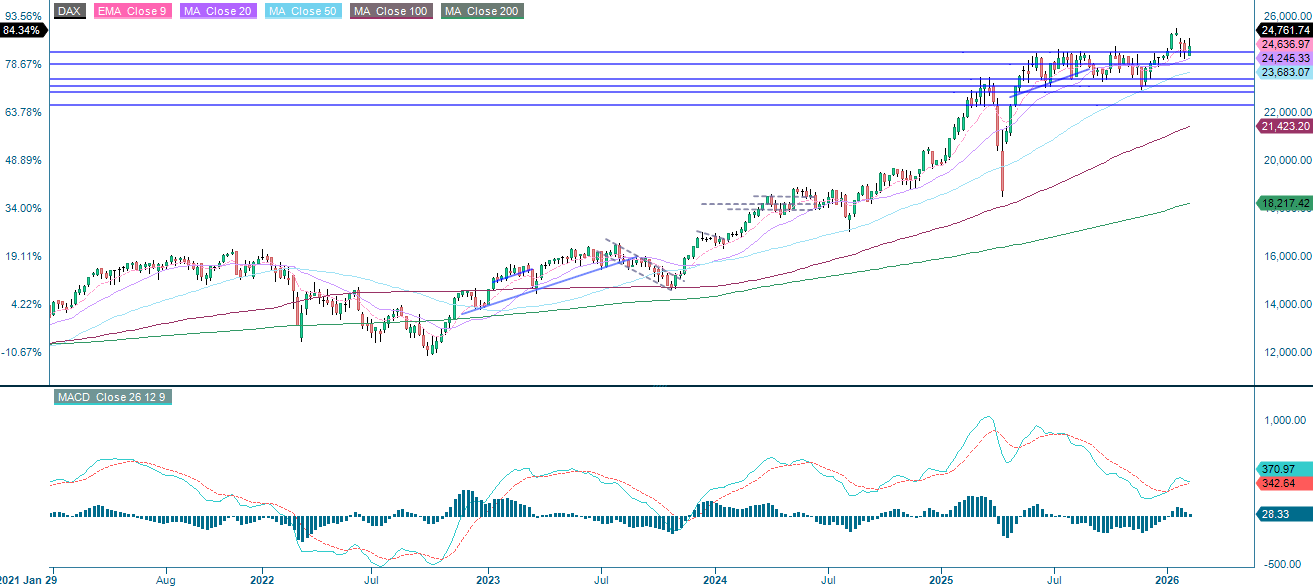
The German DAX attempted to break above the MA20 but is currently trading back below it. Support on the downside can be found at EMA9, followed by levels around 24,665 and MA50, which is currently at 24,382.
Related Products
DAX (in EUR), one-year daily chart

DAX (in EUR), five-year weekly chart
While the DAX is struggling to break above the 20-Day Moving Average (MA20), the OMXS30 is attempting to reach new highs. However, as the chart below shows, the RSI indicates overbought levels. Therefore, a consolidation phase would not be unexpected. If negative sentiment emerges, 3,035 serves as the first level of support, followed by the MA, which is currently just above the 3,000 level.
OMX30 (in SEK), one-year daily chart

OMX30 (in SEK), five-year weekly chart

The full name for abbreviations used in the previous text:
EMA 9: 9-Day Exponential Moving Average
Fibonacci: There are several Fibonacci lines used in technical analysis. Fibonacci numbers are a sequence in which each successive number is the sum of the two previous numbers.
MA20: 20-Day Moving Average
MA50: 50-Day Moving Average
MA100: 100-Day Moving Average
MA200: 200-Day Moving Average
MACD: Moving Average Convergence Divergence
Risks
Credit risk of the issuer:
Investors in the products are exposed to the risk that the Issuer or the Guarantor may not be able to meet its obligations under the products. A total loss of the invested capital is possible. The products are not subject to any deposit protection.
Currency risk:
If the product currency differs from the currency of the underlying asset, the value of a product will also depend on the exchange rate between the respective currencies. As a result, the value of a product can fluctuate significantly.
External author:
This information is in the sole responsibility of the guest author and does not necessarily represent the opinion of Bank Vontobel Europe AG or any other company of the Vontobel Group. The further development of the index or a company as well as its share price depends on a large number of company-, group- and sector-specific as well as economic factors. When forming his investment decision, each investor must take into account the risk of price losses. Please note that investing in these products will not generate ongoing income.
The products are not capital protected, in the worst case a total loss of the invested capital is possible. In the event of insolvency of the issuer and the guarantor, the investor bears the risk of a total loss of his investment. In any case, investors should note that past performance and / or analysts' opinions are no adequate indicator of future performance. The performance of the underlyings depends on a variety of economic, entrepreneurial and political factors that should be taken into account in the formation of a market expectation.
Market risk:
The value of the products can fall significantly below the purchase price due to changes in market factors, especially if the value of the underlying asset falls. The products are not capital-protected
Product costs:
Product and possible financing costs reduce the value of the products.
Risk with leverage products:
Due to the leverage effect, there is an increased risk of loss (risk of total loss) with leverage products, e.g. Bull & Bear Certificates, Warrants and Mini Futures.
Disclaimer:
This information is neither an investment advice nor an investment or investment strategy recommendation, but advertisement. The complete information on the products (securities) mentioned herein, in particular the structure and risks associated with an investment, are described in the base prospectus, together with any supplements, as well as the final terms relating to the securities. The base prospectus and final terms constitute the solely binding sales documents for the products mentioned herein. It is recommended that potential investors read these documents before making any investment decision. The documents and the key information document are published on the website of the issuer, Vontobel Financial Products GmbH, Bockenheimer Landstrasse 24, 60323 Frankfurt am Main, Germany, on https://prospectus.vontobel.com and are available from the issuer free of charge. The approval of the prospectus should not be understood as an endorsement of the securities. The securities are products that are not simple and may be difficult to understand. This information includes or relates to figures of past performance. Past performance is not a reliable indicator of future performance. This information may only be distributed or published in countries where such distribution or publication is permitted by applicable law. As stated in the relevant base prospectus, the distribution of the securities mentioned in this information is subject to restrictions in certain jurisdictions. This advertisement may not be reproduced or redistributed without prior permission by Vontobel.
© Bank Vontobel Europe AG and / or affiliated companies. All rights reserved.