A week of recovery for US stocks

A reduced sugar supply in the first half of 2026 could lead to higher prices. Brazil and India are the two largest sugar producers. While India is currently harvesting, Brazil is largely in the early stages of planting. So far, 13% of S&P 500 companies have released their Q4 2025results, with 75% exceeding Wall Street analysts' expectations. It has been a week of recovery for US stock indices. From a technical analysis point of view, new highs could be achievable.
Case of the week: Sugar could be a sweet investment in Q1 2026
Sugar futures spent most of 2025 trending downward due to ample supply and waning demand. However, since reaching a yearly low in November, there has been a slight recovery that has continued into 2026. Looking ahead, there may be further upward pressure as governments and suppliers take action to reduce supply.
Sugar, which is primarily grown in India and Brazil, is expected to face an oversupply due to abundant crops. For the 2025/26 season, the Indian Sugar Mills Association (ISMA) increased its production forecast to 31 million tonnes (MMT), up from an earlier estimate of 30 MMT. Furthermore, the ISMA lowered its ethanol demand estimate for sugar from 5 MMT to 3.4 MMT, meaning that more sugar could be available for export. In contrast, crops in Brazil are expected to be slightly lower than in the previous season. However, this is offset by a higher proportion of crops being exported rather than used for ethanol production. According to a fortnightly bulletin from UNICA, the proportion of production used for ethanol has fallen from approximately 52% to about 49% year over year (as of January 1, 2026). This shift is due to struggling ethanol prices, which have dropped from just under USD 2 per gallon to USD 1.5 over the last 4 months.
The current stage of the crop cycle means that India is in the middle of harvesting, while Brazil is largely in the early stages of planting. Abundant monsoon rains have improved prospects for the Indian and Thai crops. Consequently, production is looking strong while demand remains reined in. To combat falling prices, producers such as Südzucker are offering incentives to beet growers to reduce their allocated acreage for sugar in 2026, which would artificially reduce the supply. Furthermore, the Inward Processing Relief (IPR) policy is also keeping a lid on sugar prices. This policy allows sugar to be imported into the EU duty-free for processing into food, which is then exported outside the EU. There are currently calls to the European Commission to suspend IPR to raise prices.
Finally, on the demand side, it is likely that high retail prices have played a part in dampening demand. While coffee consumption has historically increased steadily over time, displaying resilience toward exogenous shocks, demand for cocoa and sugar has been more volatile in recent years. Looking ahead to 2026, there are some factors that suggest a potential recovery in demand. For instance, some countries are reducing VAT on food items to combat high consumer prices. While these efforts do not always extend to sugar products, the lower cost of 'essential foods' could have unintentionally boost spending on sugar products such as soft drinks and sweets, luxuries that might have been neglected recently due to rising food. Furthermore, if the production issues in Brazil continue, the estimated 'over-supply' could become exaggerated.
Overall, although some factors suggest bearish futures prices for sugar, there is an opportunity for prices to recover. For instance, La Niña could damage the Brazilian harvest in the 2025/26 season. Furthermore, a reduced IPR could further limit supplies. Therefore, investing in sugar could be a sweet start to 2026.
Sugar Future Mar 2026, one-year daily chart

Sugar Future Mar 2026, five-year weekly chart

Macro comments
As of January 23 2026, 13% of S&P 500 companies had reported their Q4 2025 results. According to Earnings Insight, 75% of these companies reported positive earnings per share (EPS) and revenue surprises. Earnings growth for S&P 500 companies is currently around 8%. The forward 12-month price-to-earnings ratio for the S&P 500 stands at about 22.
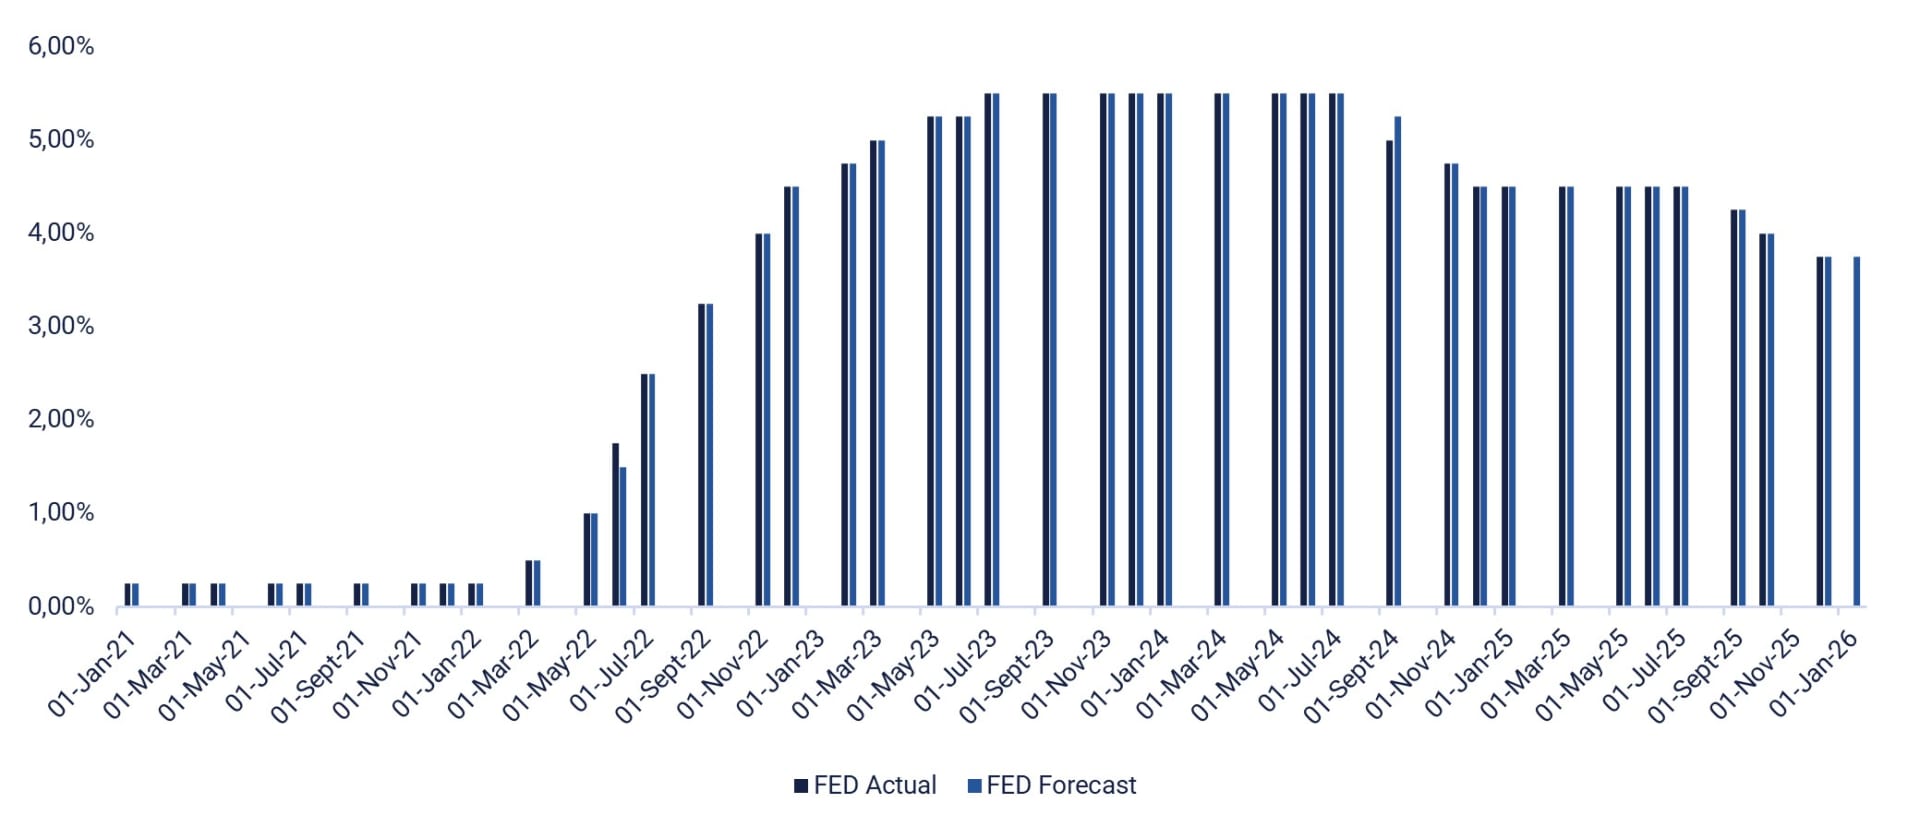
On Wednesday, January 28, several major US tech companies, including ASML Holding, AT&T, IBM, Meta Platforms, Microsoft and Tesla, as well as other major US companies such as Danaher, Lam Research, Starbucks and Whirlpool, will publish their interim results. Also on Wednesday, major Swedish companies including Tele2, Volvo and SSAB, as well as the Danish company Stolt-Nielsen, will report their quarterly results. Key macroeconomic news on Wednesday includes the release of Germany's GfK consumer confidence index for December and the publication of weekly oil inventory data by the US Department of Energy. The Federal Reserve and the Bank of Canada will also announce interest rate (see graph below).
On Thursday January 29, we will receive interim reports from several US companies, including Apple, Caterpillar, Honeywell, Lock Heed Martin, Mastercard, Thermo Fisher Scientific, and Visa. Among the larger European companies reporting on Thursday are Deutsche Bank, Roche, Sanofi and STMicroelectronics, as well as the Swedish companies SEB, Nordea, ABB, H&M, Telia and Swedbank, and the Finnish company Nokia. The macroeconomic news begins with Statistics Sweden's Gross Domestic Product (GDP) indicator for Q4 and household lending in Sweden in December. The National Institute of Economic Research will release its Swedish business climate barometer. The Swedish Riksbank will issue an interest rate announcement. For the eurozone, the January business climate barometer will be presented. The US will release the November trade balance ands industrial orders, Q3 productivity and initial weekly jobless claims.
On Friday, January 30, the major Swedish companies, including Autoliv, Electrolux, Hexagon, Holmen, SCA, and SKF will report their Q4 2025 results. Also on Friday, quarterly reports will also be released by the Danish company Elisa and the major American companies American Express, Chevron, Exxon Mobil, and Verizon.The week's macro statistics begin with Japan's December unemployment and industrial production. France will report its Q4 2025 GDP, while Germany will publish its December import prices, Q4 GDP, and January Consumer Price Index. Germany, Italy, Spain and the Eurozone will release their Q4 GDP figures, and Spain will also release its January Consumer Price Index (CPI). The US will present its December Producer Price Index and January Chicago Purchasing Managers' Index.
Federal Reserve, interest rates (%), January 2021 to December 2025 (actual) and January 2026 (forecast)
Is it time for new highs after Davos?
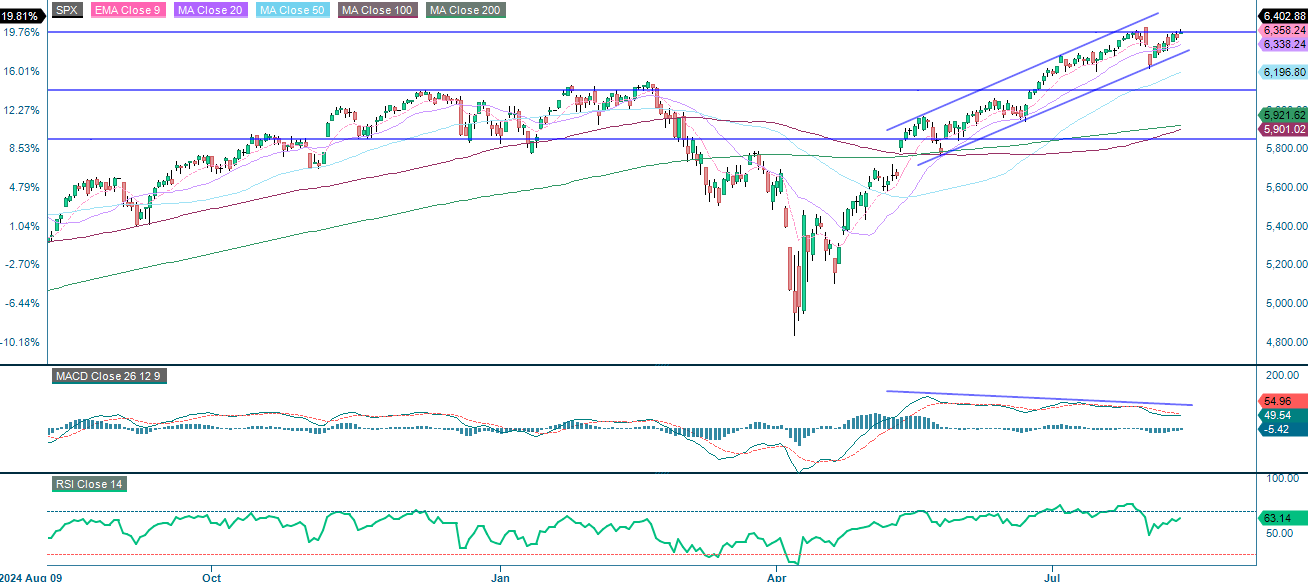
Since President Trump indicated in his Davos speech that the US would not use military force to take control of Greenland, the S&P 500 has recovered most of its decline. As shown by the Moving Average Convergence Divergence (MACD), momentum is positive, while the Relative Strength Index (RSI) is neutral. Consequently, new highs cannot be ruled out during this wave.
Related Products
S&P 500 (in USD), one-year daily chart
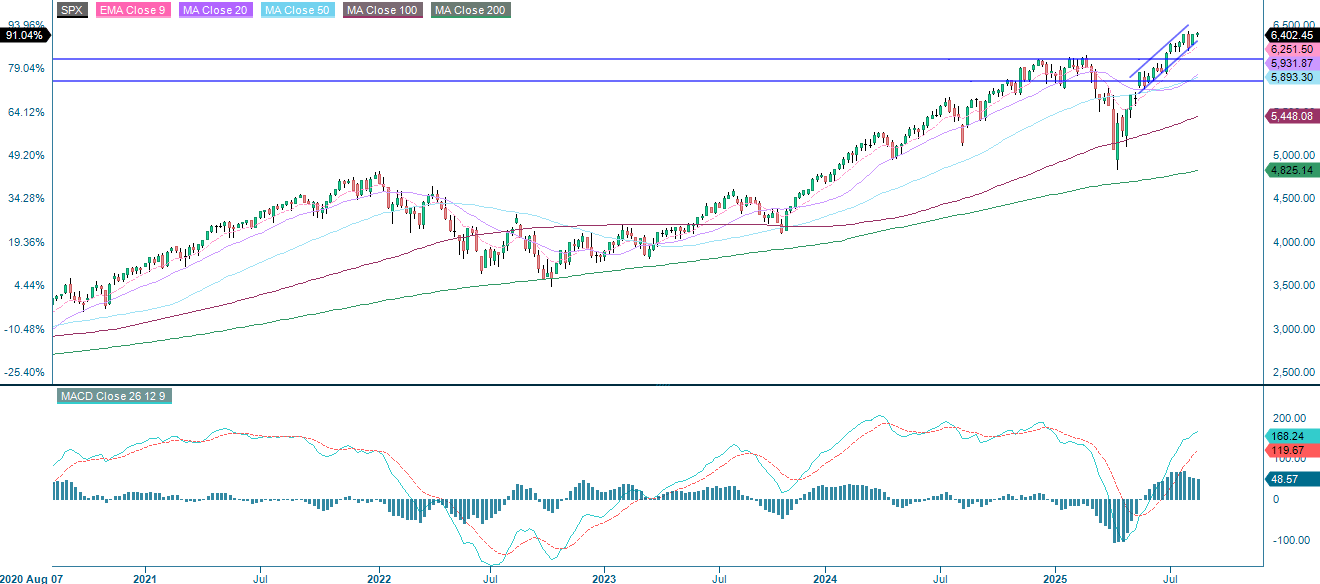
S&P 500 (in USD), five-year weekly chart
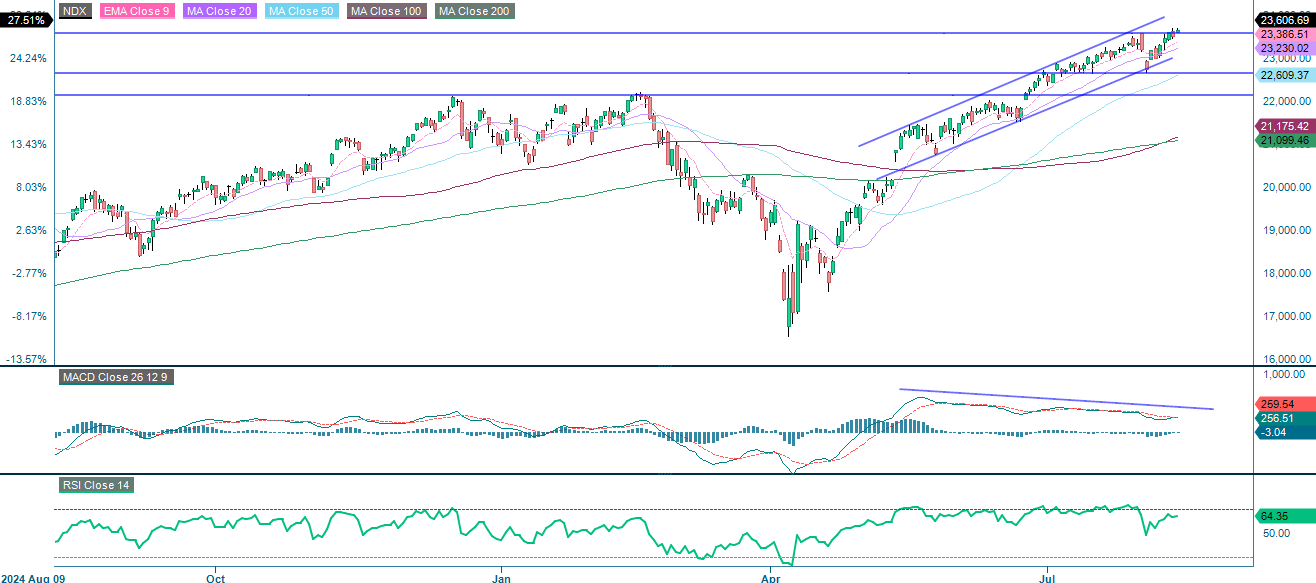
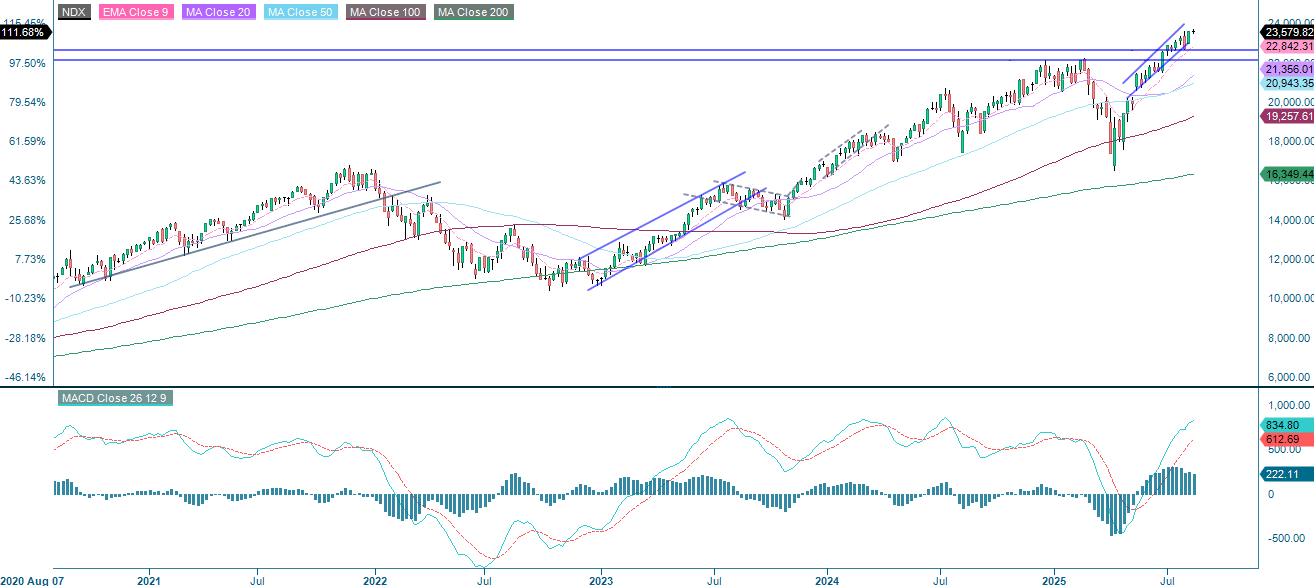
The NASDAQ-100 is currently trading above the soft resistance level of around 25,735. With the MACD still in positive territory and the RSI indicating a neutral position, the index may be poised to retest its previous high.
Related Products
NASDAQ-100 (in USD), one-year daily chart
NASDAQ-100 (in USD), five-year weekly chart
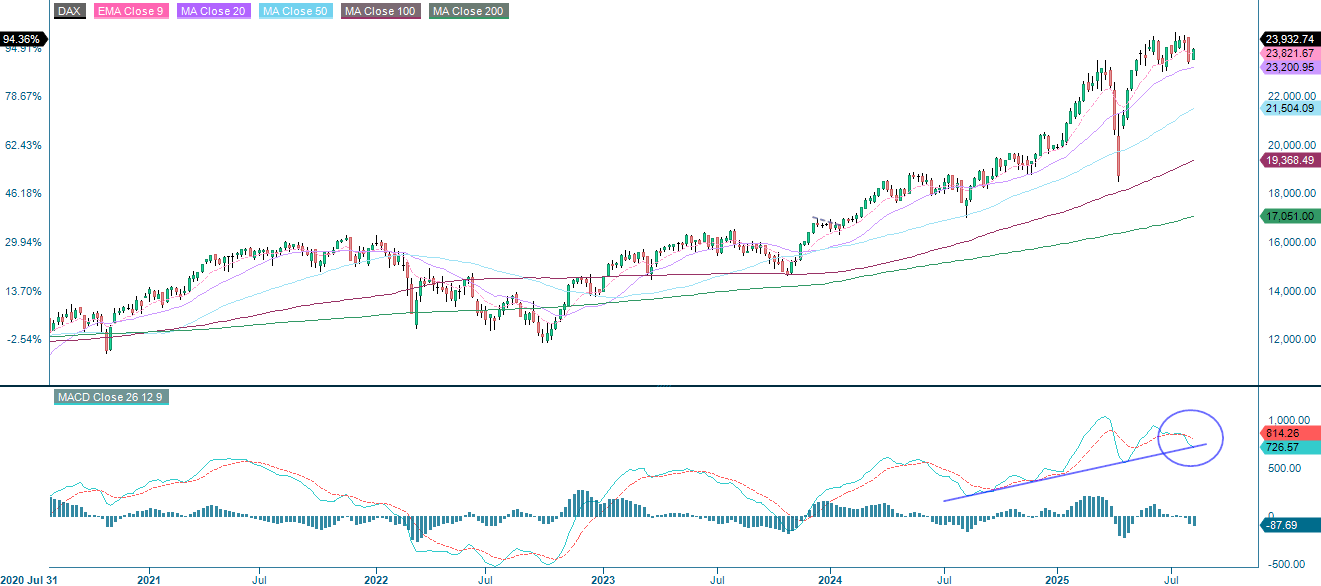
The German DAX is trading in line with a rising 20-Day Moving Average. Although the MACD remains positive, momentum is easing. The gap from January 19 remains open. If it is not closed within the next few sessions, when resistance is expected at around 25,400, the risk of a downward trend will increase. Support is located around 24,500.
Related Products
DAX (in EUR), one-year daily chart
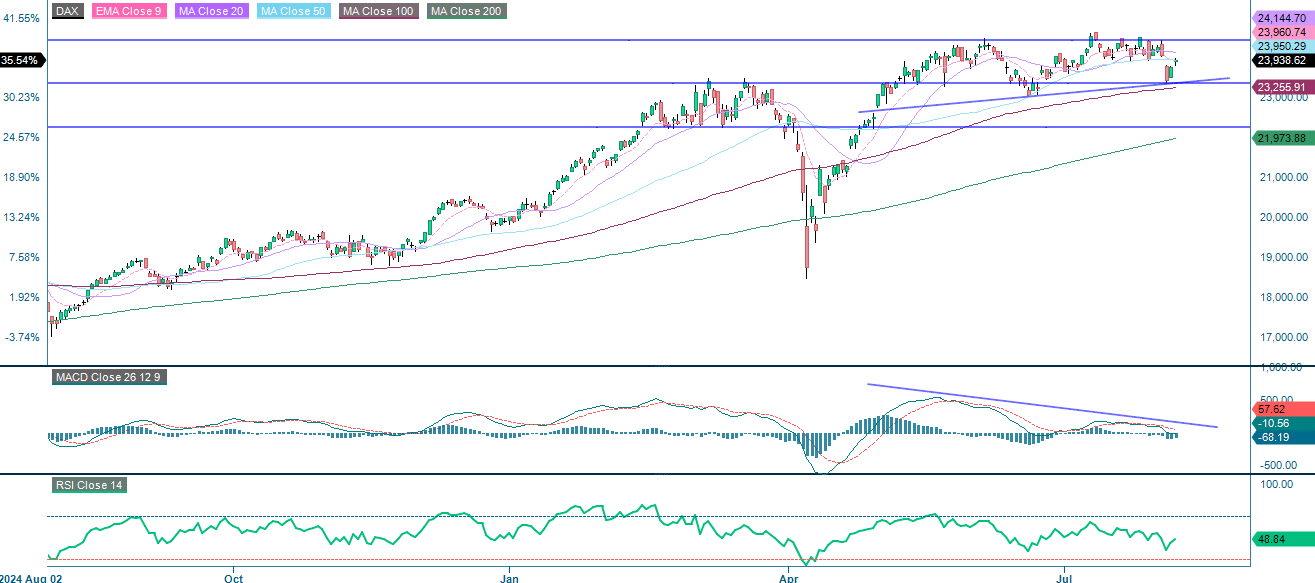
DAX (in EUR), five-year weekly chart
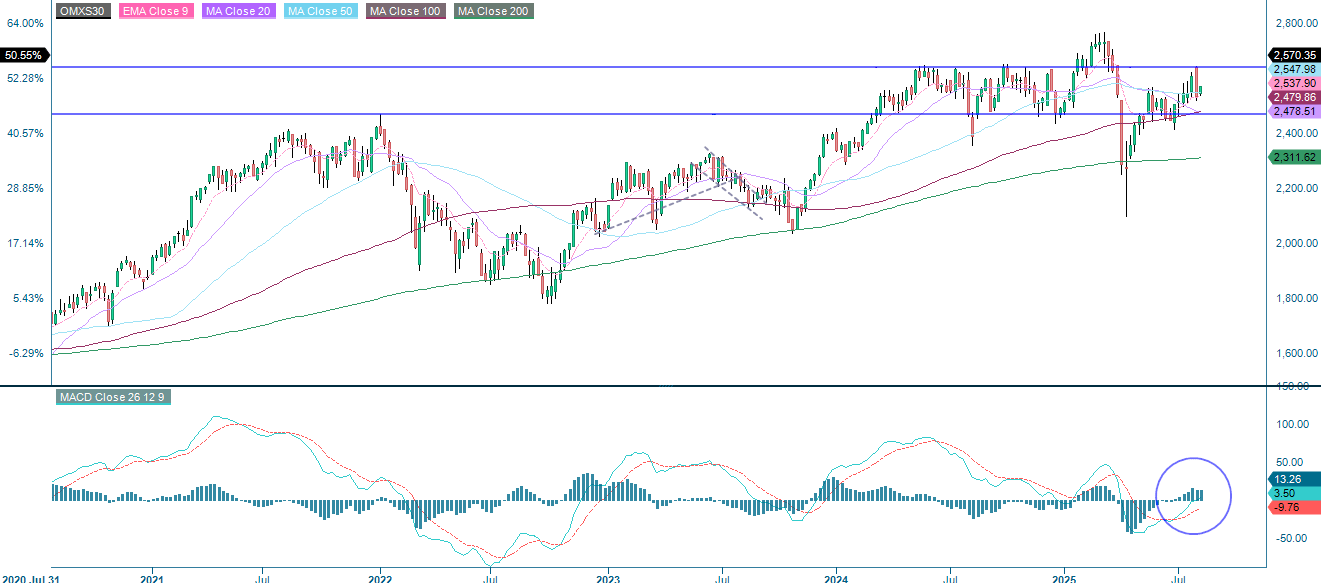
In contrast, the Swedish OMXS30 has filled the gap and is now trading close to its previous high. The RSI is in overbought territory. However, this does not constitute a sell signal in isolation. If you were brave enough to buy when the market was down, now might be a good time to secure some profits.
OMX30 (in SEK), one-year daily chart
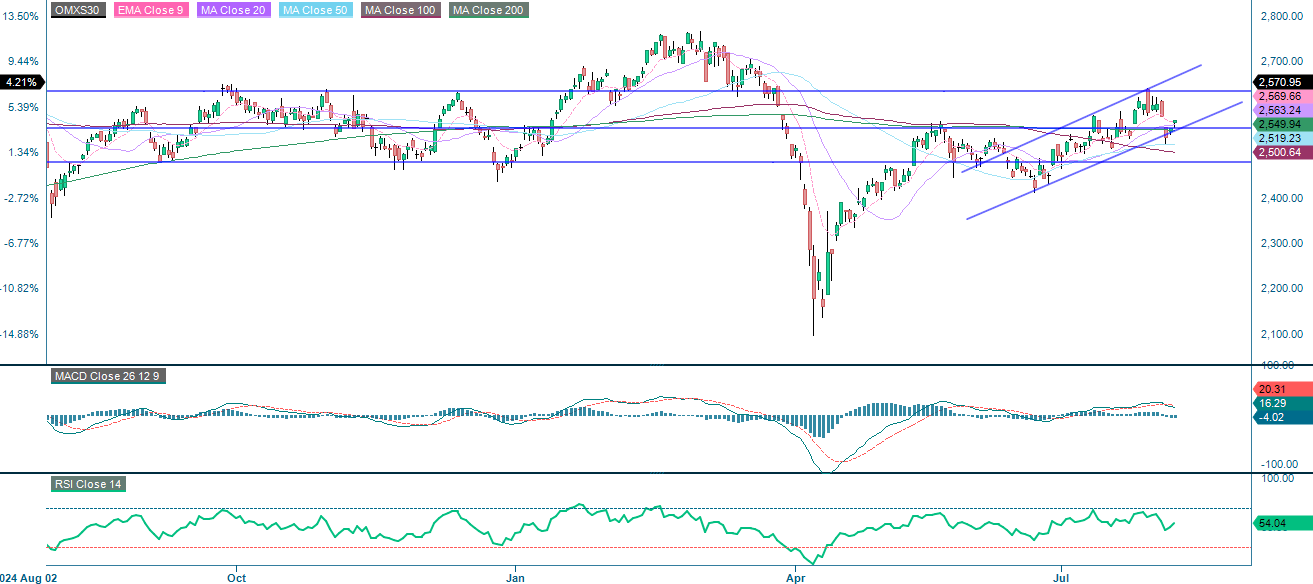
OMX30 (in SEK), five-year weekly chart
The full name for abbreviations used in the previous text:
EMA 9: 9-day exponential moving average
Fibonacci: There are several Fibonacci lines used in technical analysis. Fibonacci numbers are a sequence in which each successive number is the sum of the two previous numbers.
MA20: 20-Day Moving Average
MA50: 50-Day Moving Average
MA100: 100-Day Moving Average
MA200: 200-Day Moving Average
MACD: Moving Average Convergence Divergence
Risks
Credit risk of the issuer:
Investors in the products are exposed to the risk that the Issuer or the Guarantor may not be able to meet its obligations under the products. A total loss of the invested capital is possible. The products are not subject to any deposit protection.
Currency risk:
If the product currency differs from the currency of the underlying asset, the value of a product will also depend on the exchange rate between the respective currencies. As a result, the value of a product can fluctuate significantly.
Market risk:
The value of the products can fall significantly below the purchase price due to changes in market factors, especially if the value of the underlying asset falls. The products are not capital-protected
Product costs:
Product and possible financing costs reduce the value of the products.
Risk with leverage products:
Due to the leverage effect, there is an increased risk of loss (risk of total loss) with leverage products, e.g. Bull & Bear Certificates, Warrants and Mini Futures.
External author:
This information is in the sole responsibility of the guest author and does not necessarily represent the opinion of Bank Vontobel Europe AG or any other company of the Vontobel Group. The further development of the index or a company as well as its share price depends on a large number of company-, group- and sector-specific as well as economic factors. When forming his investment decision, each investor must take into account the risk of price losses. Please note that investing in these products will not generate ongoing income.
The products are not capital protected, in the worst case a total loss of the invested capital is possible. In the event of insolvency of the issuer and the guarantor, the investor bears the risk of a total loss of his investment. In any case, investors should note that past performance and / or analysts' opinions are no adequate indicator of future performance. The performance of the underlyings depends on a variety of economic, entrepreneurial and political factors that should be taken into account in the formation of a market expectation.
Disclaimer:
This information is neither an investment advice nor an investment or investment strategy recommendation, but advertisement. The complete information on the products (securities) mentioned herein, in particular the structure and risks associated with an investment, are described in the base prospectus, together with any supplements, as well as the final terms relating to the securities. The base prospectus and final terms constitute the solely binding sales documents for the products mentioned herein. It is recommended that potential investors read these documents before making any investment decision. The documents and the key information document are published on the website of the issuer, Vontobel Financial Products GmbH, Bockenheimer Landstrasse 24, 60323 Frankfurt am Main, Germany, on https://prospectus.vontobel.com and are available from the issuer free of charge. The approval of the prospectus should not be understood as an endorsement of the securities. The securities are products that are not simple and may be difficult to understand. This information includes or relates to figures of past performance. Past performance is not a reliable indicator of future performance. This information may only be distributed or published in countries where such distribution or publication is permitted by applicable law. As stated in the relevant base prospectus, the distribution of the securities mentioned in this information is subject to restrictions in certain jurisdictions. This advertisement may not be reproduced or redistributed without prior permission by Vontobel.
© Bank Vontobel Europe AG and / or affiliated companies. All rights reserved.