Global geopolitical risks are increasing

The Greenland crisis between the US and Denmark has caused European defence stocks to rise. However, the funding and risk associated with the higher interest rates due to increased European defence spending over the next decade have not been discounted in the same way. The reporting season for S&P 500 companies in the US started well, with 79% of companies reporting positive earnings surprises.
Case of the week: Higher European defence spending could boost interest rates
At the time of writing, the United States and European NATO allies are at odds over President Trump's demand to take over Greenland from Denmark. This constitutes a direct threat from one NATO ally (the US) to another (Denmark). In retaliation, President Trump imposed 10% tariffs on eight European NATO countries from 1 February, increasing them to 25% on 1 June. Four of these countries are Nordic, and six belong to the EU. These actions jeopardise the US-EU trade agreement, finalised in summer 2025. Higher tariffs between the United States and the European Union could lead to higher inflation and interest rates in both regions.
The United States accounts for over half of NATO's military spending. European members have relied on the United States for protection, primarily against threats from Russia. Following his election as president in 2016 and again in 2020, Trump pressured other NATO members to increase their military spending from 2% to 5% of their GDP. On June 25, 2025, the other NATO members finally agreed to the higher requirement of 5% by 2035.
Russia's invasion of Ukraine in 2022, the US's demand that European states increase their defence budgets as well as the US's military attack on Venezuela and threat to take over Greenland have all significantly increased the value of European defence stocks. When the United States seeks to acquire territory from a NATO ally, Denmark, Europe's conclusion is that they must develop their own military capabilities, which, until now, have been mainly provided by the United States.
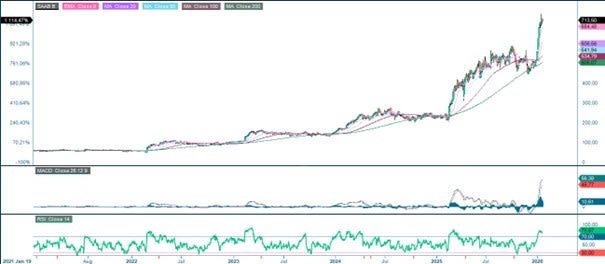
In recent years, defence stocks have become a popular topic among brokers and fund managers. Examples of European defence stocks include Rheinmetall, Saab, BAE Systems, the Renk Group, Airbus SE and Safran SA. Since Russia invaded Ukraine on February 24, 2022, Saab AB's market capitalisation has grown from nearly SEK 29 billion to around SEK 400 billion (see graph below). This increase stock price is also due to the expectations that Europe will increase its purchases from European defence companies and decrease its purchases from American companies.
SAAB AB (in SEK), five-year daily chart
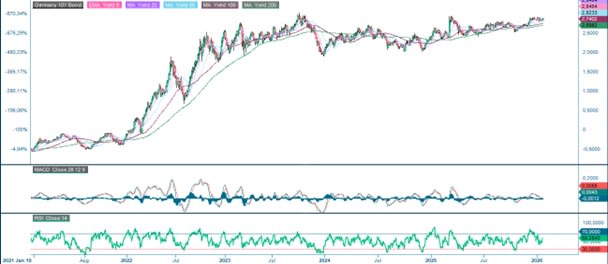
The question of how these sharply increased European military budgets will be financed over the next decade has received little discussion. At a time when Europe accounts for about 25% of the global GDP, this question is important, as is the question of their potential impact on future market interest rates. There are three ways to finance such increased spending: One option is to raise taxes. Another option is to reduce spending in other areas, such as healthcare and education. The third option, which is the most politically expedient way to avoid angering voters, is for European states to increase borrowing to finance defence investments. However, the average national debt of EU countries is already over 80% of GDP, and the UK's is over 90%. Large European countries, such as France, Italy, and Spain, have a national debt exceeding 100% of their annual GDP. If EU countries were to increase defense spending from 2% to 5% of GDP and choose to borrow, their debt would rise from 80% to 110% of GDP within ten years. This would also likely cause European countries’ creditworthiness to decline, resulting in higher market interest rates.
A solution to the Greenland crisis could prompt a recovery in the stock market. For instance, in an upcoming verdict, the US Supreme Court could reject some or all of Trump's previous tariff proposals in an upcoming verdict. However, this is not guaranteed. The long-term commitment to arming Europe's defense forces will put upward pressure on market interest rates for many years to come.
Related Products
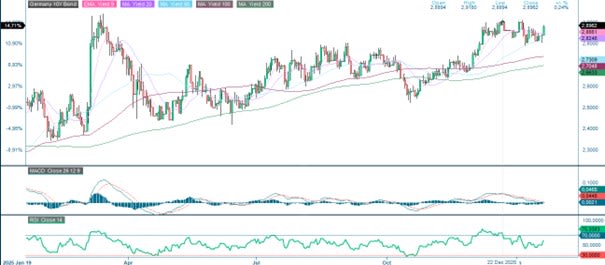
German 10-year Treasury yield (in %), one-year daily chart
Germany 10-year Treasury yield (in %), five-year weekly chart
Macro comments
As of January 16, 2026, 7% of S&P 500 companies had reported their Q4 2025 results. According to Earnings Insight, 79% of those companies reported a positive earnings per share (EPS) surprise, while 67% reported a positive revenue surprise. So far, the average EPS surprise for S&P 500 companies so far is 5.8%, down from 6.6% in Q3 2025. In the financial sector, where seven major banks reported last week, 69% of companies reported a positive EPS surprise, averaging 0.5%.
US companies Johnson & Johnson, Charles Schwab and Prologis are scheduled to release their Q4 2025 reports on Wednesday, January 21. The Swedish company Avanza is also expected to report its quarterly results. The day's macroeconomic news will begin with the release of the UK's consumer and producer price indices for December, as well as the CBI's industrial trends report for January. The IEA will also release a monthly oil report. The US will release data on pending home sales for December and construction spending for October.
On Thursday, January 22, the following US companies are scheduled to release their quarterly reports: Intel, GE Aerospace, Procter & Gamble, Intuitive Surgical and Abbott Laboratories. The same day, the Swedish companies EQT, Essity and Investor, the Danish company Tryg, and the French company LVMH will also report their Q4 2025 results.The day's macroeconomic news begins with South Korea's Q4 GDP and December trade balance. We will also receive a confidence indicator from Eurozone households for January (see the graph below) and an interest rate announcement from Norges Bank. From the US, we will receive weekly jobless claims, Q3 GDP, and personal consumption and inflation (PCE) figures for November, as well as weekly oil inventory data from the Department of Energy and the Kansas Fed Index for January.
On Friday January 23, the Swedish company Ericsson is scheduled to report its Q4 2025 results. Macro news will be dominated by the release of January's Purchasing Managers' Index (PMI) data from Japan, India, France, Germany, the Eurozone, the UK and the US. In Japan, the December Consumer Price Index and a rate announcement from the Bank of Japan are due to be released. In Europe, retail sales data for December from the UK and a January confidence indicator from the French industry are expected. In the US, the January Michigan Index is scheduled.
Eurozone Consumer Confidence from February 2021 to December 2025

The Bears appear to be coming back
Renewed trade and tariff tensions between President Trump and the EU have pushed the S&P 500 down, with it now trading at the 6,830-support level provided by the MA50. The next downside level is around 6,745. The bearish rising-wedge formation has broken down, and the pattern suggests that levels around 6,600 could be reached. In this situation, buying the dip in the short term is only for the bravest of investors. It is also worth noting that the 10-year US Treasury yield has started to rise relatively quickly. Continued increases in US yields are unlikely to benefit equities.
Related Products
S&P 500 (in USD), one-year daily chart

S&P 500 (in USD), five-year weekly chart

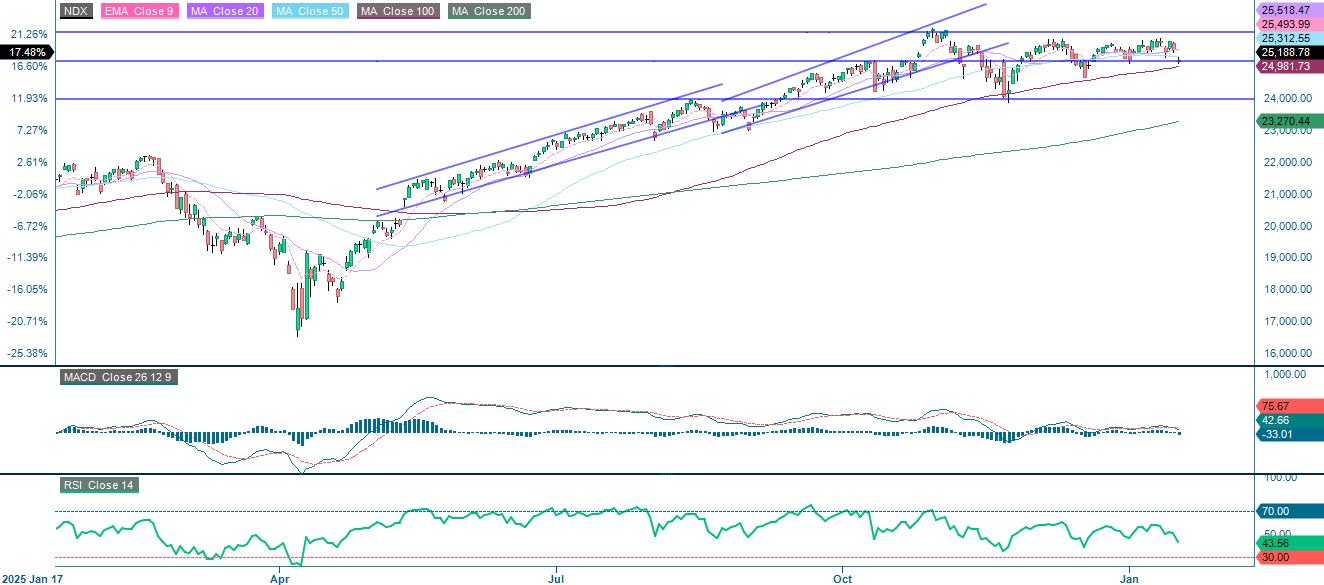
The NASDAQ-100 is also trading at the 25,150-support level. The next level to watch is the MA100, currently at 25,891, with a break below this level potentially leading to a fall to around 24,000. If yields continue to increase, the NASDAQ-100 is likely to be affected more negatively than the S&P 500.
Related Products
NASDAQ-100 (in USD), one-year daily chart
NASDAQ-100 (in USD), five-year weekly chart

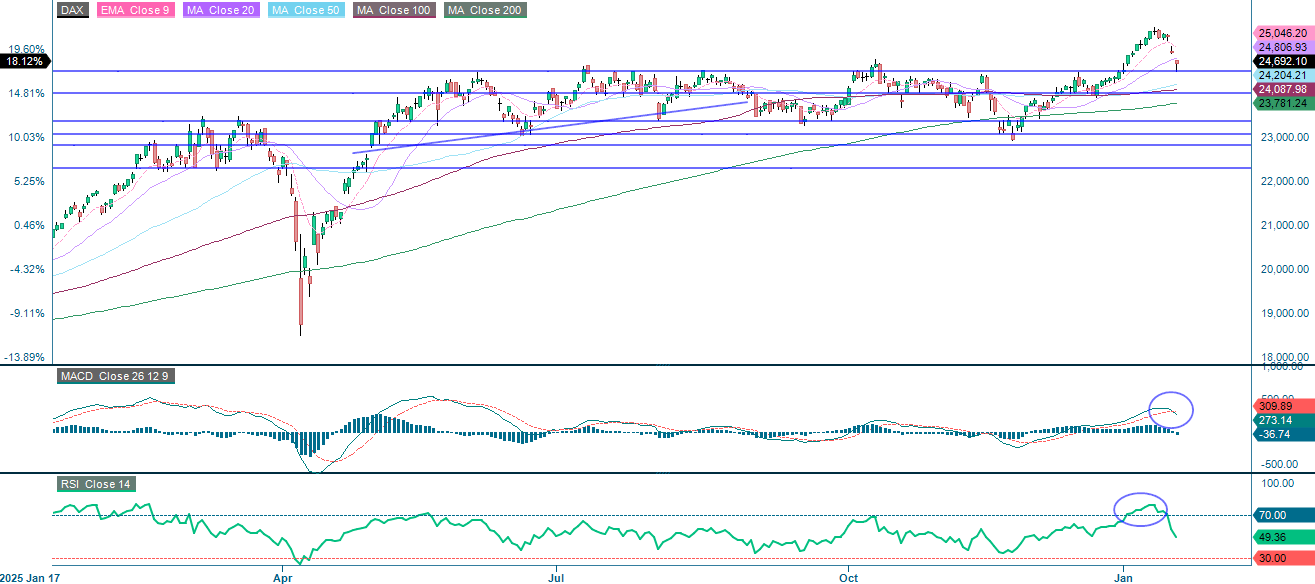
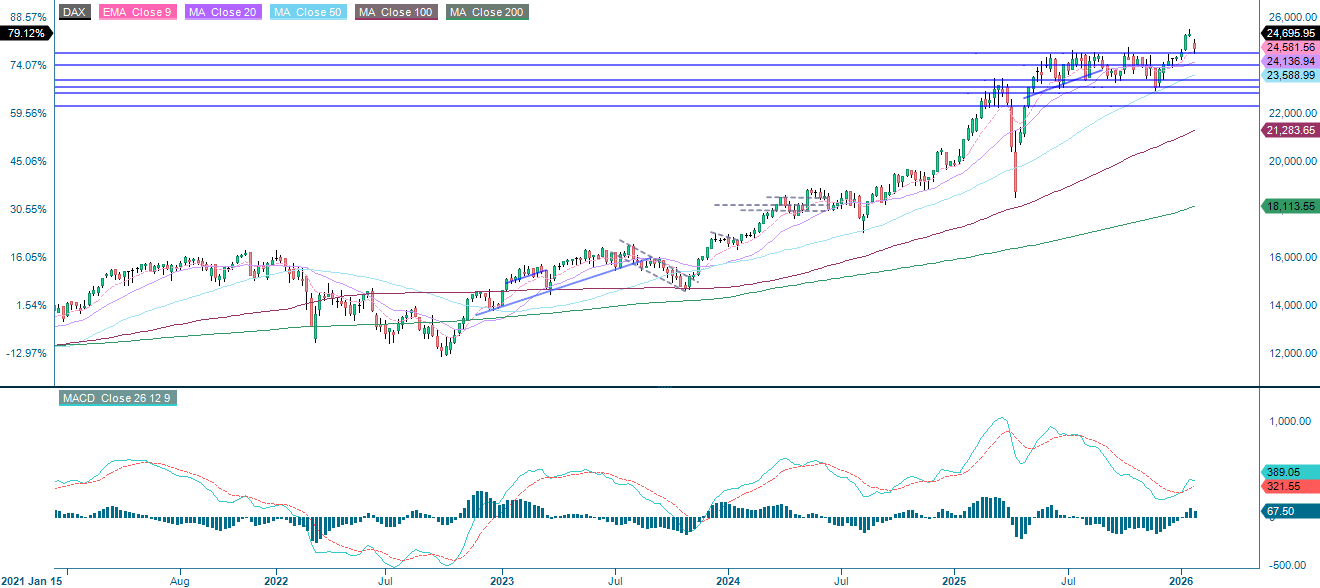
The DAX has fallen sharply and is currently trading below the 20-day moving average, but above the support level of around 24,500. If this level is broken, the next target could be 24,000.
Related Products
DAX (in EUR), one-year daily chart
DAX (in EUR), five-year weekly chart
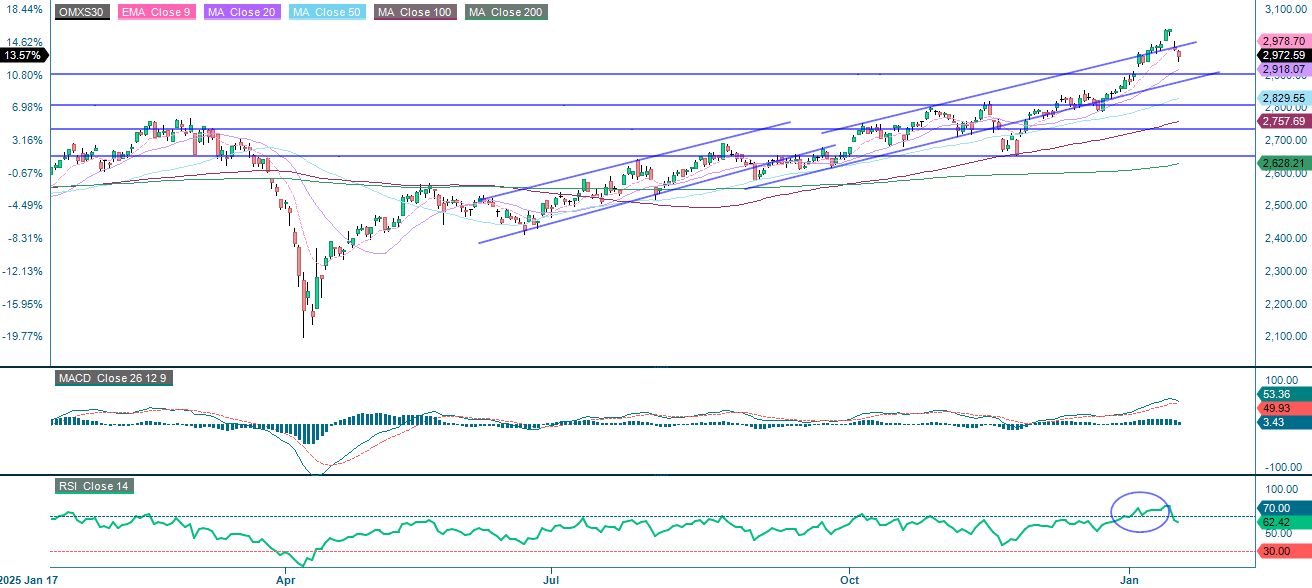
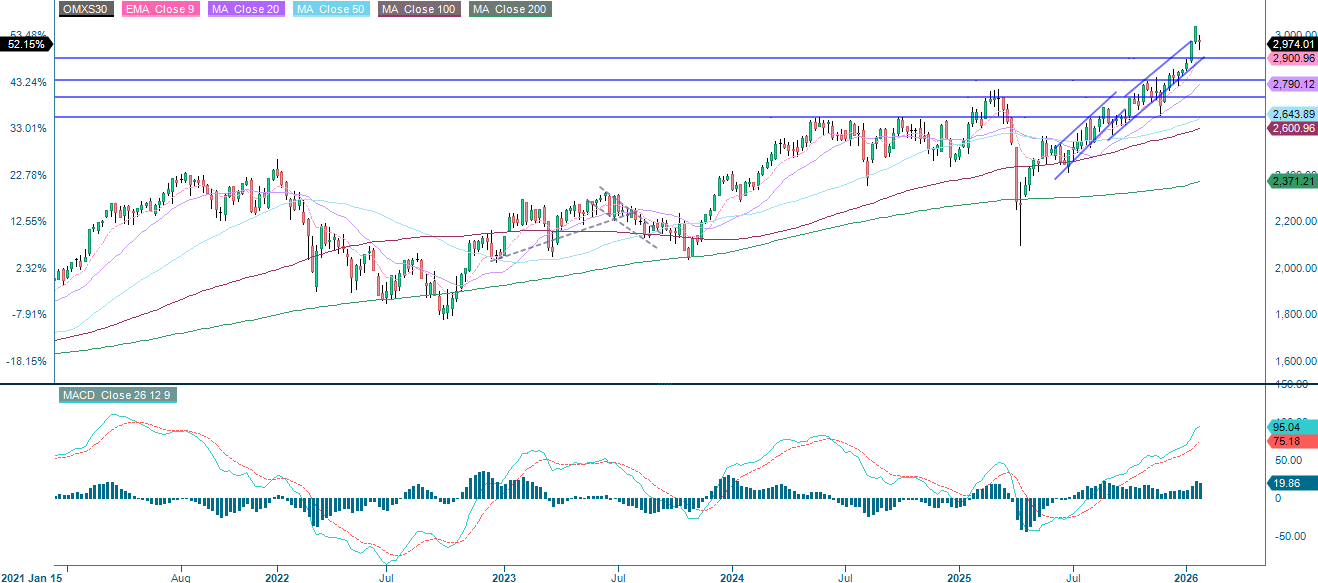
Following a strong rally, the OMXS30 has returned to the upward-sloping trend channel. The MA20, which is currently at 2,918, serves as the first level of support, closely followed by 2,900 and the floor of the rising trend channel.
OMX30 (in SEK), one-year daily chart
OMX30 (in SEK), five-year weekly chart
The full name for abbreviations used in the previous text:
EMA 9: 9-day Exponential Moving Average
Fibonacci: There are several Fibonacci lines used in technical analysis. Fibonacci numbers are a sequence in which each successive number is the sum of the two previous numbers.
MA20: 20-day Moving Average
MA50: 50-day Moving Average
MA100: 100-day Moving Average
MA200: 200-day Moving Average
MACD: Moving Average Convergence Divergence
Risks
Credit risk of the issuer:
Investors in the products are exposed to the risk that the Issuer or the Guarantor may not be able to meet its obligations under the products. A total loss of the invested capital is possible. The products are not subject to any deposit protection.
Currency risk:
If the product currency differs from the currency of the underlying asset, the value of a product will also depend on the exchange rate between the respective currencies. As a result, the value of a product can fluctuate significantly.
External author:
This information is in the sole responsibility of the guest author and does not necessarily represent the opinion of Bank Vontobel Europe AG or any other company of the Vontobel Group. The further development of the index or a company as well as its share price depends on a large number of company-, group- and sector-specific as well as economic factors. When forming his investment decision, each investor must take into account the risk of price losses. Please note that investing in these products will not generate ongoing income.
The products are not capital protected, in the worst case a total loss of the invested capital is possible. In the event of insolvency of the issuer and the guarantor, the investor bears the risk of a total loss of his investment. In any case, investors should note that past performance and / or analysts' opinions are no adequate indicator of future performance. The performance of the underlyings depends on a variety of economic, entrepreneurial and political factors that should be taken into account in the formation of a market expectation.
Market risk:
The value of the products can fall significantly below the purchase price due to changes in market factors, especially if the value of the underlying asset falls. The products are not capital-protected
Product costs:
Product and possible financing costs reduce the value of the products.
Risk with leverage products:
Due to the leverage effect, there is an increased risk of loss (risk of total loss) with leverage products, e.g. Bull & Bear Certificates, Warrants and Mini Futures.
Disclaimer:
This information is neither an investment advice nor an investment or investment strategy recommendation, but advertisement. The complete information on the products (securities) mentioned herein, in particular the structure and risks associated with an investment, are described in the base prospectus, together with any supplements, as well as the final terms relating to the securities. The base prospectus and final terms constitute the solely binding sales documents for the products mentioned herein. It is recommended that potential investors read these documents before making any investment decision. The documents and the key information document are published on the website of the issuer, Vontobel Financial Products GmbH, Bockenheimer Landstrasse 24, 60323 Frankfurt am Main, Germany, on https://prospectus.vontobel.com and are available from the issuer free of charge. The approval of the prospectus should not be understood as an endorsement of the securities. The securities are products that are not simple and may be difficult to understand. This information includes or relates to figures of past performance. Past performance is not a reliable indicator of future performance. This information may only be distributed or published in countries where such distribution or publication is permitted by applicable law. As stated in the relevant base prospectus, the distribution of the securities mentioned in this information is subject to restrictions in certain jurisdictions. This advertisement may not be reproduced or redistributed without prior permission by Vontobel.
© Bank Vontobel Europe AG and / or affiliated companies. All rights reserved.