Investors will focus on the guidance from the Fed

This week, the focus is on the USD/AUD currency pair. We argue that the Australian dollar's dependence on exports to China's struggling real estate construction sector, particularly iron ore, could be disadvantageous in 2026. Combined with Australia’s domestic economy facing stagflation, this could result in a weaker AUD against the USD. Meanwhile, investors in the global stock market are awaiting the Federal Reserve's interest rate decision on Wednesday evening. A rate cut of 25 basis points is anticipated. Therefore, the Fed’s guidance will be crucial for the stock market.
Case of the week: Stagflation and a link to China could weaken the AUD
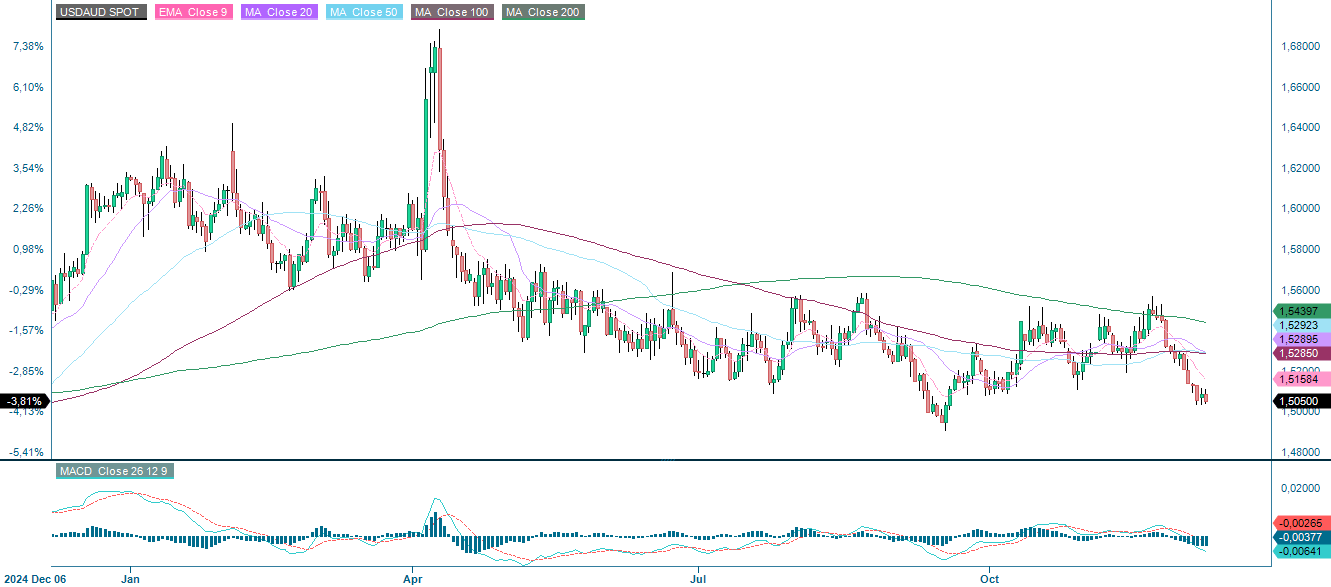
The USD/AUD has been trading sideways for some time, exhibiting a pattern of bouncing between 1.50 and 1.55 AUD per USD since July. It is currently in a trough, likely due to general expectations of an interest rate cut from the FOMC (at the time of writing, this announcement had not yet been made). In Australia, the RBA has kept interest rates at 3.6% to counteract a persistent inflation rate of 3.8%, as reported in the latest October update. They have even gone as far as to suggest two potential rate hikes in 2026. The future may be set, with a decline in the USD/AUD likely on the back of interest rate decisions. However, economic weakness in Australia could cause the AUD to slip in the coming year.
The USD/AUD is one of the most actively traded currency pairs, accounting for approximately 5% of the global foreign exchange (FX) market. A defining feature of the 'Aussie' is its strong association with commodities, particularly gold and other base metals that Australia exports in large quantities. Given that Australia is a major exporter of commodities, the AUD has historically benefited from stronger demand for these goods. However, since China imports more than a third of Australia’s exports, the AUD is also highly sensitive to Chinese economic data, industrial activity and risk sentiment. Consequently, the USD/AUD tends to behave as a risk-on bet, strengthening when global economic optimism rises and weakening during risk-off periods.
In terms of Australia's indicators, growth momentum is improving, albeit from low levels. The OECD highlights that growth driven by the private sector has strengthened in 2025 thanks to falling interest rates, increased household disposable income, and improved business sentiment. Furthermore, in December, the Australian Bureau of Statistics (ABS) released data showing that discretionary spending had surged, with demand outpacing supply. Since spending slumped over the winter period in June, households have started spending more on clothing, footwear, furnishings and electronics, driven by rising wages. However, productivity remains low, with the quarterly figure rising by just 0.2% in the three months ending in September, typically falling between -0.5% and 0.4% over the past 18 months. In comparison, supply has increased by 2.1% over three months, while demand has increased by 2.6%, giving rise to inflationary pressures. This contrasts with rising unemployment, with the seasonally adjusted unemployment rate reaching 4.5% in September, up from 4.3% the previous month.
Considering the indicators for Australia are considered together, it appears that stagflation could be on the horizon in 2026. This is literally defined as a period of inflation, low productivity and rising unemployment. Furthermore, rate hikes are not an ideal solution to the problem, as many will remember from the Volcker shock of the 1980s. In this respect, the AUD's link to commodities could be crucial, especially gold, as most central banks are increasing their supplies. However, Australia’s main export is iron ore, not gold. Additionally, China, Australia's primary trading partner, has shown notable distress in its steel sector, due to slowdowns in domestic real estate construction and declining housing demand. This hurts export prospects, and if demand for iron ore falls further, there could be even more unemployment in the mining sector.
Regardless of a potential 25-basis-point cut from the Fed, there are many signs pointing to a stagflation-like environment in Australia in 2026. Economic weakness is strongly correlated with currency depreciation. Discretionary policies from the ruling Labor Party may be necessary to turn things around in Australia. Therefore, traders willing to take risks could benefit from a falling AUD in 2026.
USD/AUD (spot price), one-year daily chart
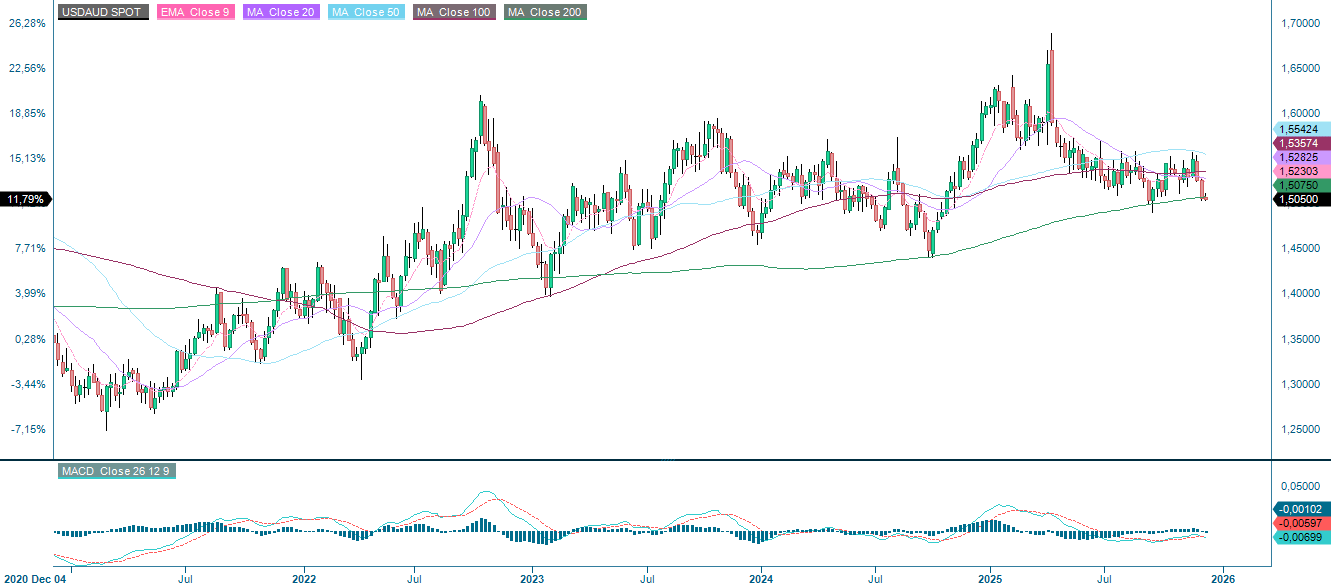
USD/AUD (spot price), five-year weekly chart
Macro comments
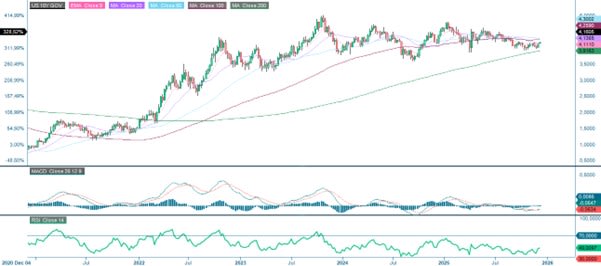
The highlight of the week will be this evening (Wednesday, December 10), when the Federal Reserve is expected to announce a cut in its policy rate of 25-basis-point cut in its policy rate, a move , which the market has priced in at 89%. The Fed faces the challenging task of balancing the weak US economy and labor market with inflationary pressure. The weaker US dollar and the higher tariffs on imported goods and services are likely to have contributed to inflation in the US in 2025. Following the Fed’s press conference, the direction of the stock market will depend on the Fed’s guidance about the future interest rates. As the graph below shows, the trend for the US 10-year Treasury yield is falling, albeit slightly.
The following companies will release their interim reports on Wednesday, December 10: US companies Adobe, Oracle and Synopsys; as well as the Swedish retail chain Clas Ohlson. Meanwhile, Husqvarna, a Swedish company, will host a capital markets day. The week's macroeconomic news begins with China's Consumer Price Index (CPI) and Producer Price Index (PPI) figures for November. Statistics Sweden will present household consumption and industrial orders figures for October. In addition to the Fed interest rate announcement, labor cost data for Q3 and wholesale inventory data for October will be released in the US, alongside weekly oil inventory statistics from the Department of Energy.
On Thursday, December 11, major US companies Broadcom and Costco Wholesale are expected to publish their interim reports. Meanwhile, Swedish window manufacturer Inwido is also organising a capital markets day. Statistics Sweden will publish the November CPI. Monthly oil market reports will also be released by the IEA and OPEC. The US will release its initial jobless claims figures.
On Friday, December 12, the Stockholm-listed companies Sectra and Svolder will report. In terms of macroeconomic data, Japan's October industrial production figureswill be released first. This will be followed by the November CPI figures for France, Spain, and Germany, as well as the UK's October Gross Domestic Product (GDP) and industrial production figures.
US 10-year Treasury yield, five-year weekly chart
Still room for a Santa rally, if interest rates do not get in the way
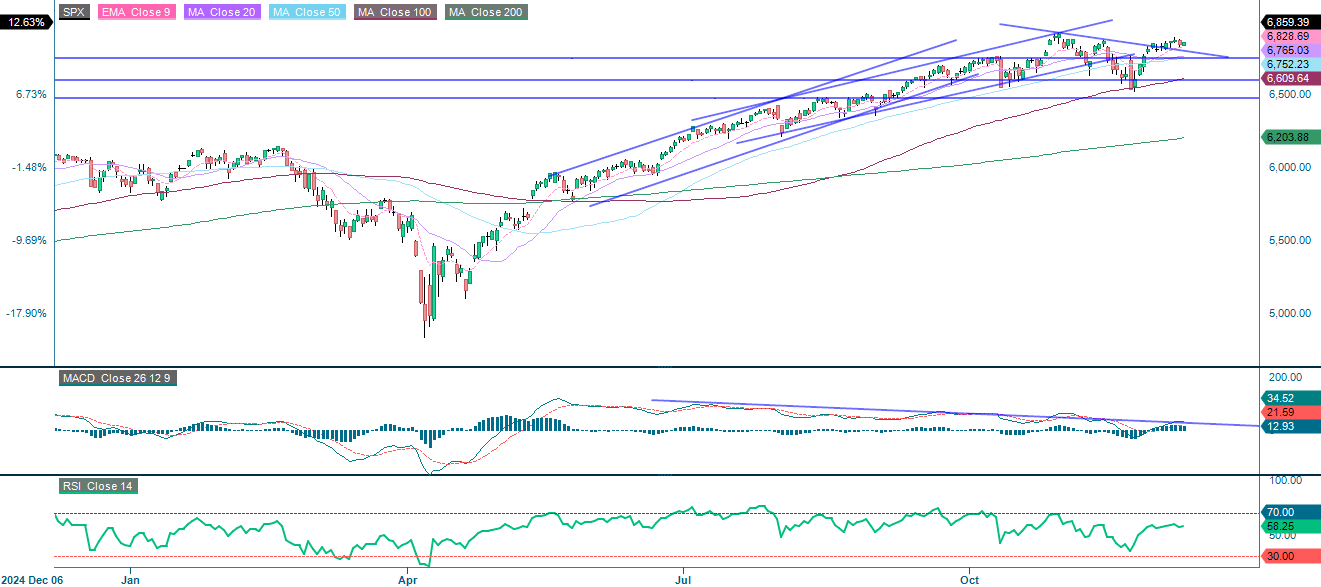
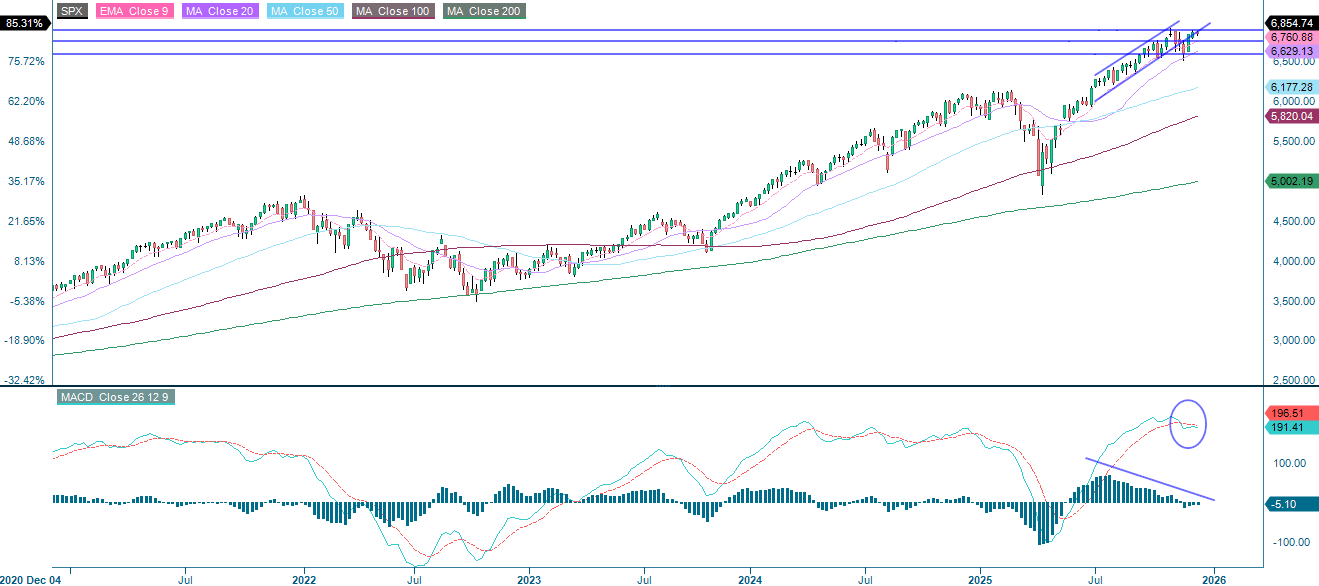
So far, this year the Santa Claus rally has been rather subdued. Nevertheless, the index remains above the rising 9-Day Exponential Moving Average (EMA9) and 20-Day Moving Average (MA20). Breaking above 6,890 could generate some excitement as Christmas approaches. Conversely, momentum has softened in recent days. Initial support is around 6,765, followed by the 100-Day Moving Average (MA100), which is currently at 6,610.
Related Products
S&P 500 (in USD), one-year daily chart
S&P 500 (in USD), five-year weekly chart
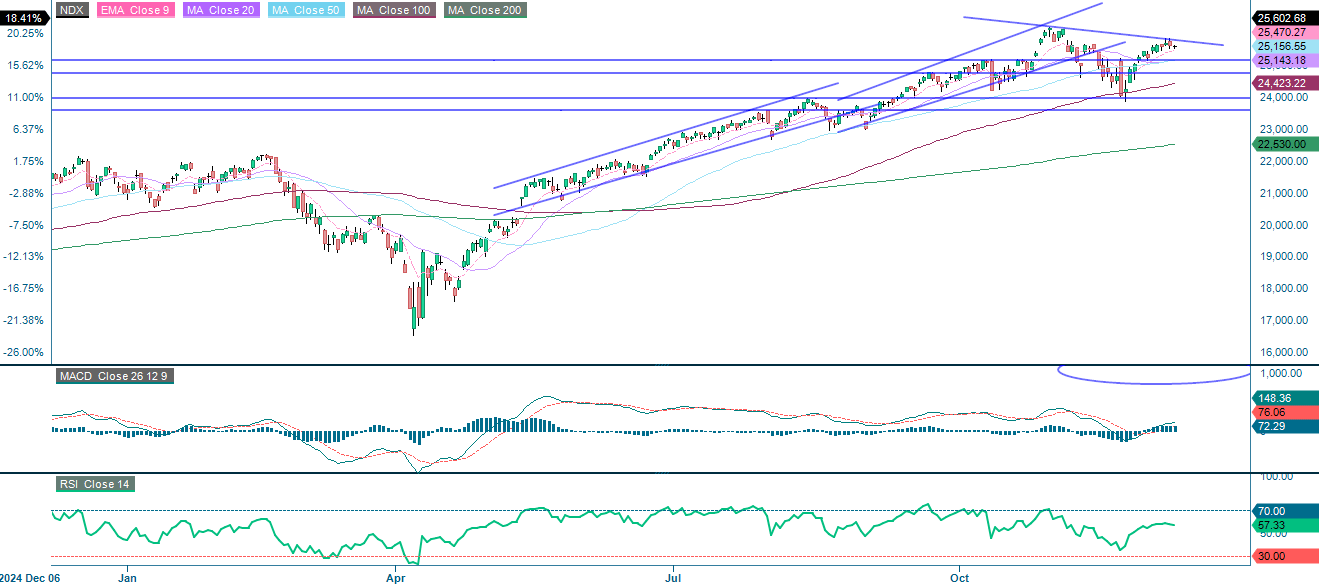
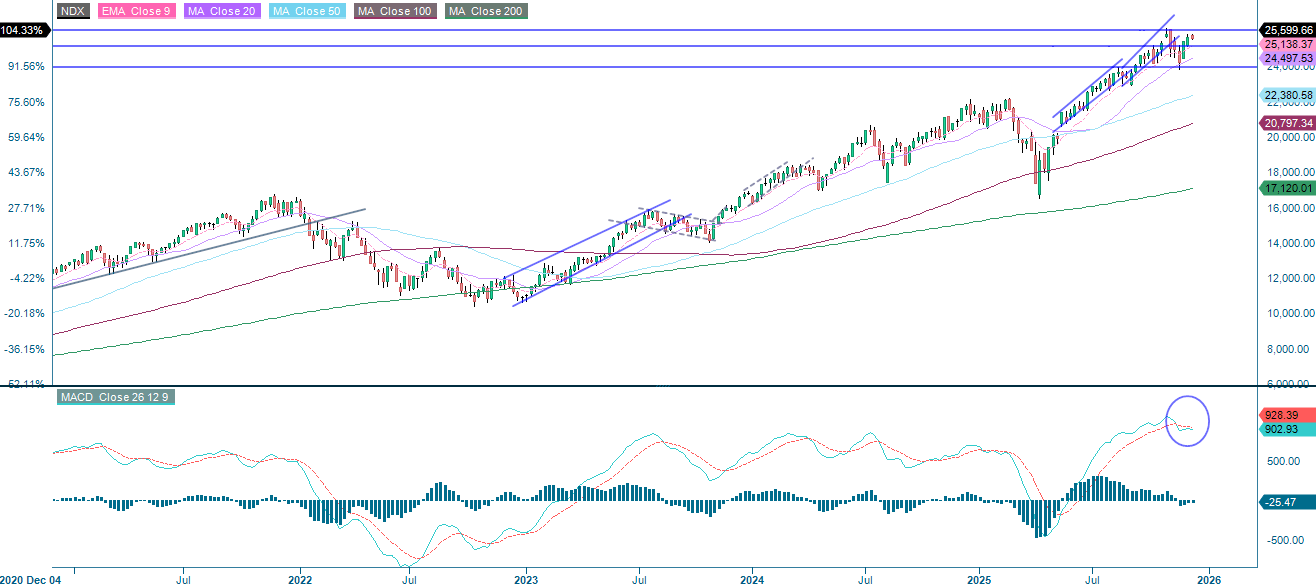
The NASDAQ-100 is displaying a similar trading pattern, with the index remaining above the rising 9-Day Exponential Moving Average (EMA9) and 20-Day Moving Average (MA20). Breaking above 26,120 would make new highs more likely in the lead-up to Christmas. However, it is important to monitor interest rates, which are trending upwards. Initial support is provided by the 20-Day Moving Average (MA20), which is currently at 25,143, followed by the 100-Day Moving Average (MA100), which is at 24,423.
Related Products
NASDAQ-100 (in USD), one-year daily chart
NASDAQ-100 (in USD), five-year weekly chart
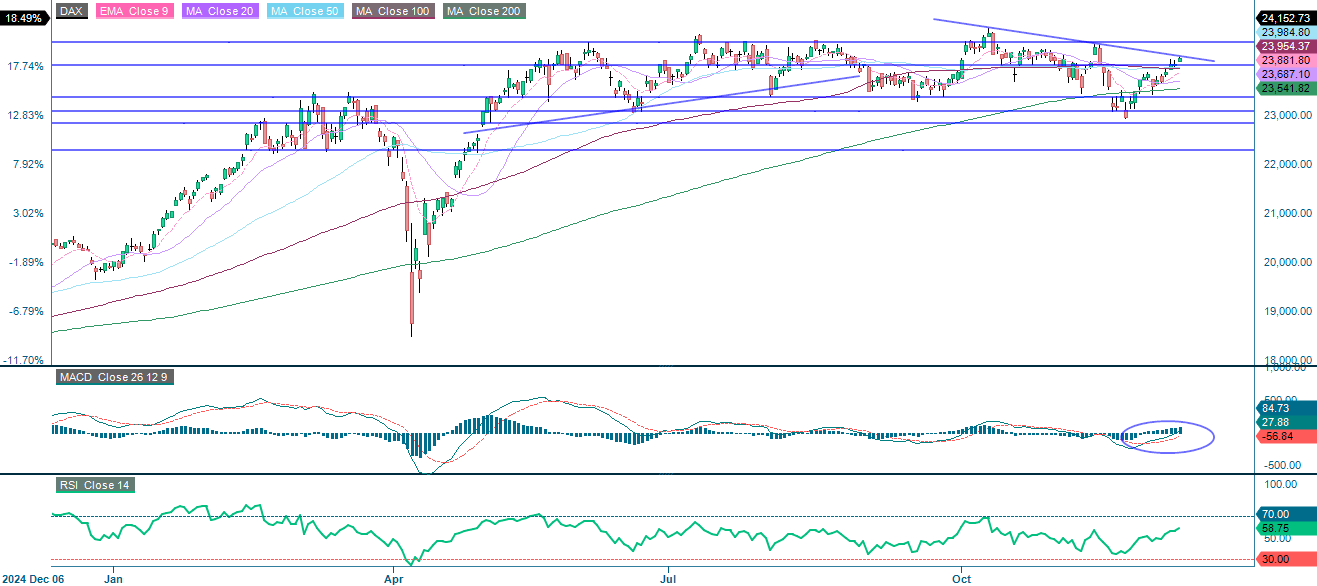
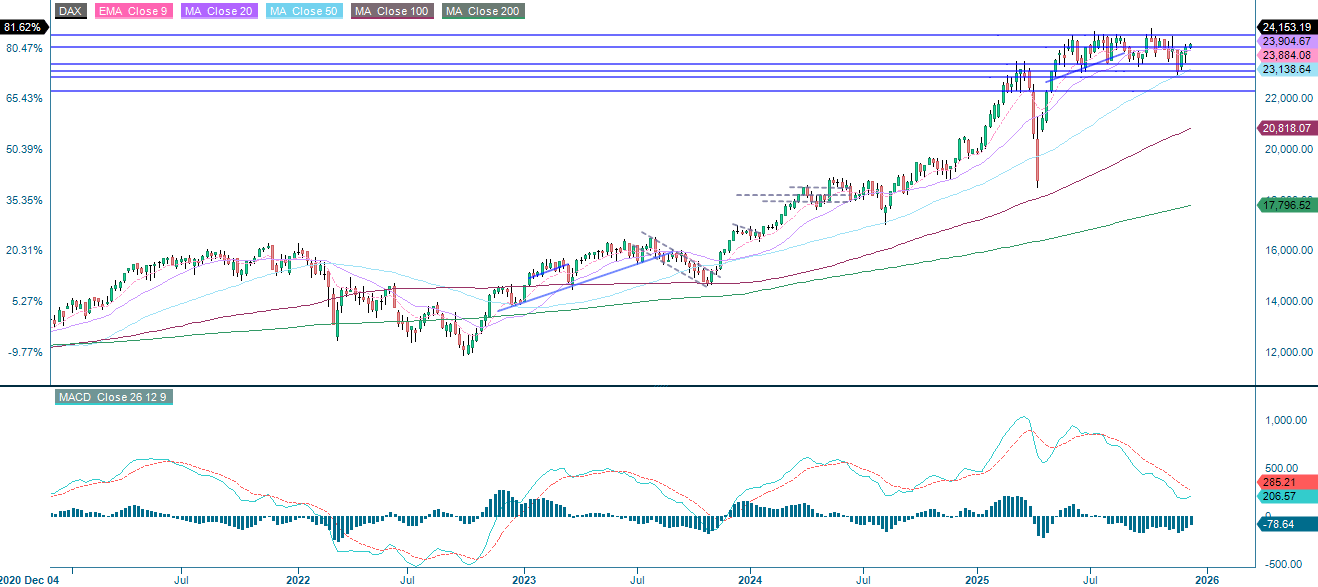
The German DAX is showing strong momentum. The Moving Average Convergence Divergence (MACD) has generated a buy signal, and the index appears to be approaching 24,485. However, if it fails to break above the descending trendline, support will be provided by the 100-Day Moving Average (MA100) and the 20-Day Moving Average (MA20), which are currently at 23,954 and 23,883 respectively.
Related Products
DAX (in EUR), one-year daily chart
DAX (in EUR), five-year weekly chart
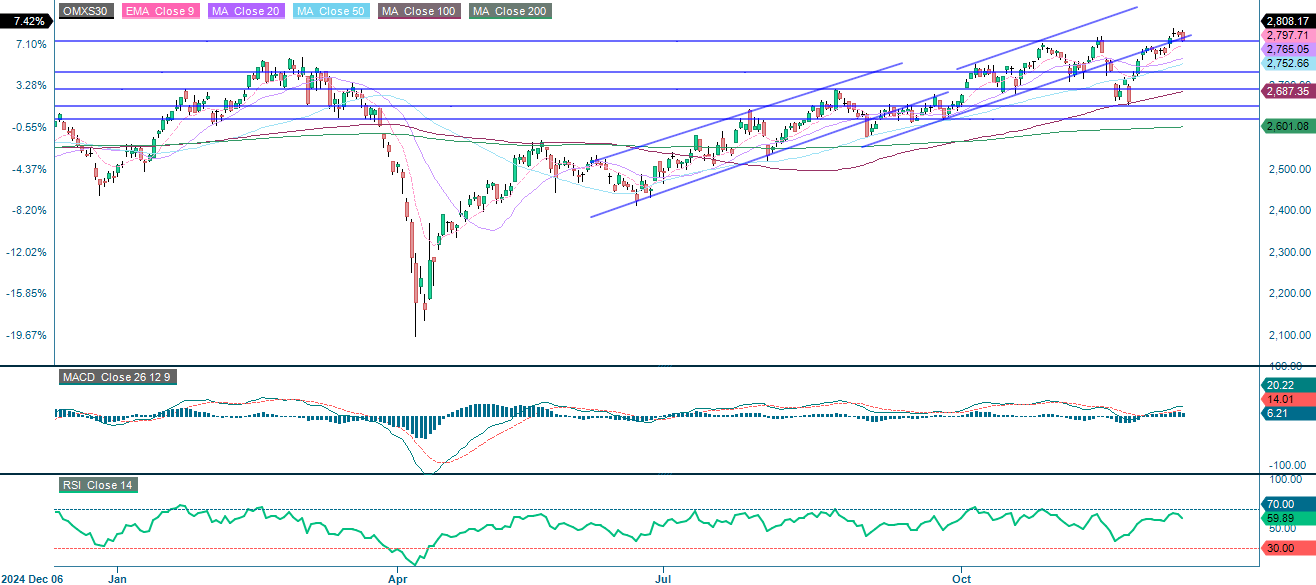
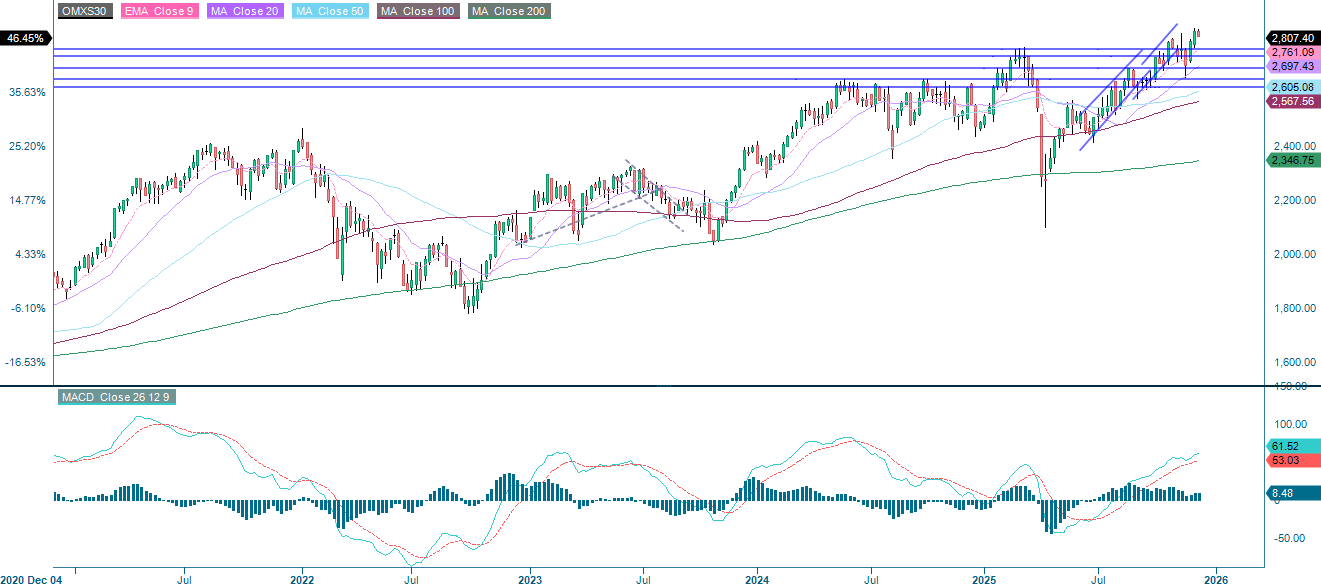
The Swedish OMXS30 recently reached a new high, and with a little help from Santa, it may reach even greater heights in the run-up to Christmas. However, keep an eye on US interest rates, which could bring an end to the party.
OMX30 (in SEK), one-year daily chart
OMX30 (in SEK), five-year weekly chart
The full name for abbreviations used in the previous text:
EMA 9: 9-Day Exponential Moving Average
Fibonacci: There are several Fibonacci lines used in technical analysis. Fibonacci numbers are a sequence in which each successive number is the sum of the two previous numbers.
MA20: 20-Day Moving Average
MA50: 50-Day Moving Average
MA100: 100-Day Moving Average
MA200: 200-Day Moving Average
MACD: Moving Average Convergence Divergence
Risks
Credit risk of the issuer:
Investors in the products are exposed to the risk that the Issuer or the Guarantor may not be able to meet its obligations under the products. A total loss of the invested capital is possible. The products are not subject to any deposit protection.
Currency risk:
If the product currency differs from the currency of the underlying asset, the value of a product will also depend on the exchange rate between the respective currencies. As a result, the value of a product can fluctuate significantly.
Market risk:
The value of the products can fall significantly below the purchase price due to changes in market factors, especially if the value of the underlying asset falls. The products are not capital-protected
Product costs:
Product and possible financing costs reduce the value of the products.
Risk with leverage products:
Due to the leverage effect, there is an increased risk of loss (risk of total loss) with leverage products, e.g. Bull & Bear Certificates, Warrants and Mini Futures.
External author:
This information is in the sole responsibility of the guest author and does not necessarily represent the opinion of Bank Vontobel Europe AG or any other company of the Vontobel Group. The further development of the index or a company as well as its share price depends on a large number of company-, group- and sector-specific as well as economic factors. When forming his investment decision, each investor must take into account the risk of price losses. Please note that investing in these products will not generate ongoing income.
The products are not capital protected, in the worst case a total loss of the invested capital is possible. In the event of insolvency of the issuer and the guarantor, the investor bears the risk of a total loss of his investment. In any case, investors should note that past performance and / or analysts' opinions are no adequate indicator of future performance. The performance of the underlyings depends on a variety of economic, entrepreneurial and political factors that should be taken into account in the formation of a market expectation.
Disclaimer:
This information is neither an investment advice nor an investment or investment strategy recommendation, but advertisement. The complete information on the products (securities) mentioned herein, in particular the structure and risks associated with an investment, are described in the base prospectus, together with any supplements, as well as the final terms relating to the securities. The base prospectus and final terms constitute the solely binding sales documents for the products mentioned herein. It is recommended that potential investors read these documents before making any investment decision. The documents and the key information document are published on the website of the issuer, Vontobel Financial Products GmbH, Bockenheimer Landstrasse 24, 60323 Frankfurt am Main, Germany, on https://prospectus.vontobel.com and are available from the issuer free of charge. The approval of the prospectus should not be understood as an endorsement of the securities. The securities are products that are not simple and may be difficult to understand. This information includes or relates to figures of past performance. Past performance is not a reliable indicator of future performance. This information may only be distributed or published in countries where such distribution or publication is permitted by applicable law. As stated in the relevant base prospectus, the distribution of the securities mentioned in this information is subject to restrictions in certain jurisdictions. This advertisement may not be reproduced or redistributed without prior permission by Vontobel.
© Bank Vontobel Europe AG and / or affiliated companies. All rights reserved.