S&P500 is up on hopes for lower interest rates

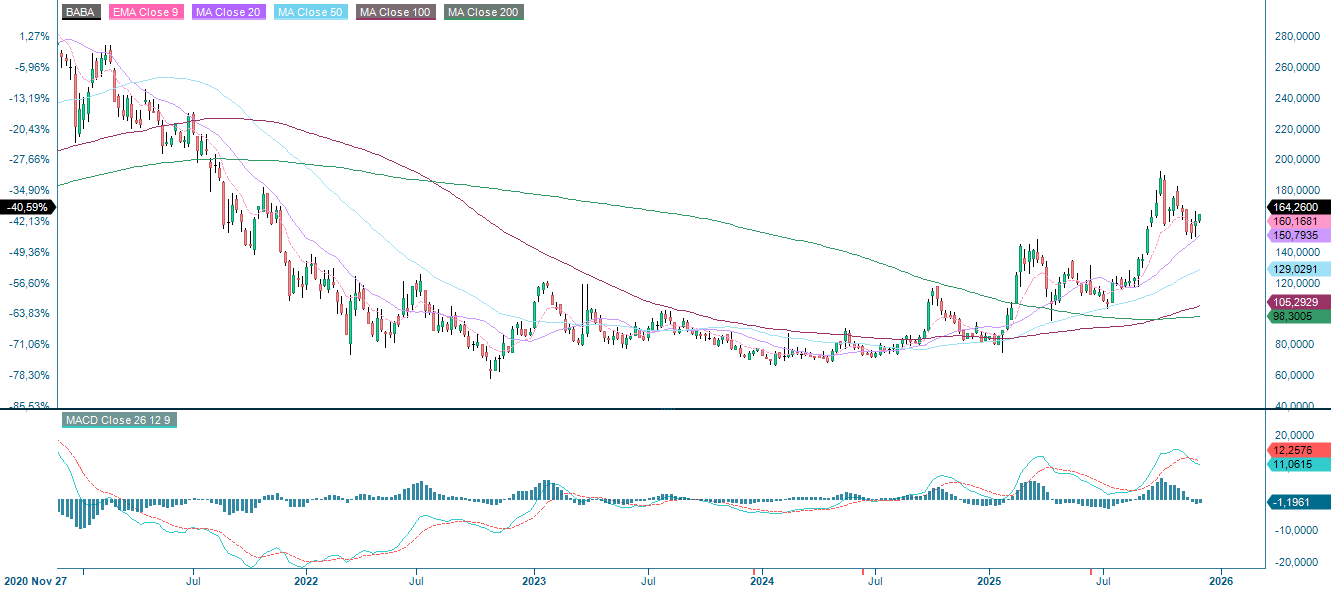
Alibaba's share price appears to be recovering from its previous low valuation. The company's growth is currently being driven by the expansion of the Chinese e-commerce market. However, we are more skeptical about the company's long-term prospects. Momentum has now turned positive on US stock markets, which were waiting and-see as recently as Monday December 1. This is due to expectations that the Federal Reserve will cut its key interest rate next week.
Case of the week: Short-term opportunities in Alibaba
Over the last several quarters, the bullish outlook for Alibaba Group Holding Limited (hereafter referred to as “Alibaba” or “the Company”) has emphasised the importance of the Alibaba International Digital Commerce Group (AIDC) as a driver of the Company’s long-term prospects, particularly given the lagging performance of its core domestic e-commerce business.
That narrative has shifted. AIDC, which had previously been growing faster than the rest of Alibaba, recorded year-over-year growth of only 10% in the most recent quarter. By comparison, the company's total revenue increased by 15%, while its China eCommerce division saw a 16% rise.
Meanwhile, Alibaba’s stock has slowly recovered after years of poor performance, though it remains over 35% below its 2020 peak. As the stock recovers, Alibaba’s valuation is moving more in line with that of major US tech companies, with the stock currently trading at around 23 times forward earnings.
At first glance, Alibaba’s operations appear to be performing well. The standout performer has been the Cloud Intelligence Group, which achieved 34% year-over-year growth, outpacing many cloud-centric companies in the United States. For context, Amazon’s AWS is currently expanding at around 20% annually, albeit from a much larger base.
This performance appears to be largely driven primarily by the increasing demand for AI-related cloud services within China. While this domestic strength is encouraging, it also highlights an underlying vulnerability for the company.
Recently, it was noted that Alibaba was losing ground to both US-based cloud providers and domestic competitors such as JD.com, Inc. (JD). However, this concern appears to have eased for the time being, as the company seems to have stabilised its domestic e-commerce operations. Given this improvement, Alibaba is looking increasingly attractive as a short-term investment, though perhaps not as a long-term holding, assuming the valuation becomes more reasonable and the current e-commerce momentum persists for several more quarters.
While some may object to labelling Alibaba an 'AI laggard', the company is clearly not among the global AI leaders, despite strong domestic demand. Management noted that even Alibaba’s older Nvidia GPUs are running at full capacity — an indirect reminder that Chinese firms remain cut off from the best U.S. chips.
This limitation has forced Alibaba and other Chinese companies to develop their own chips and focus on 'efficient' AI models out of necessity, rather than as part of a strategic plan. This puts them in a difficult position in a world racing to build ever more powerful data centers.
China’s broader decline in high-performance computing highlights this issue: its top system, which was once ranked first globally, is now much lower down the list. While Alibaba will benefit from China’s demand for AI, the company is unlikely to compete effectively on the global AI stage.
For more than a decade, Chinese companies, including Alibaba, have traded at heavily discounted valuations , resulting in significant losses for long-term shareholders. This pattern could change if geopolitical tensions ease, particularly if relations between the US and China improve or China moves towards greater economic openness. In such a scenario, Alibaba, being one of the country's most prominent technology firms, would likely benefit greatly in such a scenario.
Political developments therefore remain the main risk for investors who choose not to hold Alibaba shares. A more globally integrated China could generate significant value for the company. Beyond geopolitics, there is also the risk of continued short- and medium-term underperformance. Despite years of scepticism from some market participants, renewed enthusiasm for the stock in 2024 led Alibaba to outperform the NASDAQ-100. While the company may still face long-term structural challenges, its ability to generate short-term trading opportunities should not be underestimated.
Alibaba (USD), one-year daily chart

Alibaba (USD), five-year weekly chart
Macro comments
On Monday, December 1, US stock markets traded lower ahead of the week's macroeconomic data releases and the Federal Reserve's interest rate decision on December 10. However, on Tuesday December 2, investors changed their minds and began anticipating rate cuts from the Fed next week.
On Wednesday, December 3, Inditex (H&M's peer) and US company Salesforce will report their quarterly results. Volvo Cars will announce its November sales figures . Meanwhile, housing developer JM is organizing capital markets day. Wednesday's macro agenda is dominated by November's services Purchasing Manager Indices from Japan, China, India, Russia, Sweden, Spain, Italy, France, Germany, the Eurozone, the UK and the US. We will also receive the producer price index for October from the Eurozone. Alongside the services PMI, other statistics will be released from the US, including the ADP private employment report for November, import prices for September and the Department of Energy’s weekly oil inventory report.
On Thursday, December 4, Electrolux will host a Capital Markets Day. Statistics Sweden will release the November Consumer Price Index (CPI) figures. Retail sales figures for November are expected from the Eurozone. The US will publish Challenger unemployment statistics and weekly initial jobless claims data for November.
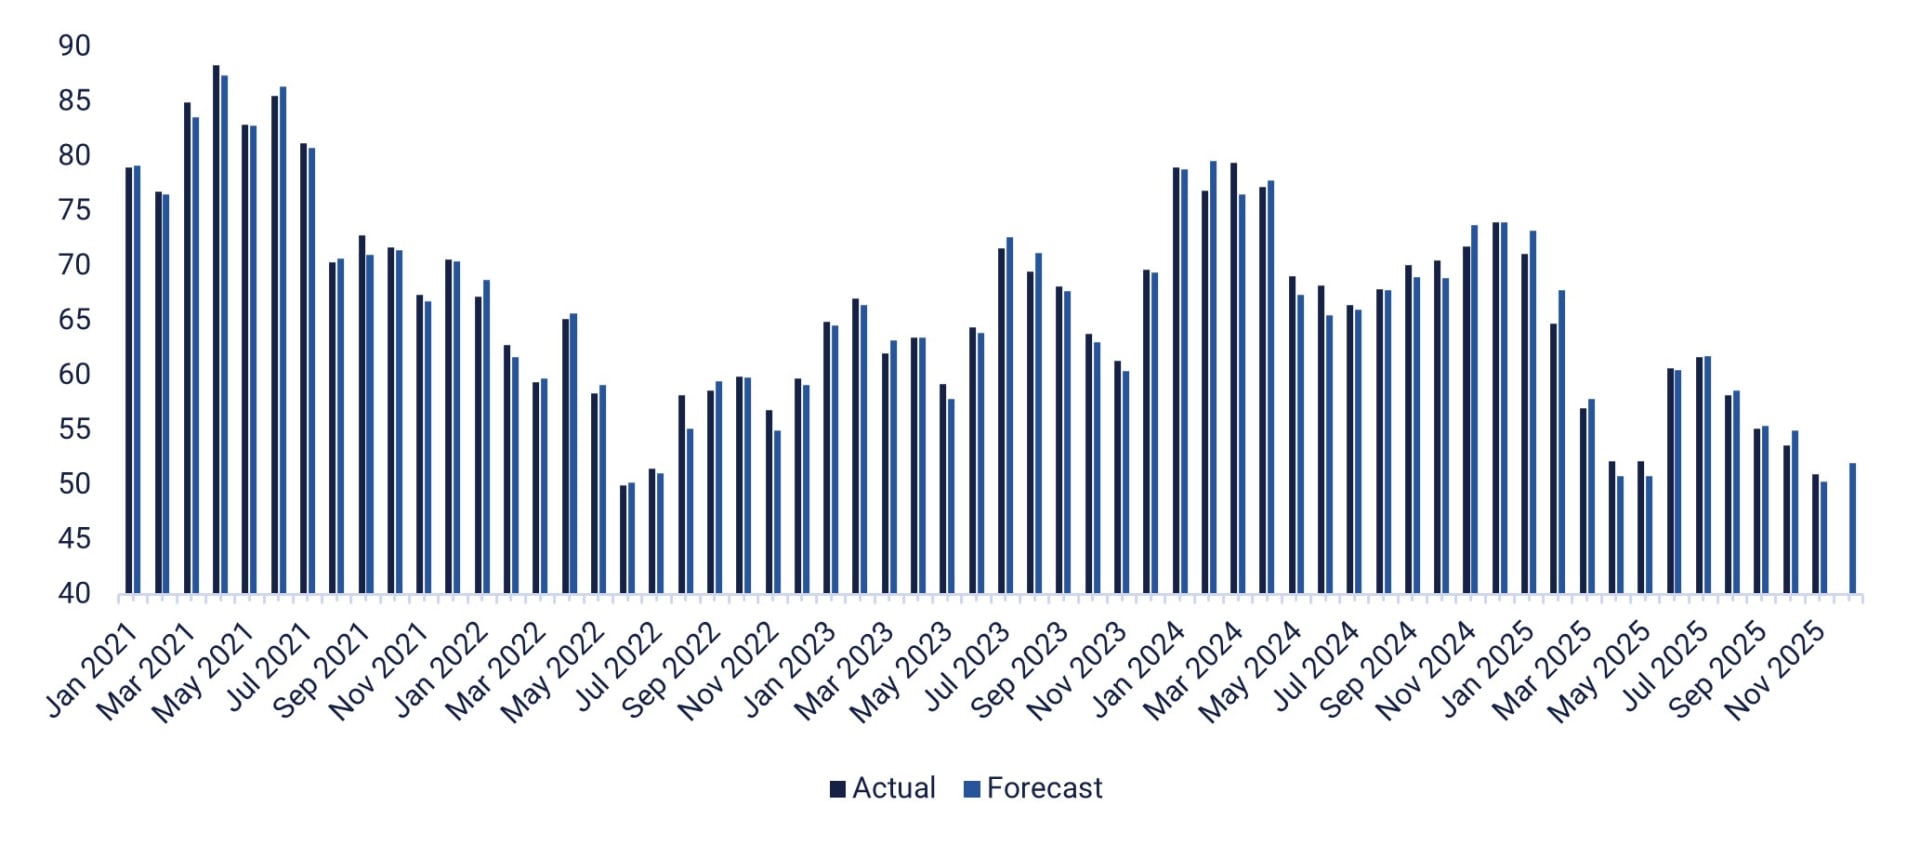
On Friday December 5, the Swedish mining company Boliden will release its 2026 guidance. The day's macroeconomic news begins with South Korea's October trade balance, followed by India's interest rate announcement. Next, Germany will present its industrial orders and France its industrial production, both for October. From the Eurozone, we expect to see employment statistics for Q3 and Gross Domestic Product (GDP) for the third quarter. The US will release September's data on personal consumption and inflation (PCE), as well as the Michigan Consumer Sentiment Index for December (see graph below).
US Michigan Consumer Sentiment, five-year monthly graph
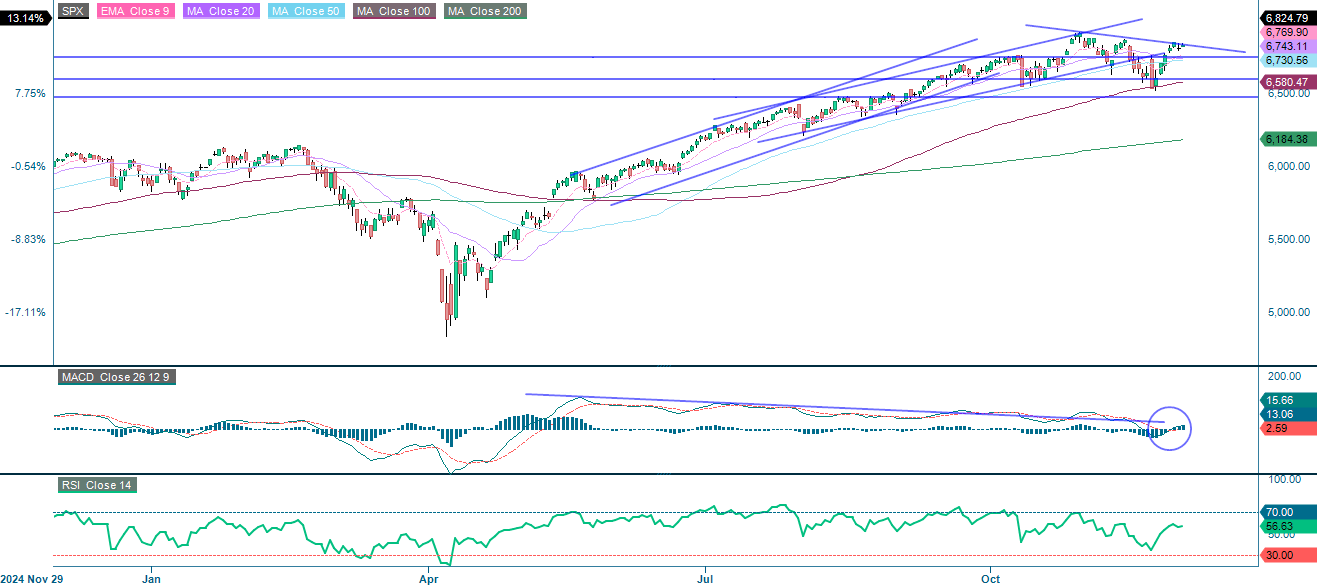
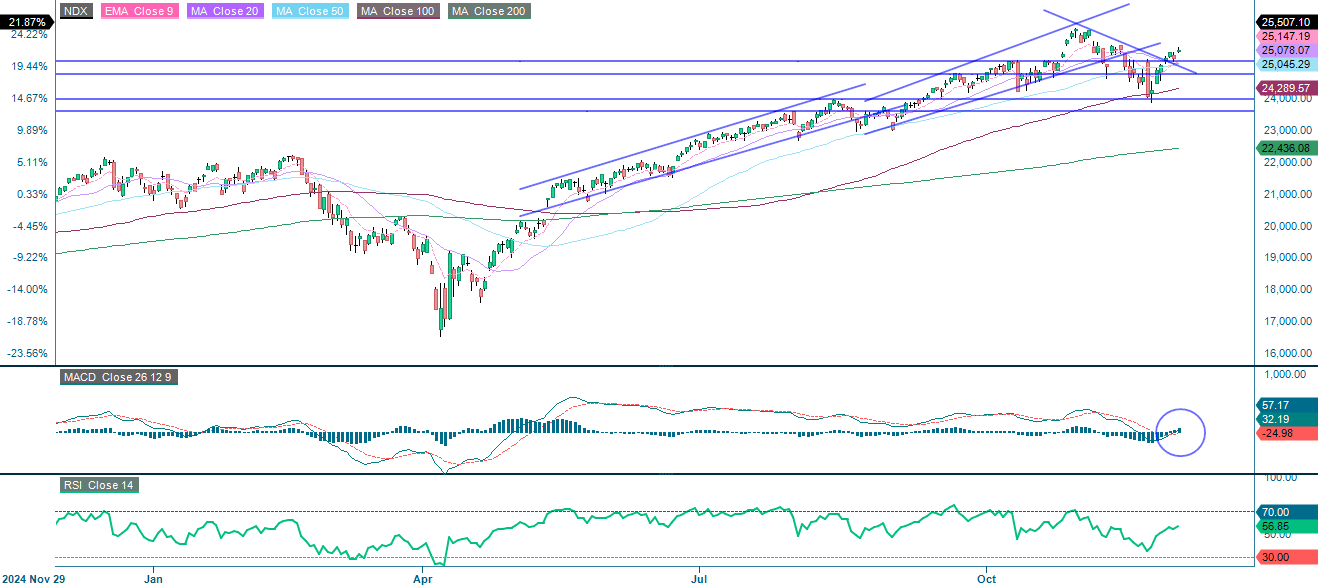
The momentum has turned positive again
US equities have performed strongly over the past few days, primarily due to rising expectations of a Federal Reserve interest rate cut on December 10. The technology sector has been a key contributor to this growth. Momentum has once again turned positive for the S&P 500. The 'buy the rumour, sell the news' strategy may be appropriate here, and December is usually a strong month. The short-term outlook is bullish.
S&P 500 (in USD), one-year daily chart
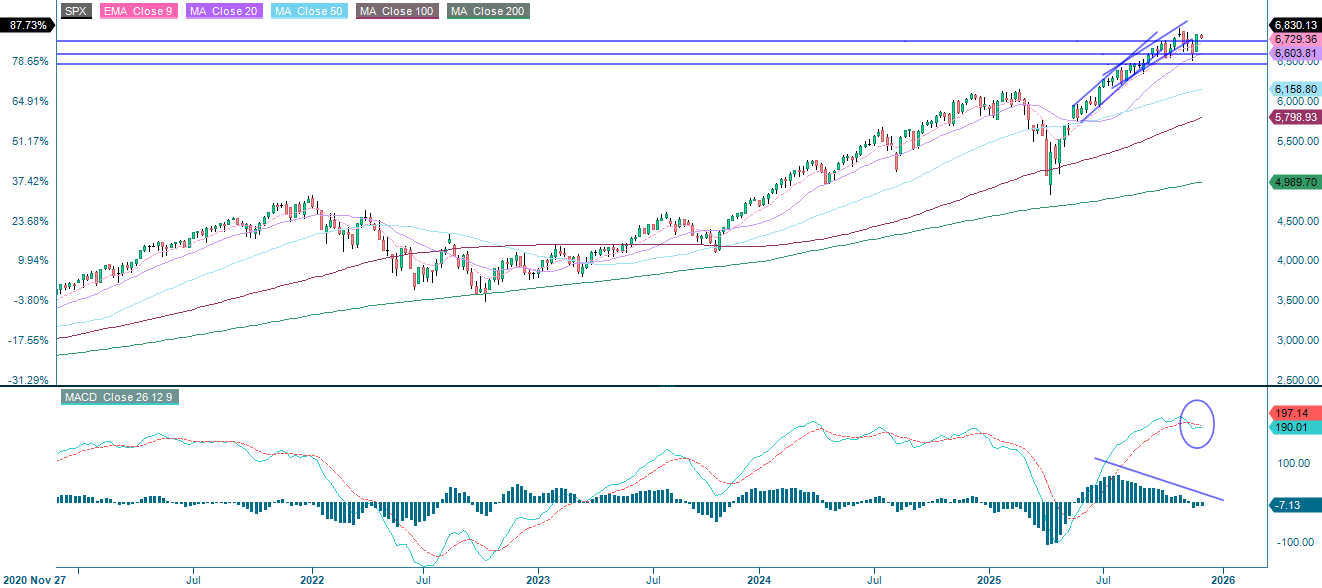
S&P 500 (in USD), weekly five-year chart
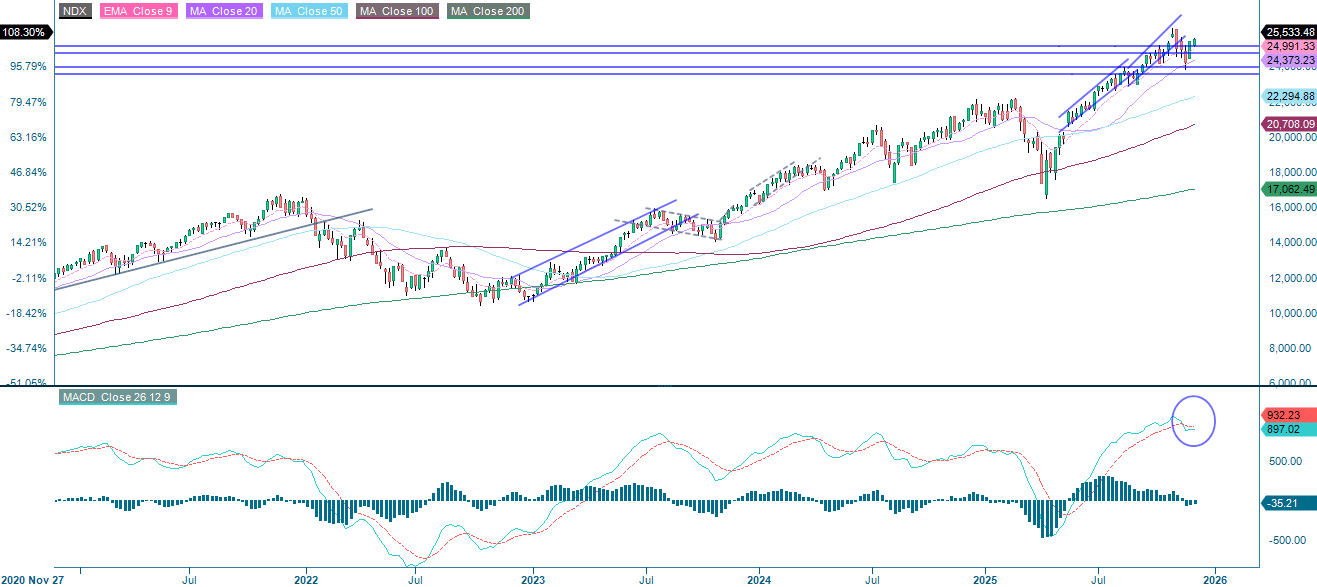
The short-term outlook for the NASDAQ-100 is positive. Momentum has turned positive, with the index trading above both the 20-Day Moving Average (MA20) and the 9-Day Exponential Moving Average (EMA9). A break above 25,620 appears likely, with levels around 26,100 potentially next.
Related Products
NASDAQ-100 (in USD), one-year daily chart
NASDAQ-100 (in USD), weekly five-year chart
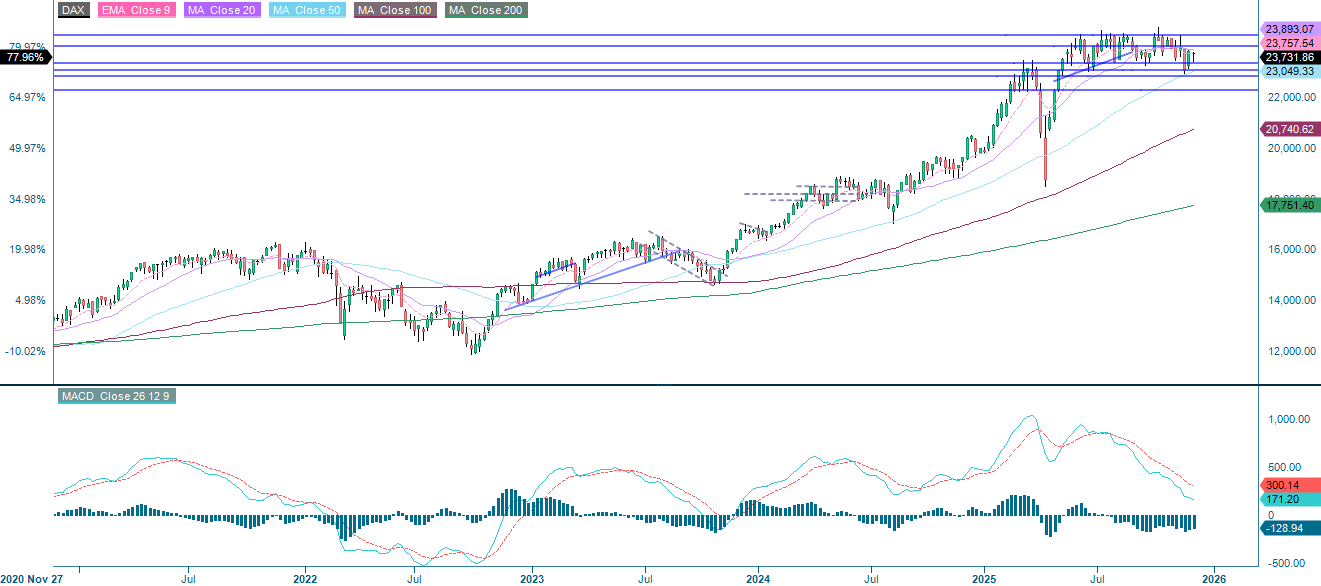
The German DAX may require external impetus, as the index is struggling to establish itself above the 20-day moving average (MA20). Although momentum remains negative, note that the Moving Average Convergence Divergence (MACD) has generated a soft buy signal. Resistance is located between 23,670 and 24,000. Breaking through this level could pave the way for a move towards levels around 24,480.
Related Products
DAX (in EUR), one-year daily chart
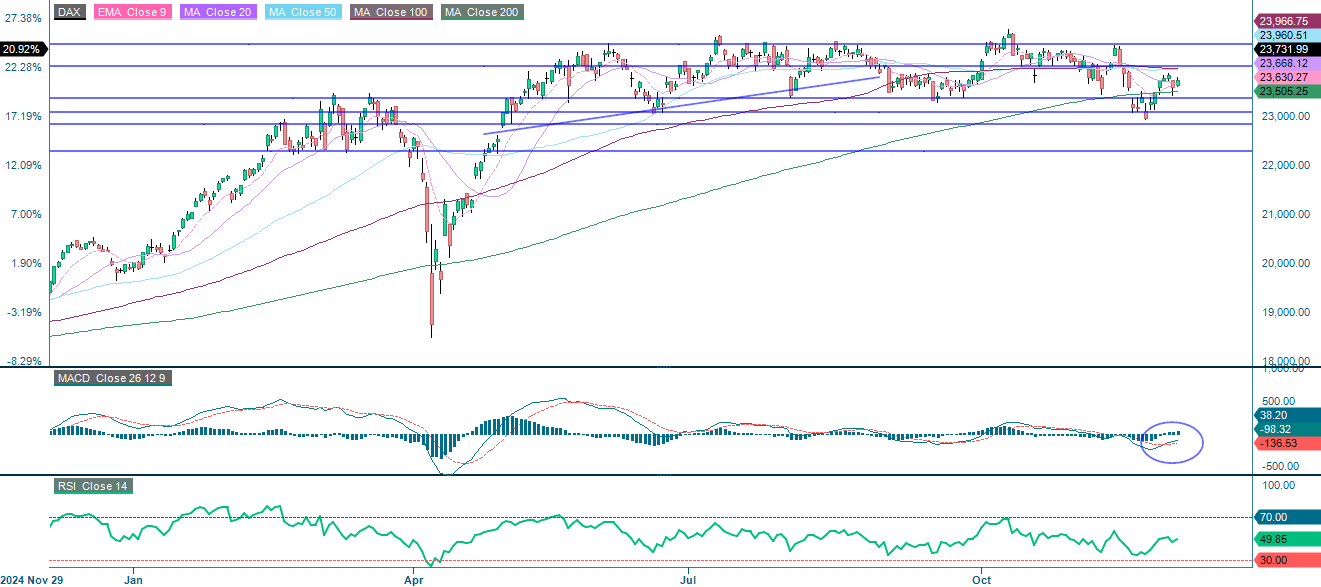
DAX (in EUR), weekly five-year chart
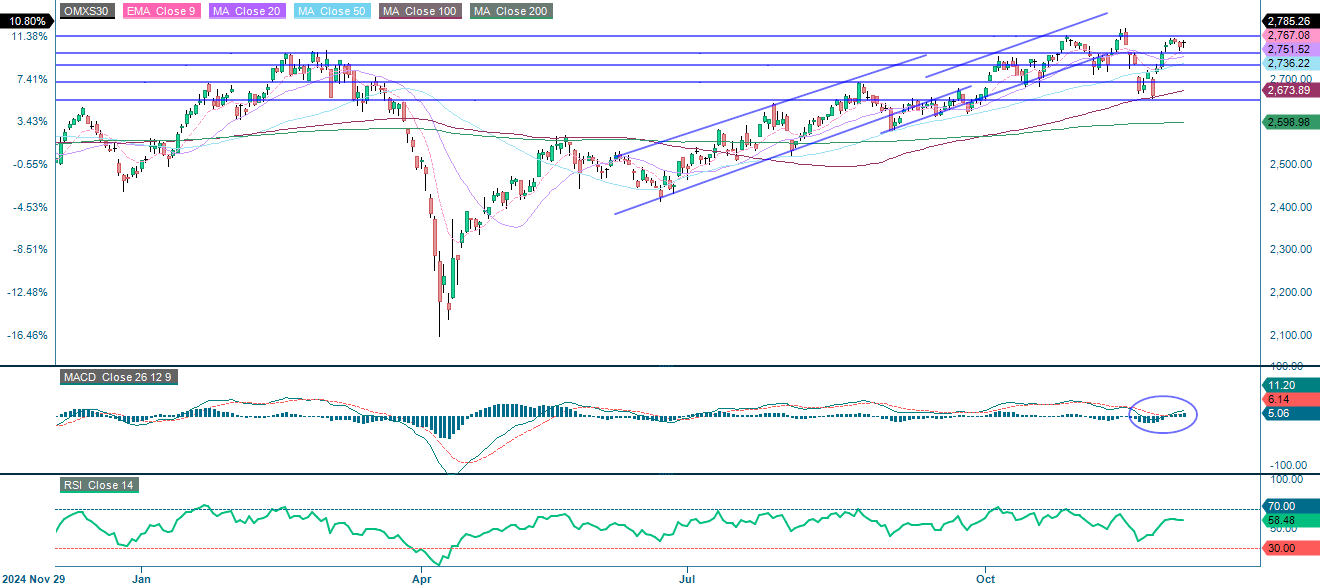
Compared to the DAX, the Swedish OMXS30 looks healthier. The index is trading above its upward-sloping 9-Day Exponential Moving Average (EMA9) and 20-Day Moving Average (MA20), and the Moving Average Convergence Divergence (MACD) is also signalling positive momentum. Key resistance is in the 2,800–2,820 area.
OMX30 (in SEK), one-year daily chart
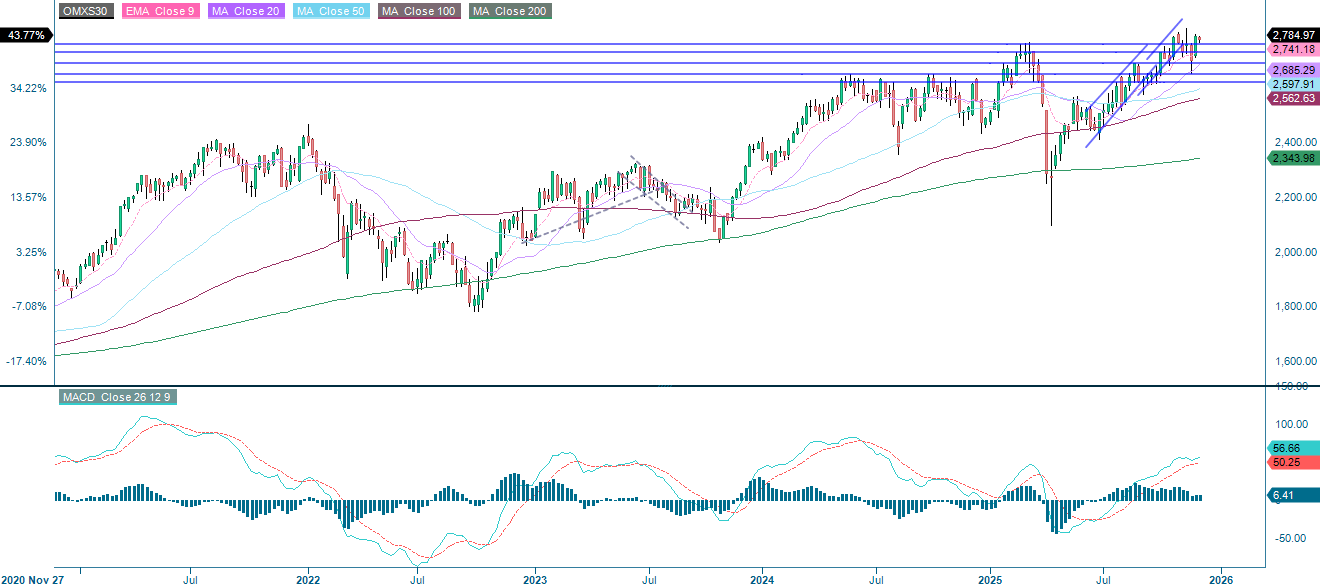
OMX30 (in SEK), weekly five-year chart
The full name for abbreviations used in the previous text:
EMA 9: 9-day exponential moving average
Fibonacci: There are several Fibonacci lines used in technical analysis. Fibonacci numbers are a sequence in which each successive number is the sum of the two previous numbers.
MA20: 20-day moving average
MA50: 50-day moving average
MA100: 100-day moving average
MA200: 200-day moving average
MACD: Moving average convergence divergence
Risks
Credit risk of the issuer:
Investors in the products are exposed to the risk that the Issuer or the Guarantor may not be able to meet its obligations under the products. A total loss of the invested capital is possible. The products are not subject to any deposit protection.
Currency risk:
If the product currency differs from the currency of the underlying asset, the value of a product will also depend on the exchange rate between the respective currencies. As a result, the value of a product can fluctuate significantly.
Market risk:
The value of the products can fall significantly below the purchase price due to changes in market factors, especially if the value of the underlying asset falls. The products are not capital-protected
Product costs:
Product and possible financing costs reduce the value of the products.
Risk with leverage products:
Due to the leverage effect, there is an increased risk of loss (risk of total loss) with leverage products, e.g. Bull & Bear Certificates, Warrants and Mini Futures.
External author:
This information is in the sole responsibility of the guest author and does not necessarily represent the opinion of Bank Vontobel Europe AG or any other company of the Vontobel Group. The further development of the index or a company as well as its share price depends on a large number of company-, group- and sector-specific as well as economic factors. When forming his investment decision, each investor must take into account the risk of price losses. Please note that investing in these products will not generate ongoing income.
The products are not capital protected, in the worst case a total loss of the invested capital is possible. In the event of insolvency of the issuer and the guarantor, the investor bears the risk of a total loss of his investment. In any case, investors should note that past performance and / or analysts' opinions are no adequate indicator of future performance. The performance of the underlyings depends on a variety of economic, entrepreneurial and political factors that should be taken into account in the formation of a market expectation.
Disclaimer:
This information is neither an investment advice nor an investment or investment strategy recommendation, but advertisement. The complete information on the products (securities) mentioned herein, in particular the structure and risks associated with an investment, are described in the base prospectus, together with any supplements, as well as the final terms relating to the securities. The base prospectus and final terms constitute the solely binding sales documents for the products mentioned herein. It is recommended that potential investors read these documents before making any investment decision. The documents and the key information document are published on the website of the issuer, Vontobel Financial Products GmbH, Bockenheimer Landstrasse 24, 60323 Frankfurt am Main, Germany, on https://prospectus.vontobel.com and are available from the issuer free of charge. The approval of the prospectus should not be understood as an endorsement of the securities. The securities are products that are not simple and may be difficult to understand. This information includes or relates to figures of past performance. Past performance is not a reliable indicator of future performance. This information may only be distributed or published in countries where such distribution or publication is permitted by applicable law. As stated in the relevant base prospectus, the distribution of the securities mentioned in this information is subject to restrictions in certain jurisdictions. This advertisement may not be reproduced or redistributed without prior permission by Vontobel.
© Bank Vontobel Europe AG and / or affiliated companies. All rights reserved.