Nvidia boosted the stock market

This week's case study focuses on the Volvo Group. Its share price has remained largely unchanged since early May but has recently begun to increase slightly. The Q3 2025 earnings report was better than expected. We now believe that the share price reflects a weaker outlook for sales in the North American truck market in 2026. Volvo’s US peer, Paccar, has also seen an improvement in its share price recently. Last week Nvidia’s interim report boosted the mood of the stock markets, as Nvidia's earnings and growth prospects were better than anticipated.
Case of the week: It's time for Volvo shares to choose a path
On 17 October, Volvo Group (“Volvo” or the “Company”) reported a stronger-than-expected Q3 2025 report, with operating profits coming in at around 2.5% above expectations. However, Volvo's Q3 2025 revenue was 0.8% lower than expected, reinforcing the idea that the company has improved its margins and profitability. With an operating margin of 10.6%, Volvo performed better than the expected 10.3%. This positive deviation is mainly due to the Construction Equipment segment, while the Trucks segment had a negative impact. Orders for heavy trucks fell by 14% compared to last year, reaching 37,000 units - 16% worse than expected.
In connection with the Q3 2025 report, Volvo lowered the estimate for heavy truck registrations in North America for 2025 by 10,000 units to 265,000 units. Volvo estimates 295,000 registrations in Europe and 250,000 in North America for 2026, which is slightly below market expectations. Lat week, the US Environmental Protection Agency's (EPA) announcement that it will maintain the NOX reduction requirements for heavy trucks in the 2027 model year was positive not only for Volvo, but also for its sector peers, such as Traton and Daimler Trucks. This could result in a price increase of 15,000–20,000 USD per truck, leading to increased demand for the 2026 model year in the short term. However, truck manufacturers' market estimates for 2026 do not consider these pre-emptive effects. This could result in market volume estimates for 2026 increasing by 5–10% in the coming quarter.
Another positive development for Volvo is the strengthening of the USD/SEK exchange rate from 9.42 on 30 September 2025 to 9.55 at the time of writing. Volvo is one of the few large Swedish companies that continues to benefit from a strong USD, in terms of both net exports and the currency translation of its operating profit. During Q3 of 2025, however, the Company’s profits decreased by around SEK 1.6 billion due to the weakening of the USD and strengthening of the SEK. This can be compared with a Q3 2025 pretax profit of around SEK 12.1 billion.
According to Capital IQ, Volvo shares are currently trading at a price-to-earnings ratio (P/E) of 14x the expected earnings over the next twelve months. This compares to a median P/E ratio of 16.7x for ten comparable engineering companies, including competitors such as Traton, the US-based company Paccar, and Daimler Truck.
Paccar (in USD), five-year weekly chart
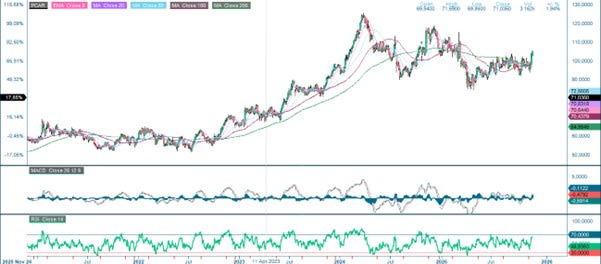
Paccar's stock appears to be in an upward trend. Since Volvo generates 48% of its group sales in Europe and 29% in North America, the Volvo share price could potentially follow a similar trend. This is particularly likely given that an upturn in demand for industrial products seems closer to happening in Europe than in North America. Additionally, the negative outlook for sales in the North American truck market in 2026 is already reflected in Volvo's share price. Furthermore, we believe that the odds of a cautious recovery are better following the EPA's decision and the weakening of the SEK against the USD.
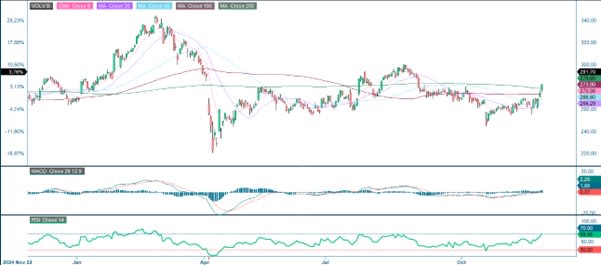
Volvo B (in SEK), one-year daily chart
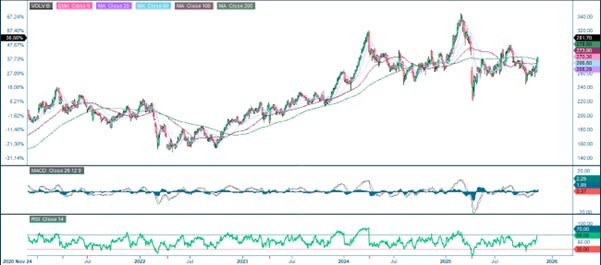
Volvo B (in SEK), five-year weekly chart
On Wednesday evening, November 19, Nvidia released an interim report that exceeded market expectations by 3%, in terms of both earnings and revenues. Nvidia's stock price rose by around 5% in US after-hours trading, lifting sector peers such as AMD and Micron Technology, which rose by 4%. The communications services sector also performed strongly on Monday, November 24, after Alphabet's share price rose by 6.3% following last week’s launch of its Gemini 3 AI model.
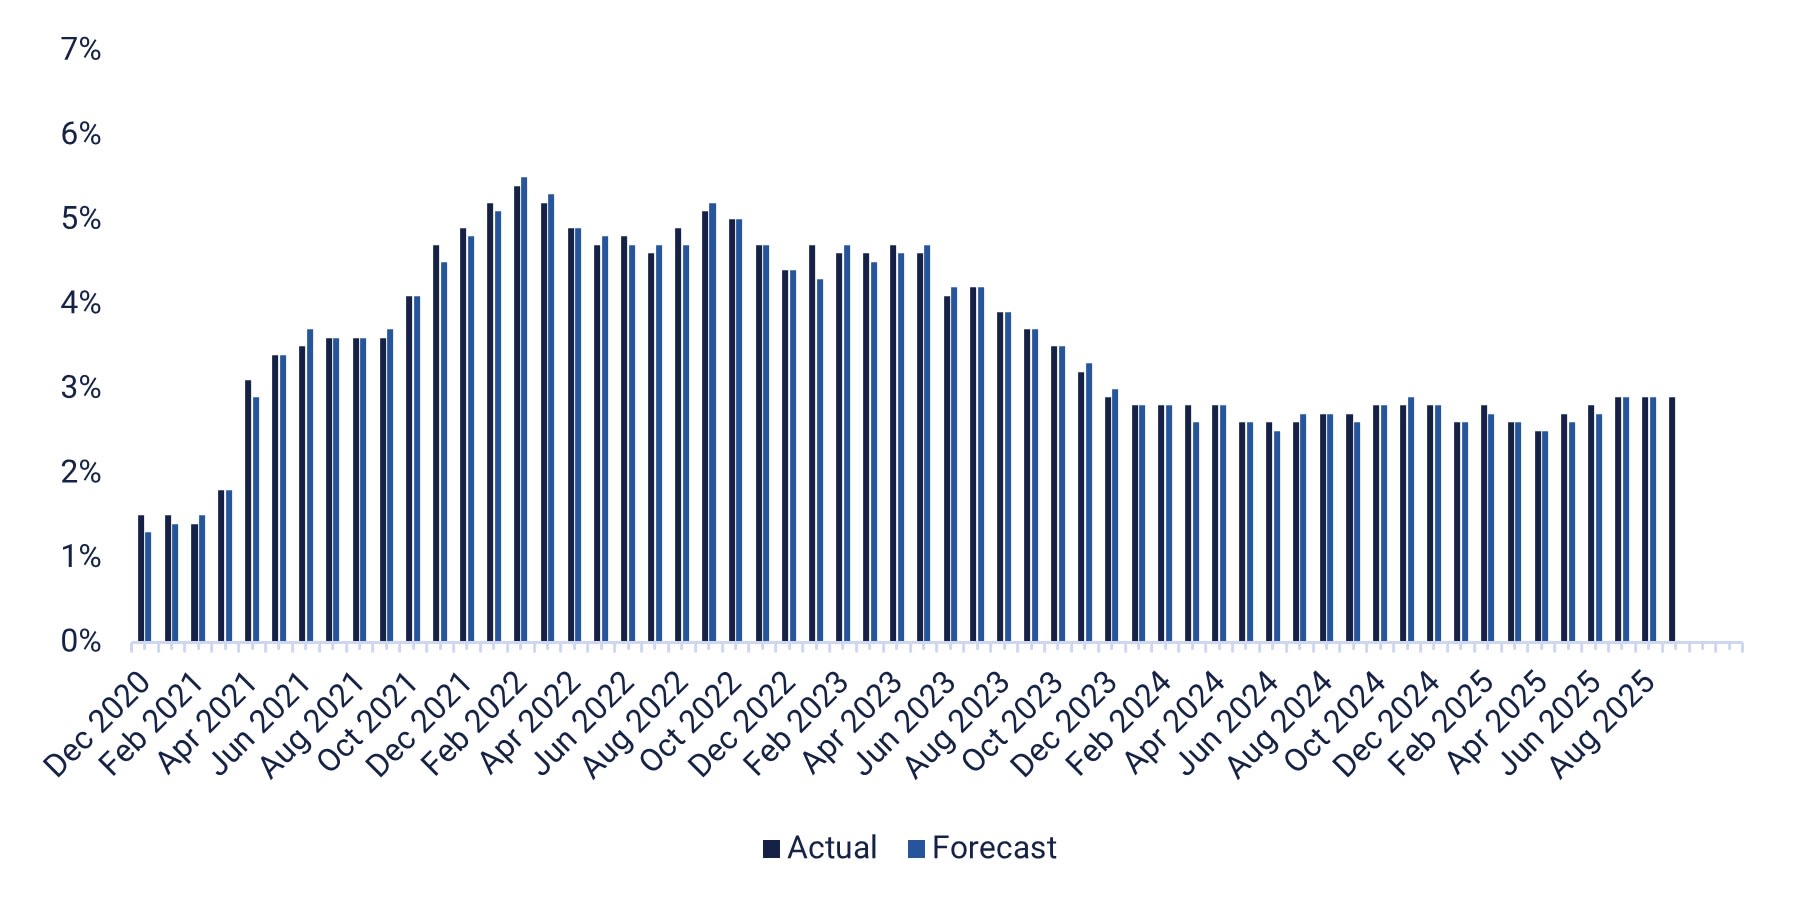
On Wednesday, November 26, the Swedish company Elekta, the Danish company Rockwool, and the American company Deere will report their quarterly results. Atlas Copco is organising a capital markets day. The day will be dominated by macro news flow in the US, with the release of durable goods orders and goods trade balance for October, weekly jobless claims, wholesale inventories for October, the Chicago purchasing managers' index for November, personal consumption and inflation (PCE), see graph below, and new home sales for October, as well as oil inventories (DOE) and weekly statistics.
On Thursday, November 27, Norsk Hydro will be hosting a Capital Markets Day. The day will begin with Chinese industrial company earnings for October. This will be followed by Sweden's trade balance and household lending figures for October, as well as a business survey from the Swedish NIESR. Germany will release its GfK consumer confidence index for December. There will also be a business survey from the Eurozone for November.
On Friday, November 28, the macro news feed starts with Japan's October unemployment, industrial production and retail sales figures. Next are Germany's October retail sales and import prices, followed by the November Consumer Price Index (CPI). We will also receive the CPI for November and the Gross Domestic Product (GDP) for Q3 from France and Italy, as well as the CPI for November from Spain. Finally, Canada's Q3 GDP figures will be released. Trading on the New York Stock Exchange will close at 19.00 CET on Friday due to the Thanksgiving holiday.
US Personal Consumption Expenditure (PCE) Price Index year-on-year, five-year monthly graph
Downside risks persist even as OMXS30 approaches its previous highs
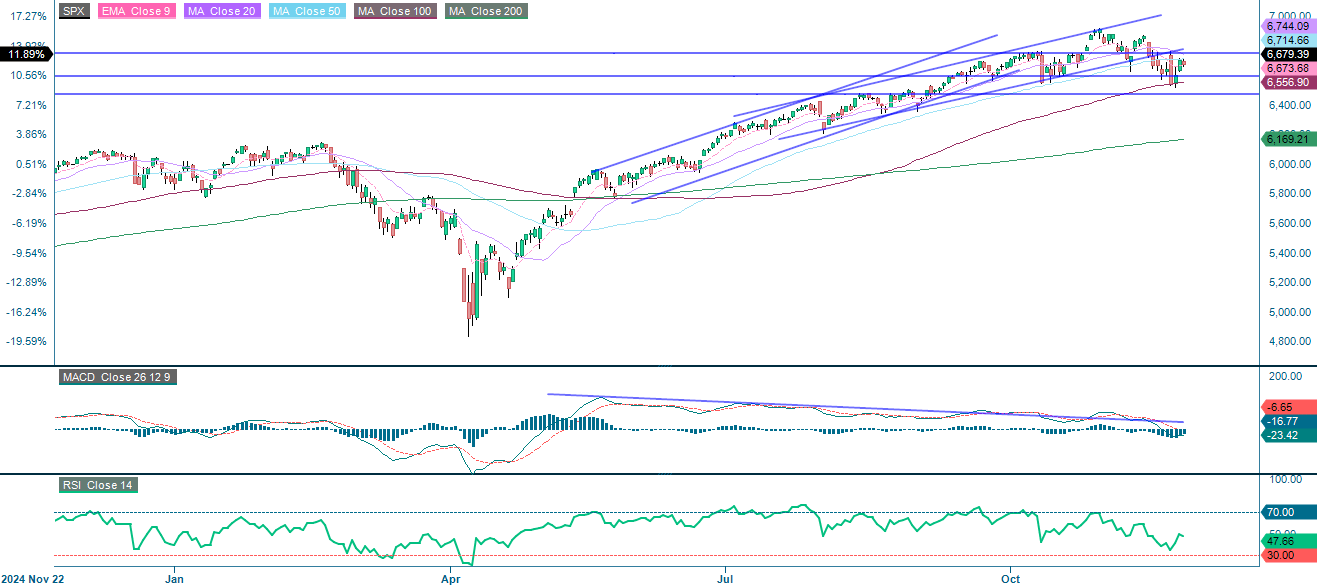
Although the S&P 500 has recovered some of its recent losses, the index remains under pressure as it continues to trade below the 20-Day Moving Average (MA20). A sustained break above this level would likely signal a change in the short-term trend from negative to positive. As indicated by the Moving Average Convergence Divergence (MACD), momentum remains negative. 100-Day Moving Average (MA100), which is currently around 6,557, is the first key support level, with further support around 6,470 and 6,300.
Related Products
S&P 500 (in USD), one-year daily chart
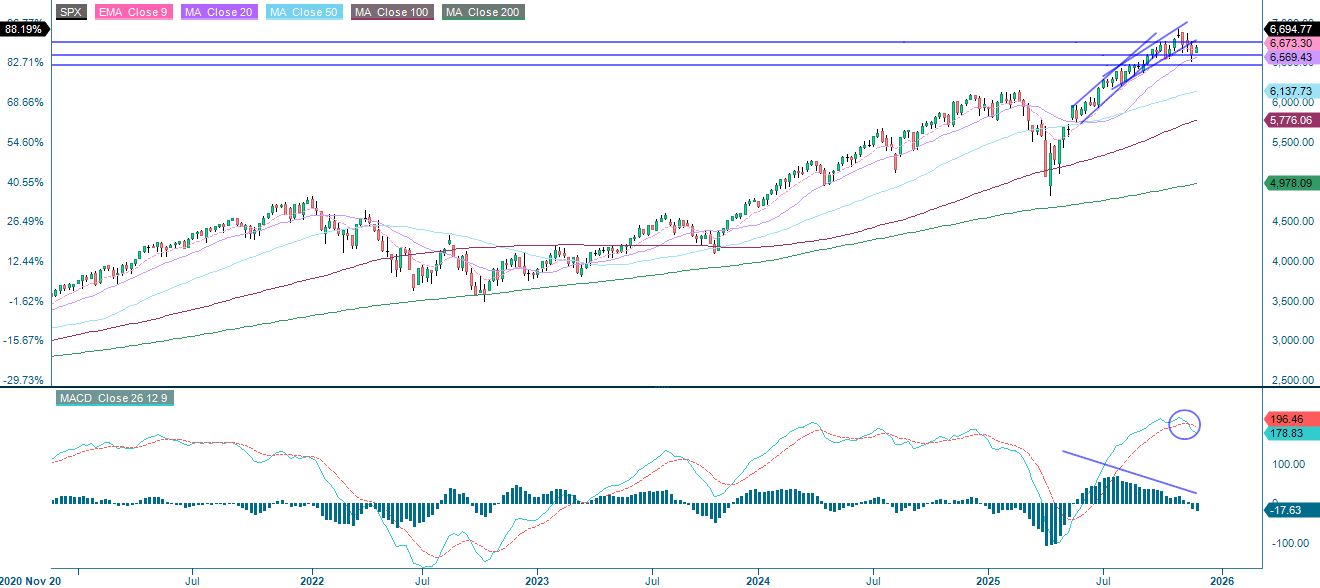
S&P 500 (in USD), weekly five-year chart
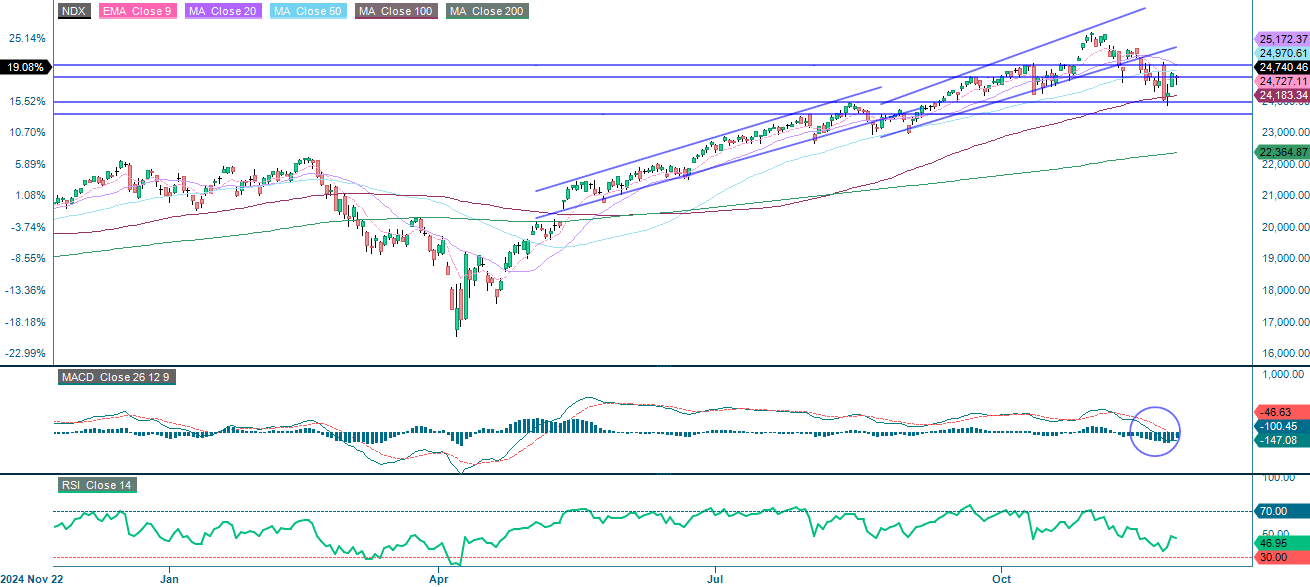
The NASDAQ-100 is also under pressure, with negative momentum and the index trading below the falling MA20, which is currently acting as resistance. Initial support is found between 23,960 and the 100-Day Moving Average (MA100), which is currently around 24,183. Further support is seen near 23,200.
Related Products
NASDAQ-100 (in USD), one-year daily chart
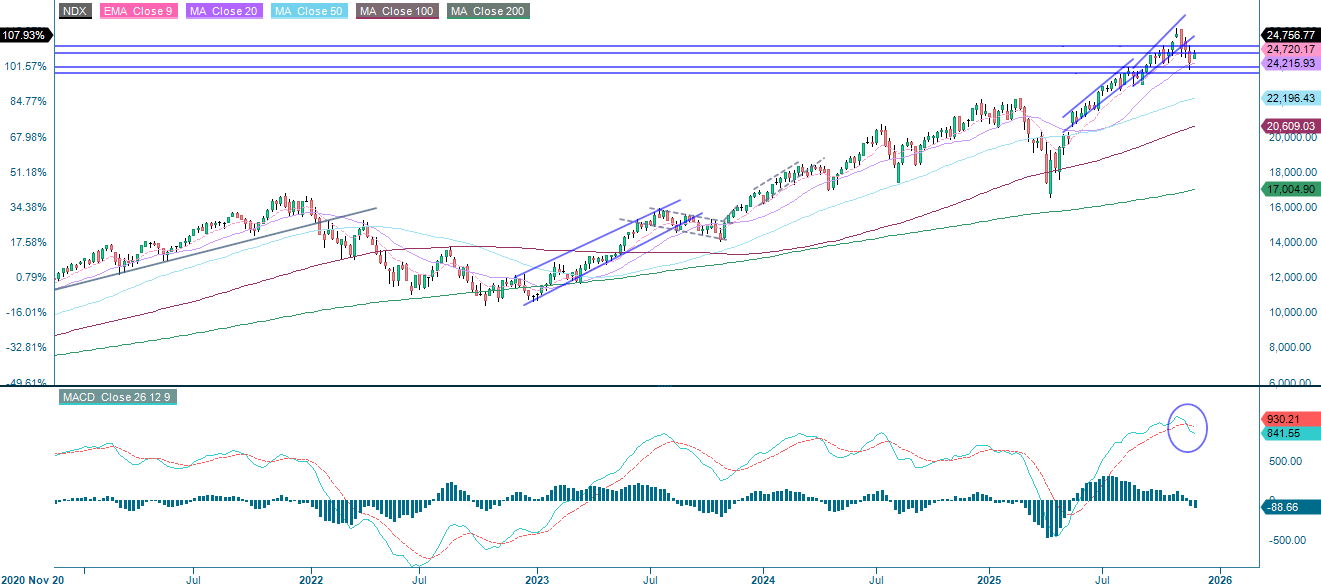
NASDAQ-100 (in USD), weekly five-year chart
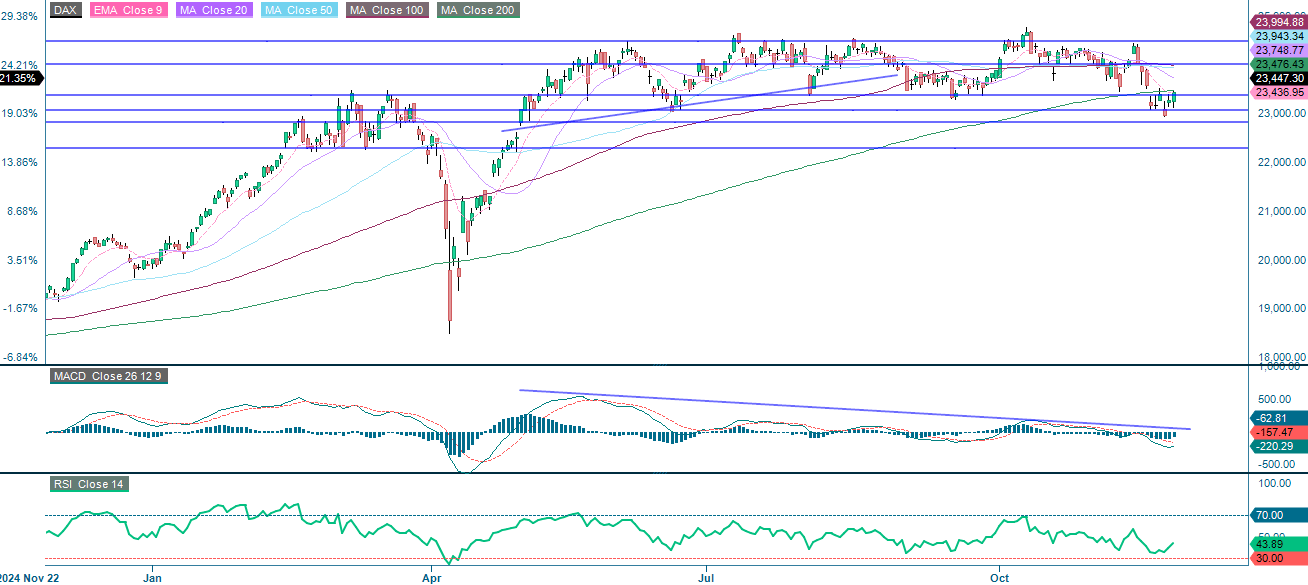
The German DAX continues to trade below the 200-Day Moving Average (MA200) but has tested this level twice. The 20-Day Moving Average (MA20), currently around 23,750, is the first level of resistance, with further resistance around 24,000. Clearly breaking above these levels would improve the technical outlook.
DAX (in EUR), one-year daily chart
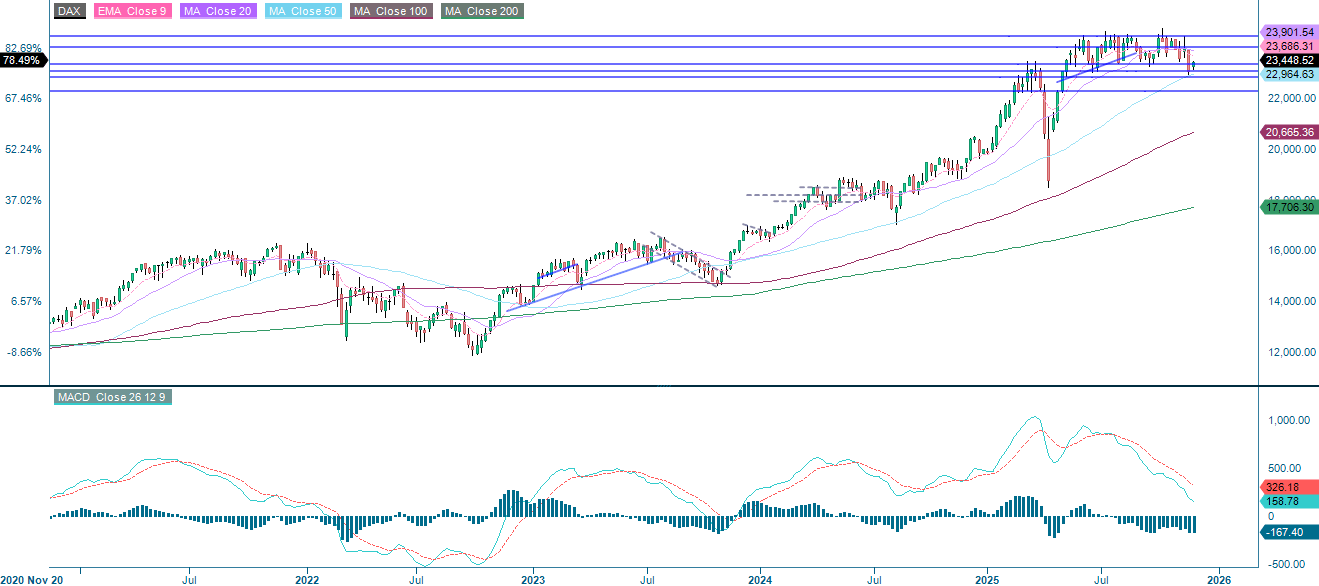
DAX (in EUR), weekly five-year chart
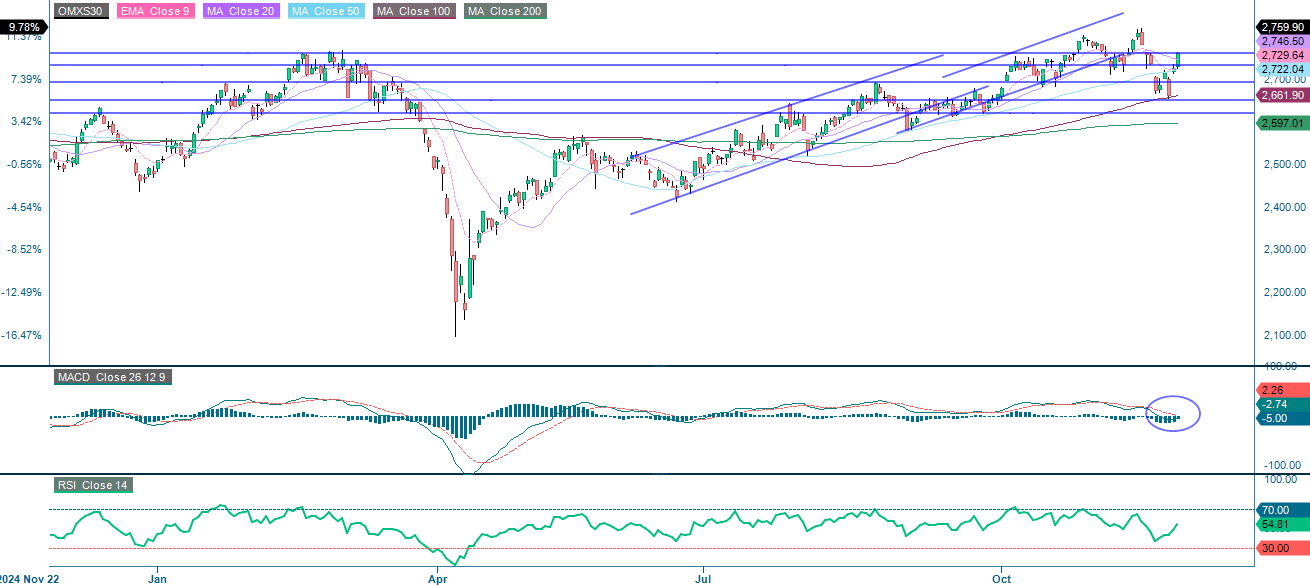
As can be seen in the chart below, OMXS is currently trading above the 20-Day Moving Average (MA20). Initial resistance is located near current levels of around 2,760. A clear break above this area could lead to a move towards 2,800. Is a short possible?
OMX30 (in SEK), one-year daily chart
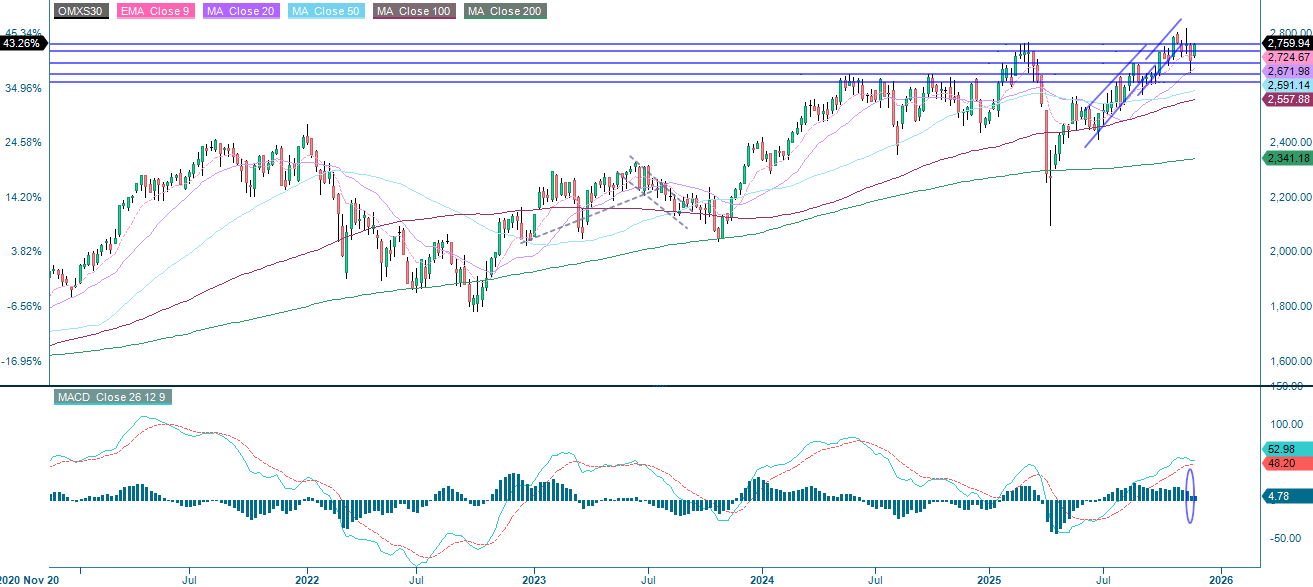
OMX30 (in SEK), weekly five-year chart
The full name for abbreviations used in the previous text:
EMA 9: 9-Day Exponential Moving Average
Fibonacci: There are several Fibonacci lines used in technical analysis. Fibonacci numbers are a sequence in which each successive number is the sum of the two previous numbers.
MA20: 20-Day Moving Average
MA50: 50-Day Moving Average
MA100: 100-Day Moving Average
MA200: 200-Day Moving Average
MACD: Moving Average Convergence Divergence
Risks
Credit risk of the issuer:
Investors in the products are exposed to the risk that the Issuer or the Guarantor may not be able to meet its obligations under the products. A total loss of the invested capital is possible. The products are not subject to any deposit protection.
Currency risk:
If the product currency differs from the currency of the underlying asset, the value of a product will also depend on the exchange rate between the respective currencies. As a result, the value of a product can fluctuate significantly.
Market risk:
The value of the products can fall significantly below the purchase price due to changes in market factors, especially if the value of the underlying asset falls. The products are not capital-protected
Product costs:
Product and possible financing costs reduce the value of the products.
Risk with leverage products:
Due to the leverage effect, there is an increased risk of loss (risk of total loss) with leverage products, e.g. Bull & Bear Certificates, Warrants and Mini Futures.
External author:
This information is in the sole responsibility of the guest author and does not necessarily represent the opinion of Bank Vontobel Europe AG or any other company of the Vontobel Group. The further development of the index or a company as well as its share price depends on a large number of company-, group- and sector-specific as well as economic factors. When forming his investment decision, each investor must take into account the risk of price losses. Please note that investing in these products will not generate ongoing income.
The products are not capital protected, in the worst case a total loss of the invested capital is possible. In the event of insolvency of the issuer and the guarantor, the investor bears the risk of a total loss of his investment. In any case, investors should note that past performance and / or analysts' opinions are no adequate indicator of future performance. The performance of the underlyings depends on a variety of economic, entrepreneurial and political factors that should be taken into account in the formation of a market expectation.
Disclaimer:
This information is neither an investment advice nor an investment or investment strategy recommendation, but advertisement. The complete information on the products (securities) mentioned herein, in particular the structure and risks associated with an investment, are described in the base prospectus, together with any supplements, as well as the final terms relating to the securities. The base prospectus and final terms constitute the solely binding sales documents for the products mentioned herein. It is recommended that potential investors read these documents before making any investment decision. The documents and the key information document are published on the website of the issuer, Vontobel Financial Products GmbH, Bockenheimer Landstrasse 24, 60323 Frankfurt am Main, Germany, on https://prospectus.vontobel.com and are available from the issuer free of charge. The approval of the prospectus should not be understood as an endorsement of the securities. The securities are products that are not simple and may be difficult to understand. This information includes or relates to figures of past performance. Past performance is not a reliable indicator of future performance. This information may only be distributed or published in countries where such distribution or publication is permitted by applicable law. As stated in the relevant base prospectus, the distribution of the securities mentioned in this information is subject to restrictions in certain jurisdictions. This advertisement may not be reproduced or redistributed without prior permission by Vontobel.
© Bank Vontobel Europe AG and / or affiliated companies. All rights reserved.