A continued strong US earnings season

This week, we will be evaluating Skanska, which is set to release its Q3 2025 interim results on Thursday, 6 November. We predict that Skanska will not reach peak profits until conditions in the office property development markets in the US and Sweden, and in the residential property market in the Nordic region, improve. So far, around 64% of all S&P 500 companies have reported Q3 results, with 83% exceeding analysts’ estimates.
Case of the week: Waiting for lower office vacancies
Skanska will release its Q3 2025 report on Thursday, 6 November. The share price has risen by 11% year-to-date. This is despite weak demand in two of its most important markets: commercial construction (excluding civil engineering projects such as roads and bridges) and residential development in the Nordic region.
In addition, the USD has weakened by around 14% against the SEK so far in 2025. This has had a negative impact on the approximate 50% of Skanska's revenue that is generated in the US. During the first half of 2025, 49% of Skanska's revenue (converted into SEK) came from the United States, 36% from the Nordic countries, and 15% from Europe (specifically, the UK, Poland, the Czech Republic, Slovakia, Romania and Hungary).
During the first half of 2025, Skanska's operating margin of 3.7% remained consistent with the long-term objective of achieving a margin of more than 3.5%. However, the Group's Return on Equity (ROE) of 9.5% was clearly below the company's long-term goal of over 18%. To achieve this, Skanska needs to generate surplus values from newly built office projects. However, the market for these is weak, particularly in the United States. With a few exceptions, though, such as Austin and Houston in Texas, major US cities still have high office vacancies. This is because employees have not yet fully returned to their workplaces following the pandemic. More importantly, city centers in the US ('downtown') are no longer considered particularly attractive locations for shops and restaurants, which support office space rental. Nevertheless, Skanska could seize this opportunity to build new offices in more appealing metropolitan areas, such as Texas.
Due to an increase in office vacancies, constructing and renting out new is becoming increasingly challenging in the Stockholm region in Sweden. Recently, Skanska has primarily undertaken new office development projects in major cities across Eastern Europe, including Poland. Building new offices, filling them with tenants and then selling these modern properties to institutional investors typically generates an equity return of between 15% and 20%. It can be compared to a construction project carried out on behalf of an external client, which usually provides an operating margin of around 5%. Therefore, Skanska typically achieves peak profitability once it has sold several new office properties to investors.
Furthermore, the conditions for residential development in the Nordic region, particularly Sweden, should be much stronger than they currently are. This is because operating margins in residential development tend to be higher than those in ordinary construction projects. Skanska's extensive geographical reach and diversification into various construction sectors have clearly outperformed those of its Swedish competitor, the residential developer JM. JM's share price has fallen by 21% so far this year, suggesting that investors do not expect conditions in the Swedish residential development market to improve soon.
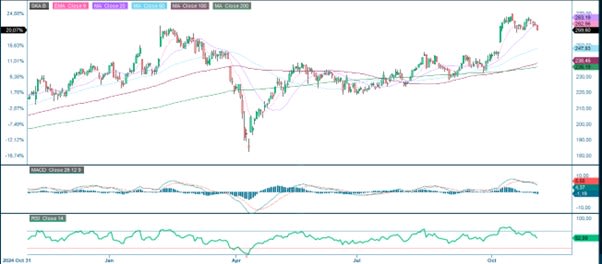
Skanska shares are currently trading at SEK 259, giving a price-to-earnings ratio of 17 based on earnings over the past year. Based on this, we see limited potential in the stock over the next six months. In our view, the Skanska share price would need to fall by 10–15% to become attractive again.
Skanska B (in SEK), one-year daily chart
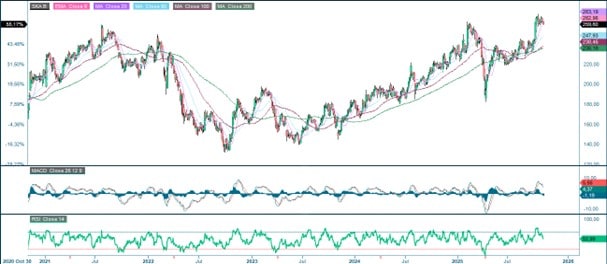
Skanska B (in SEK), five-year weekly chart
Macro comments
As expected, the Fed lowered interest rates by 25 basis points to a range of 3.75% to 4.0% on Wednesday, 29 October. However, Fed Chairman Powell said that another cut this year is uncertain, despite this being factored in by the market.
Following a meeting between Trump and Xi Jinping, the US reduced tariffs on China from 57% to 47%. According to Trump, the issue of rare earth metals has been resolved, and China will resume purchasing US soybeans. Trump also opened the possibility of easing the export of certain advanced American chip products.
By Friday 31 October, approximately 320 companies in the S&P 500 had announced their third quarter 2025 results. According to Earnings Insight, 83% of these companies reported positive earnings surprises, while 79% reported positive revenue surprises. The earnings growth rate for S&P 500 companies in Q3 2025 increased from 9.2% one week ago to 10.7% by 31 October.
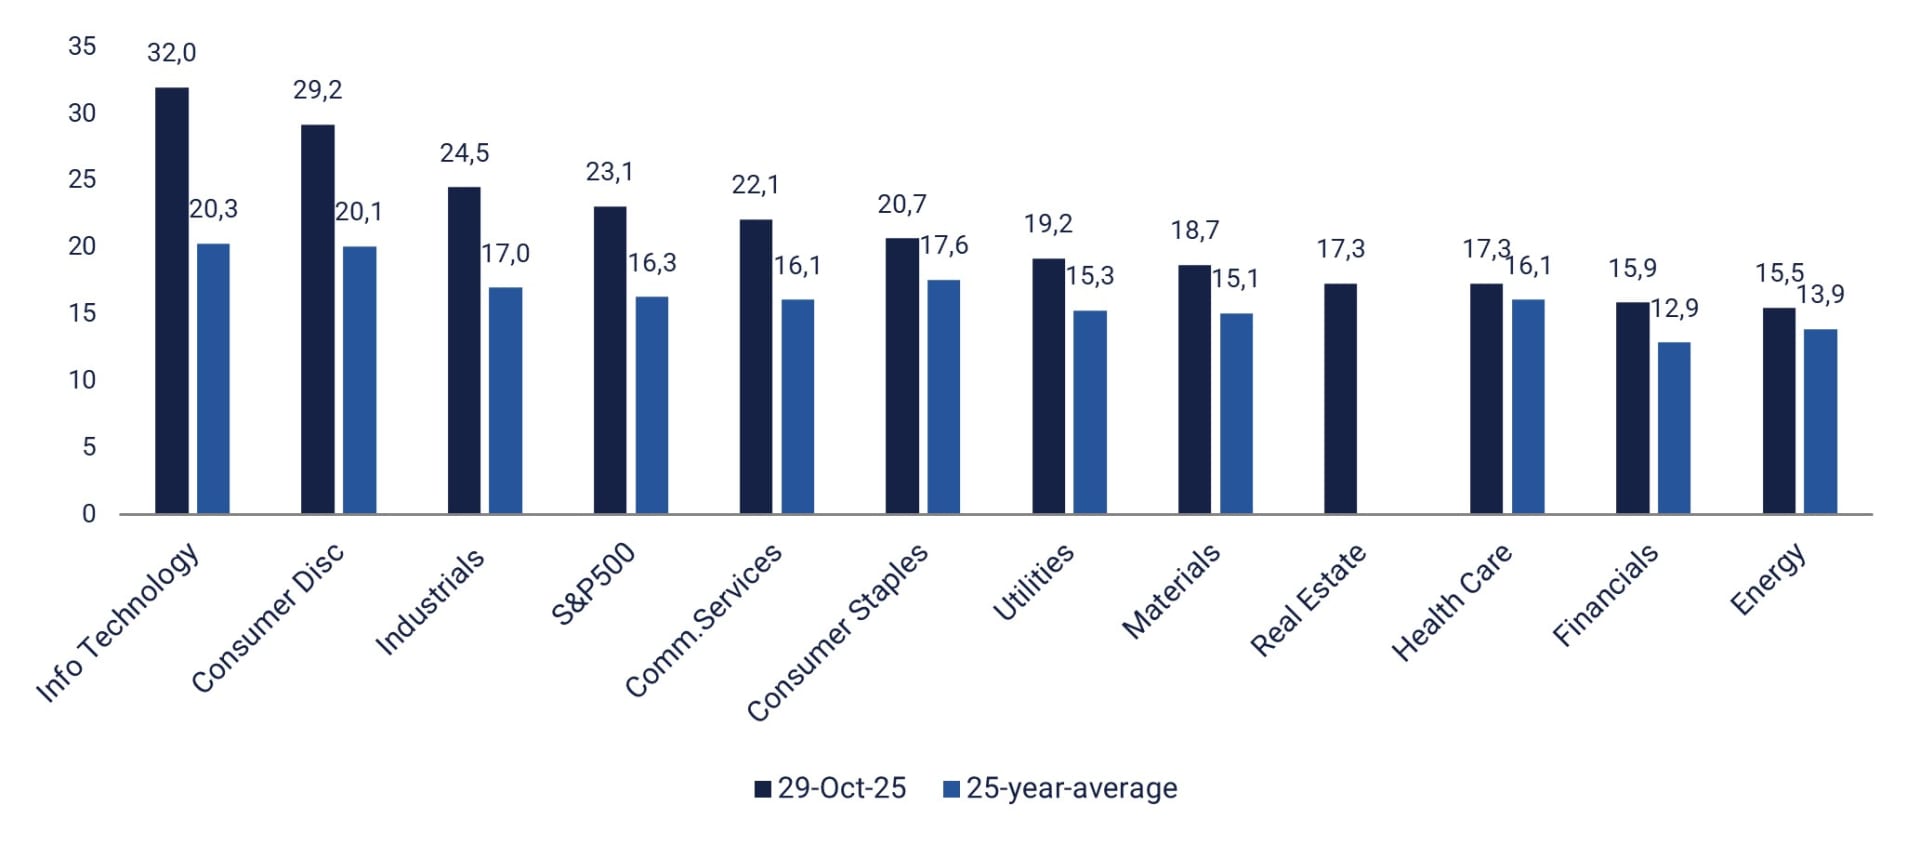
S&P 500 sector forward 12-month price-to-earnings ratios: 29 October versus 25-year-average
By Friday 31 October, 82 Swedish OMX companies had announced their Q3 results. While 65% exceeded the market's consensus expectations, only 51% surpassed revenue forecasts. Nine of these companies also reported order intake, and four of these (44%) exceeded analysts' estimates.
On Wednesday, 5 November, the following larger Nordic companies are reporting quarterly results: Novo Nordisk, Lundin Mining, Sampo and Vestas. Meanwhile, Nordea, Alleima and Troax are holding capital market days. The larger international companies reporting quarterly results include BMW, McDonalds, McKesson, Qualcomm and Toyota. The macroeconomic news this Wednesday is dominated by the services purchasing managers' index for October from China, as well as from Sweden, Spain, Italy, France, Germany, the Eurozone, the UK, and the US. We will also receive Germany's industrial orders and France's industrial production figures, both for September. From the Eurozone, we will receive the Producer Price Index for September. The Swedish Riksbank will announce its interest rate. The US will also release data on private employment in October from the ADP as well as weekly oil inventory statistics from the Department of Energy.
On Thursday, 6 November, five major companies listed on the Stockholm Stock Exchange will report: Skanska, AstraZeneca, Securitas, Hufvudstaden and Lundin Gold. ELUX PRO is organizing an investor day, while Volvo Cars will provide a strategy update. Other major Nordic companies reporting on Thursday include Veidekke, Genmab, GN Store Nord and Maersk. Norwegian will report October's traffic figures. Companies in continental Europe and North America reporting interim results include Millicom in Luxembourg, GEA Group, Rheinmetall, and Zalando in Germany, and Conoco Philips in the US. The week's macroeconomic news begins on Thursday with Japan's services purchasing managers' index for October. This will be followed by Germany's industrial production figures and the Eurozone's retail sales figures, both for September. Interest rate announcements will be made by the Bank of England and Norges Bank. From the US, we will receive October's Challenger job cut statistics, initial weekly jobless claims, Q3 productivity figures, and September's wholesale inventories.
On Friday 7 November, Daimler Truck in Germany and Constellation Energy Corporation and Enbridge in the US will release their quarterly reports. The day's macroeconomic news will begin with China's October trade balance. This will be followed by Germany's September trade balance and Canada's October unemployment figures. From the US, we will receive the November Michigan Index.
Time for a spread, buy NASDAQ and sell DAX?
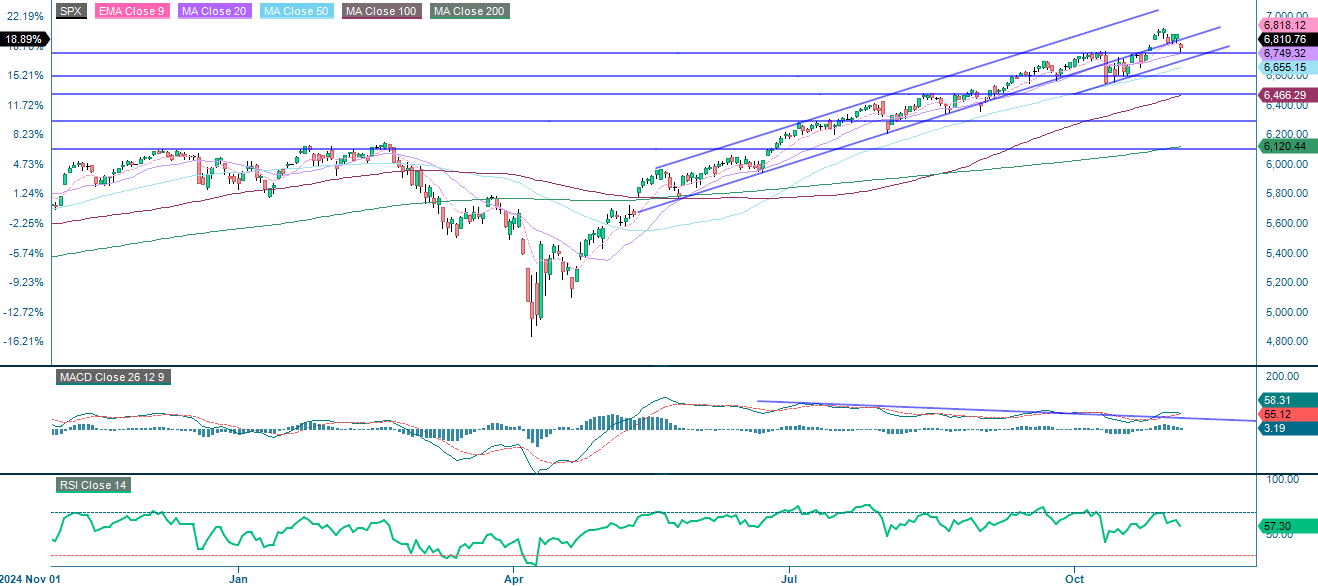
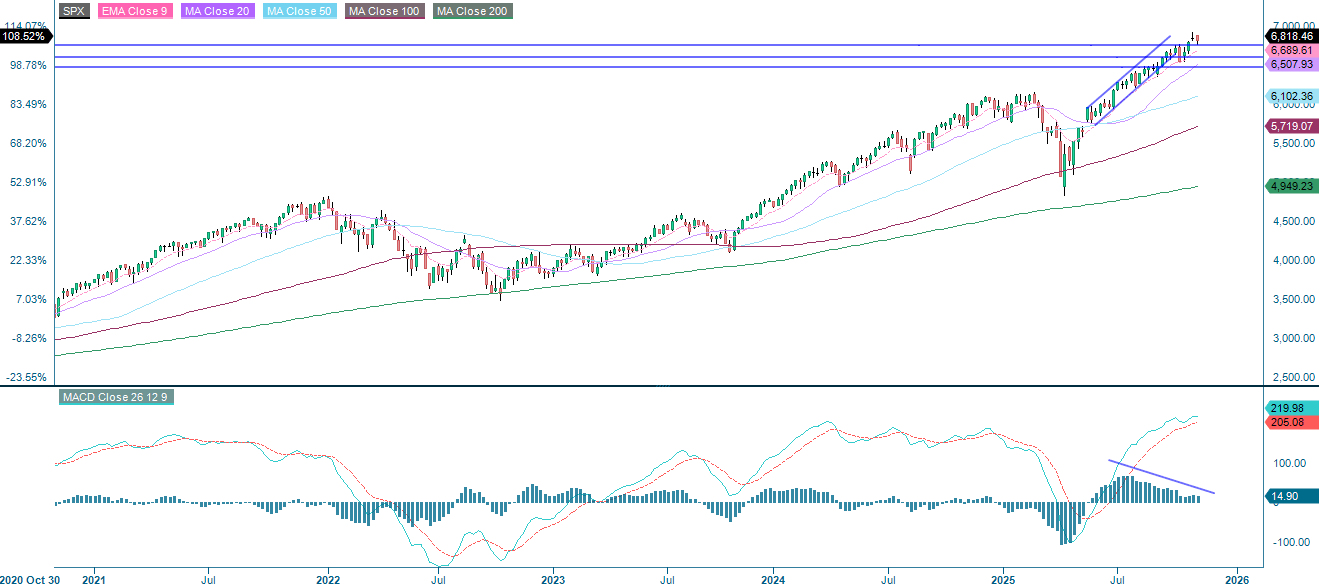
The S&P 500 remains in a firm upward trend. A brief pullback is visible within an upward channel. Although momentum is easing, the Moving Average Convergence Divergence (MACD) remains positive. The next step could be a break below 6,750 and 50-day Moving Average (MA50), which is currently at 6,655. However, while the Relative Strength Index (RSI) is at 58, indicating healthy strength without being overbought, sustained movement above 6,750 could see the index test the previous high, which is just below 6,900.
S&P 500 (in USD), one-year daily chart
S&P 500 (in USD), weekly five-year chart
Related Products
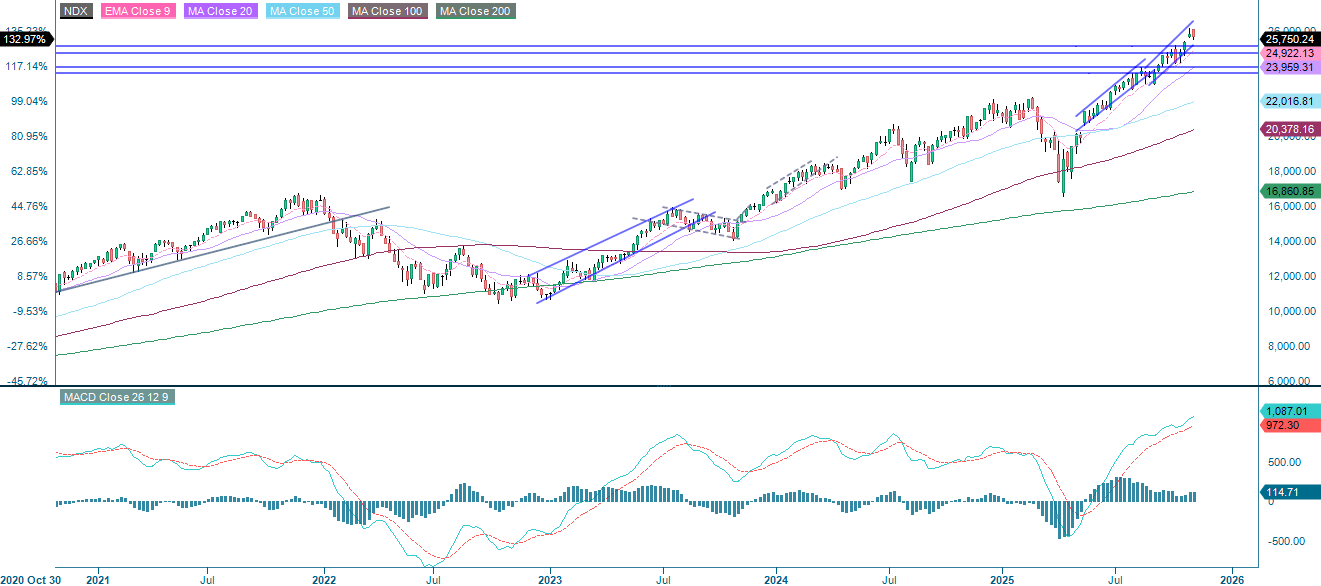
The NASDAQ-100 is still trading above all the key moving averages within a rising channel. The Moving Average Convergence Divergence (MACD) remains bullish but is approaching previous momentum peaks. Meanwhile, the Relative Strength Index (RSI), at 60.5, indicates healthy strength, yet suggests a slight cooling. Resistance is found around 26,120. However, the next levels of support are found at 9-day Exponential Moving Average (EMA9), currently at 25,690, and between 25,140 and 25,240.
NASDAQ-100 (in USD), one-year daily chart
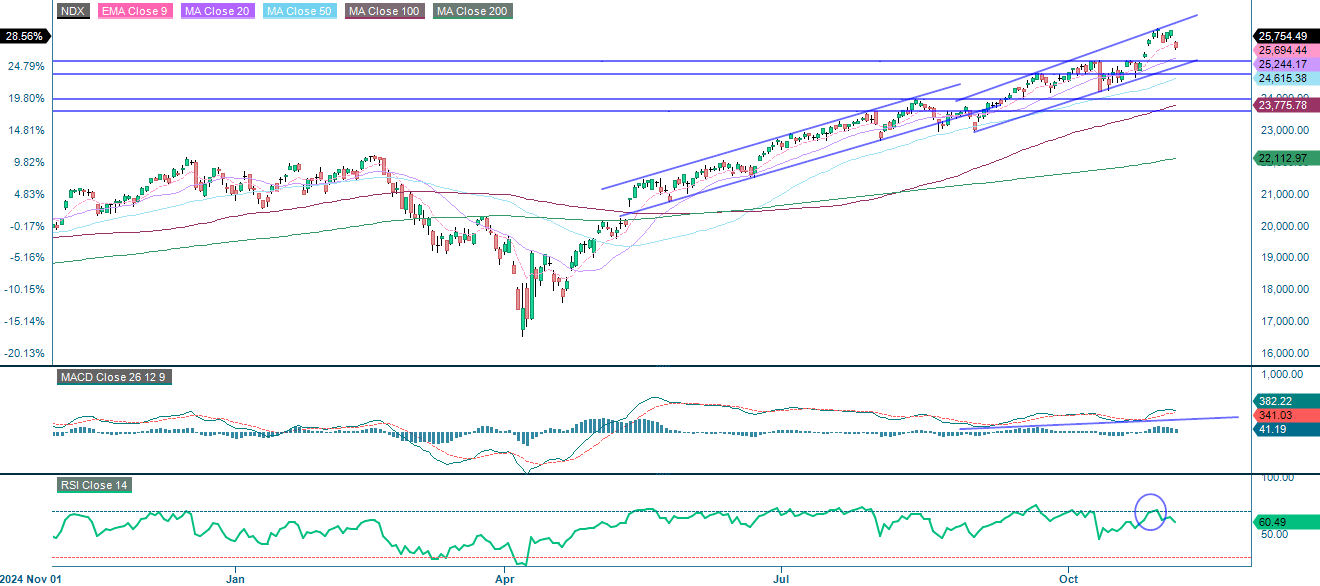
NASDAQ-100 (in USD), weekly five-year chart
Related Products
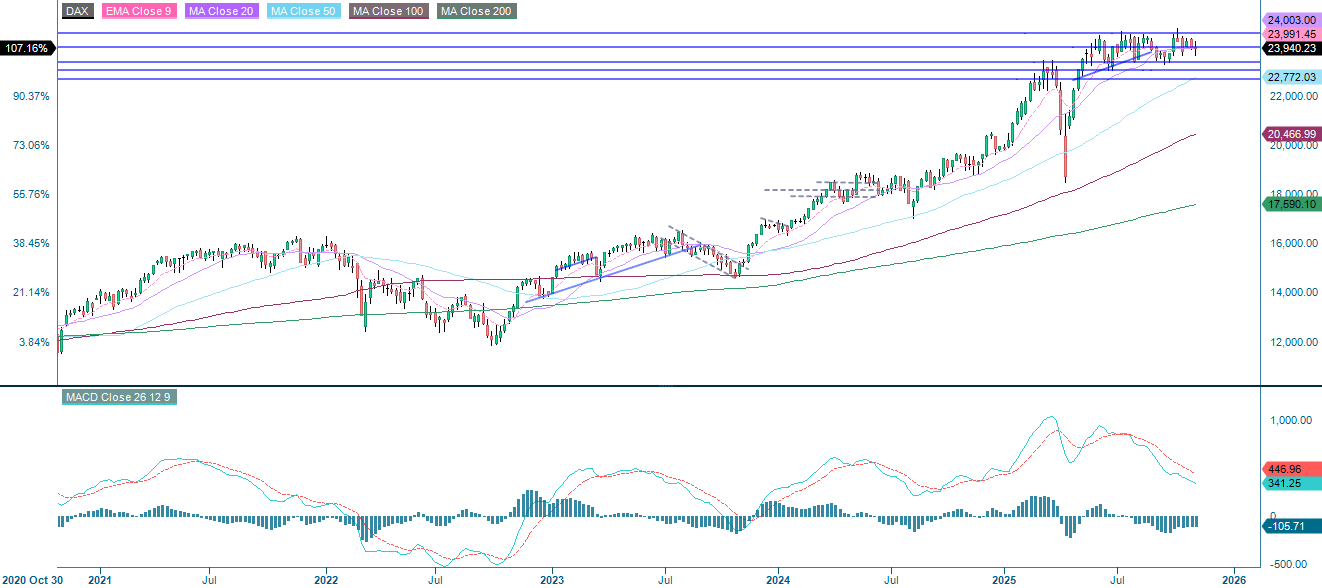
The DAX has moved from a strong uptrend into a broad range, oscillating between the resistance level of ~24,475 and the support level of ~23,365. With the index trading below 24,000, there is an imminent risk of a further decline towards the 200-day Moving Average (MA200), which is currently just above 23,330.
DAX (in EUR), one-year daily chart
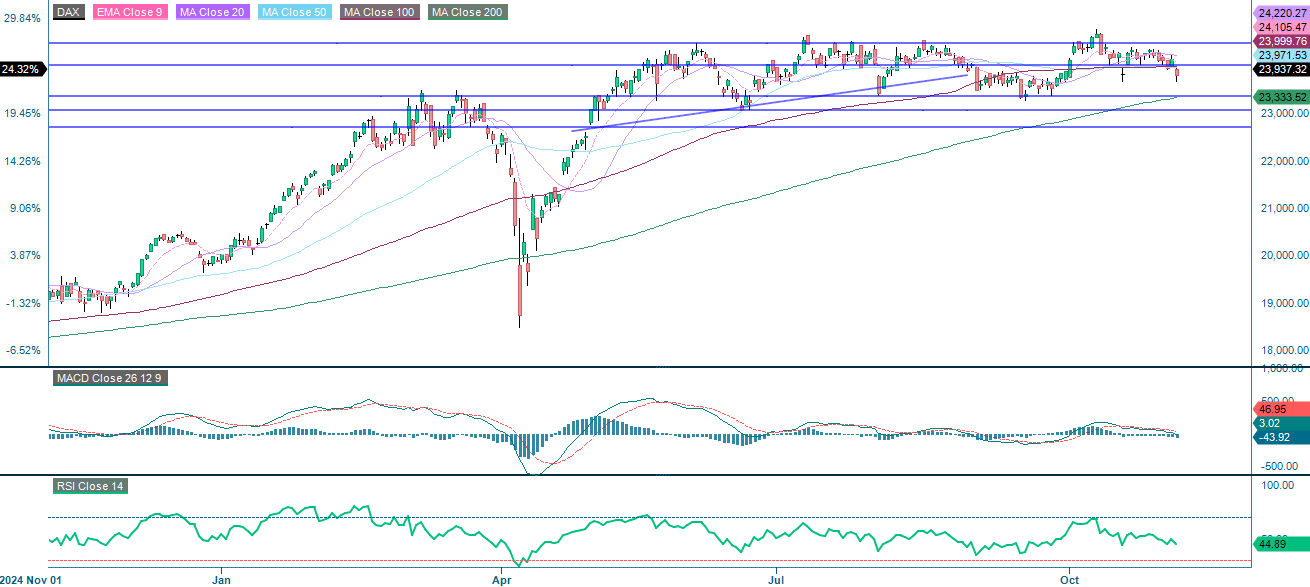
DAX (in EUR), weekly five-year chart
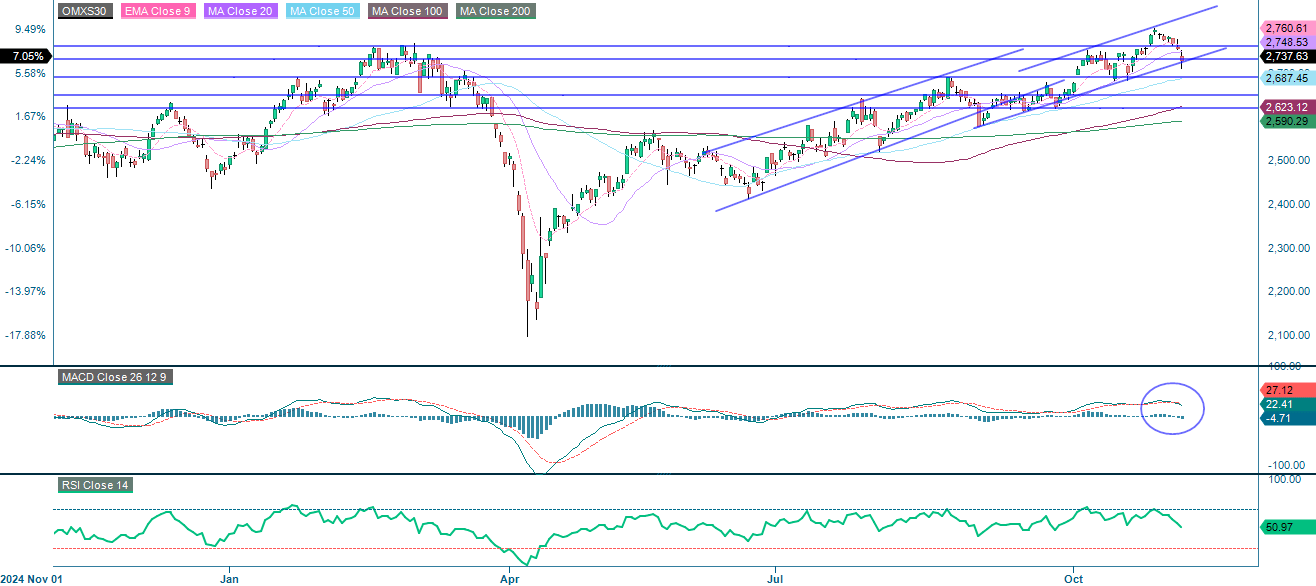
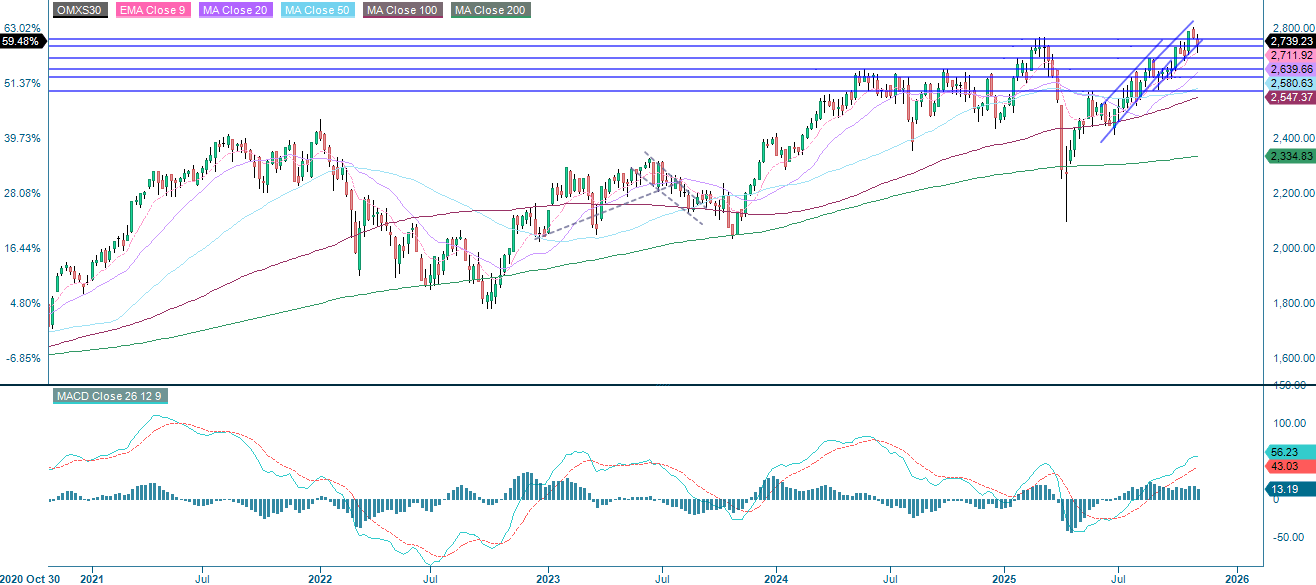
The OMXS30 remains within a broader uptrend and a rising channel, but momentum has paused. The index is trading just below the support level of around 2,730, which is converging with the floor of the rising trend channel. Moving Average Convergence Divergence (MACD) has generated a soft sell signal, with levels around 2,690 and 50-day Moving Average (MA50) potentially next.
OMX30 (in SEK), one-year daily chart
OMX30 (in SEK), weekly five-year chart
The full name for abbreviations used in the previous text:
EMA 9: 9-day Exponential Moving Average
Fibonacci: There are several Fibonacci lines used in technical analysis. Fibonacci numbers are a sequence in which each successive number is the sum of the two previous numbers.
MA20: 20-day Moving Average
MA50: 50-day Moving Average
MA100: 100-day Moving Average
MA200: 200-day Moving Average
MACD: Moving Average Convergence Divergence
Risks
Credit risk of the issuer:
Investors in the products are exposed to the risk that the Issuer or the Guarantor may not be able to meet its obligations under the products. A total loss of the invested capital is possible. The products are not subject to any deposit protection.
Currency risk:
If the product currency differs from the currency of the underlying asset, the value of a product will also depend on the exchange rate between the respective currencies. As a result, the value of a product can fluctuate significantly.
Market risk:
The value of the products can fall significantly below the purchase price due to changes in market factors, especially if the value of the underlying asset falls. The products are not capital-protected
Product costs:
Product and possible financing costs reduce the value of the products.
Risk with leverage products:
Due to the leverage effect, there is an increased risk of loss (risk of total loss) with leverage products, e.g. Bull & Bear Certificates, Warrants and Mini Futures.
External author:
This information is in the sole responsibility of the guest author and does not necessarily represent the opinion of Bank Vontobel Europe AG or any other company of the Vontobel Group. The further development of the index or a company as well as its share price depends on a large number of company-, group- and sector-specific as well as economic factors. When forming his investment decision, each investor must take into account the risk of price losses. Please note that investing in these products will not generate ongoing income.
The products are not capital protected, in the worst case a total loss of the invested capital is possible. In the event of insolvency of the issuer and the guarantor, the investor bears the risk of a total loss of his investment. In any case, investors should note that past performance and / or analysts' opinions are no adequate indicator of future performance. The performance of the underlyings depends on a variety of economic, entrepreneurial and political factors that should be taken into account in the formation of a market expectation.
Disclaimer:
This information is neither an investment advice nor an investment or investment strategy recommendation, but advertisement. The complete information on the products (securities) mentioned herein, in particular the structure and risks associated with an investment, are described in the base prospectus, together with any supplements, as well as the final terms relating to the securities. The base prospectus and final terms constitute the solely binding sales documents for the products mentioned herein. It is recommended that potential investors read these documents before making any investment decision. The documents and the key information document are published on the website of the issuer, Vontobel Financial Products GmbH, Bockenheimer Landstrasse 24, 60323 Frankfurt am Main, Germany, on https://prospectus.vontobel.com and are available from the issuer free of charge. The approval of the prospectus should not be understood as an endorsement of the securities. The securities are products that are not simple and may be difficult to understand. This information includes or relates to figures of past performance. Past performance is not a reliable indicator of future performance. This information may only be distributed or published in countries where such distribution or publication is permitted by applicable law. As stated in the relevant base prospectus, the distribution of the securities mentioned in this information is subject to restrictions in certain jurisdictions. This advertisement may not be reproduced or redistributed without prior permission by Vontobel.
© Bank Vontobel Europe AG and / or affiliated companies. All rights reserved.