Focus on five Mag7 reports this week

This week's case study focuses on Alphabet, one of the five Mag 7 companies set to deliver their Q3 2025 figures. Its stock has performed strongly this year, primarily due to growing momentum within Google Cloud and the company's foray into quantum computing. So far, the Q3 2025 earnings season has delivered a strong outcome, with 87% of S&P 500 companies exceeding analyst forecasts.
Case of the week: Opportunities in Alphabet
Alphabet (often known as Google) has outperformed both its hyperscaler peers and the broader Magnificent Seven this year, emerging as one of the strongest tech performers of 2025. Its stock has climbed by over 33% year-to-date, reaching new record highs and alleviating concerns that generative AI could undermine its core business model.
Much of this renewed optimism stems from the growing momentum within Google Cloud, which is strengthening Alphabet’s position in the ongoing AI race. In addition to making consistent progress with its Gemini initiative, the Google Cloud Platform (GCP) is experiencing increased demand from enterprises. For example, Anthropic recently expanded its partnership with Google, adding another one million more Tensor Processing Units (TPUs) for deployment starting next year. Meanwhile, Google Workspace is capturing a greater share of enterprise spending as its generative AI features enhance productivity tools, helping it to compete with Microsoft’s 365 ecosystem.
Alphabet's foray into quantum computing has further solidified its reputation as a leader in next-generation technologies. Following the unveiling of its proprietary 'Willow' quantum processor at the end of last year, the company introduced a new 'Quantum Echoes' algorithm this week. This advancement enables replication beyond the Willow platform, which is an important step that could bring commercial-scale quantum computing closer within the next five years.
Overall, Alphabet’s growing technological reach — from AI infrastructure to quantum breakthroughs — continues to bolster the consistent performance of its digital advertising division. With multiple growth drivers now in place, the company is entering its upcoming earnings season with solid momentum and a favourable long-term outlook.
Alphabet’s third-quarter earnings report is expected to provide a valuable insight into the company’s underlying business momentum, particularly as investors seek concrete evidence to justify the recent increase in capital expenditure. Clear, confident guidance could ease ongoing concerns about component shortages threatening AI-related growth and reaffirm Google’s ability to execute consistently. Robust fundamentals in the report would further bolster the optimism currently reflected in Alphabet’s share price and reinforce expectations of continued gains in Google Cloud Platform (GCP) market share.
The company appears well-prepared to meet these expectations. Recent developments have indicated improving demand trends in both its cloud computing and digital advertising divisions. Growing enterprise use of Tensor Processing Units (TPUs) is helping Alphabet to reduce its dependence on third-party GPU suppliers, most notably Nvidia, and to mitigate the risks posed by ongoing hardware shortages. This diversification addresses management’s earlier concerns about supply constraints, positioning Google for potential growth and increased profitability, providing a solid foundation for the stock's valuation to rise further.
GOOGL (USD), one-year daily chart

GOOGL (USD), five-year weekly chart

Macro comments
By Friday, 24 October, around 145 companies in the S&P 500 had announced their third-quarter 2025 results. According to Earnings Insight, 87% of these companies reported positive earnings surprises and 83% reported positive revenue surprises. The earnings growth rate for Q3 2025 is currently 9.2%.
As shown in the graph below, the financial sector has performed the best of the major sectors in terms of earning surprises so far, while the information technology sector is in the middle and the communication services sector is the worst performing. This week is set to be the most important, with five of the seven 'Magnificent Seven' companies — Alphabet, Amazon, Apple, Meta Platforms and Microsoft — set to report.
S&P 500 sector-level earnings surprises (%), Q3 2025

By Tuesday 28 October, 72 Swedish OMX companies had reported their Q3 results. While 65% exceeded the market's consensus expectations, only 49% surpassed revenue forecasts.
On Wednesday, 29 October, the following US companies are set to report their interim results: Alphabet, Automatic Data Processing, Boeing, Caterpillar, CVS Health, Meta Platforms, Microsoft, ServiceNow, Starbucks and Verizon. The Swedish companies due to report their Q3 results on Wednesday include Epiroc, Scandic Hotels, SKF and Troax. Other Nordic companies releasing interim reports include Alm Brand, Equinor, Fortum, Neste, Outokumpu, Telenor, UPM and Valmet. In continental Europe, Deutsche Bank, Mercedes-Benz and UBS will report. The macroeconomic news agenda begins with Sweden's Q3 GDP indicator. Spain will also report its Q3 GDP. From the US, we are awaiting the goods trade balance, wholesale inventories and pending home sales in September. The Department of Energy will release weekly oil inventory statistics. Later in the day, interest rate statements will be released by the Federal Reserve. The Hong Kong Stock Exchange is closed for trading on Wednesday.
The US earnings calendar for Thursday, 30 October includes the following companies: Altria Group, Amazon, Anheuser-Busch InBev, Apple, Biogen, Bristol Myers Squibb, Comcast, Eli Lilly, Gilead Sciences, Mastercard, Merck and the Southern Company. The major Swedish companies reporting their Q3 results on Thursday include Electrolux, ELUX PRO, and Intrum. Other Nordic companies reporting interim results include Carlsberg, Kesko and Kongsberg Gruppen. Companies in continental Europe that are reporting interim results include Schneider Electric and Volkswagen. On Thursday, two central banks — the Bank of Japan and the European Central Bank (ECB) — will announce interest rates. Today, there is also a lot of macroeconomic news, beginning with the release of France's Q3 Gross Domestic Product (GDP) figures. The Swedish NIESR will present the October Business Climate Barometer. Spain will release its October Consumer Price Index (CPI) figures. Germany will present October's unemployment figures and Q3 GDP figures. Q3 GDP figures will also be presented from Italy, the Eurozone and the US. Eurozone households' October confidence indicator will also be released, as well as Eurozone unemployment figures for September. Finally, we will conclude with weekly jobless claims from the US.
US companies AbbVie, Chevron and ExxonMobil are scheduled to release their interim results on Friday 31 October. The German company Linde is also set to publish its quarterly report on the same day. Loomis is the only major Swedish company reporting on Friday. Other Nordic companies reporting include Aker Solutions and Danske Bank. Turning to the macroeconomic news agenda, we start with China's Industrial and Service Purchasing Managers' Index for October. Turning to Europe, we have Germany's retail sales and import prices for September. France, Italy, and the Eurozone will provide the CPI for October. The US will contribute Personal Consumption Expenditures (PCE) data for September, labour costs for Q3 and the Chicago Purchasing Managers' Index for October.
Revert-to-meantime: Take some profit?
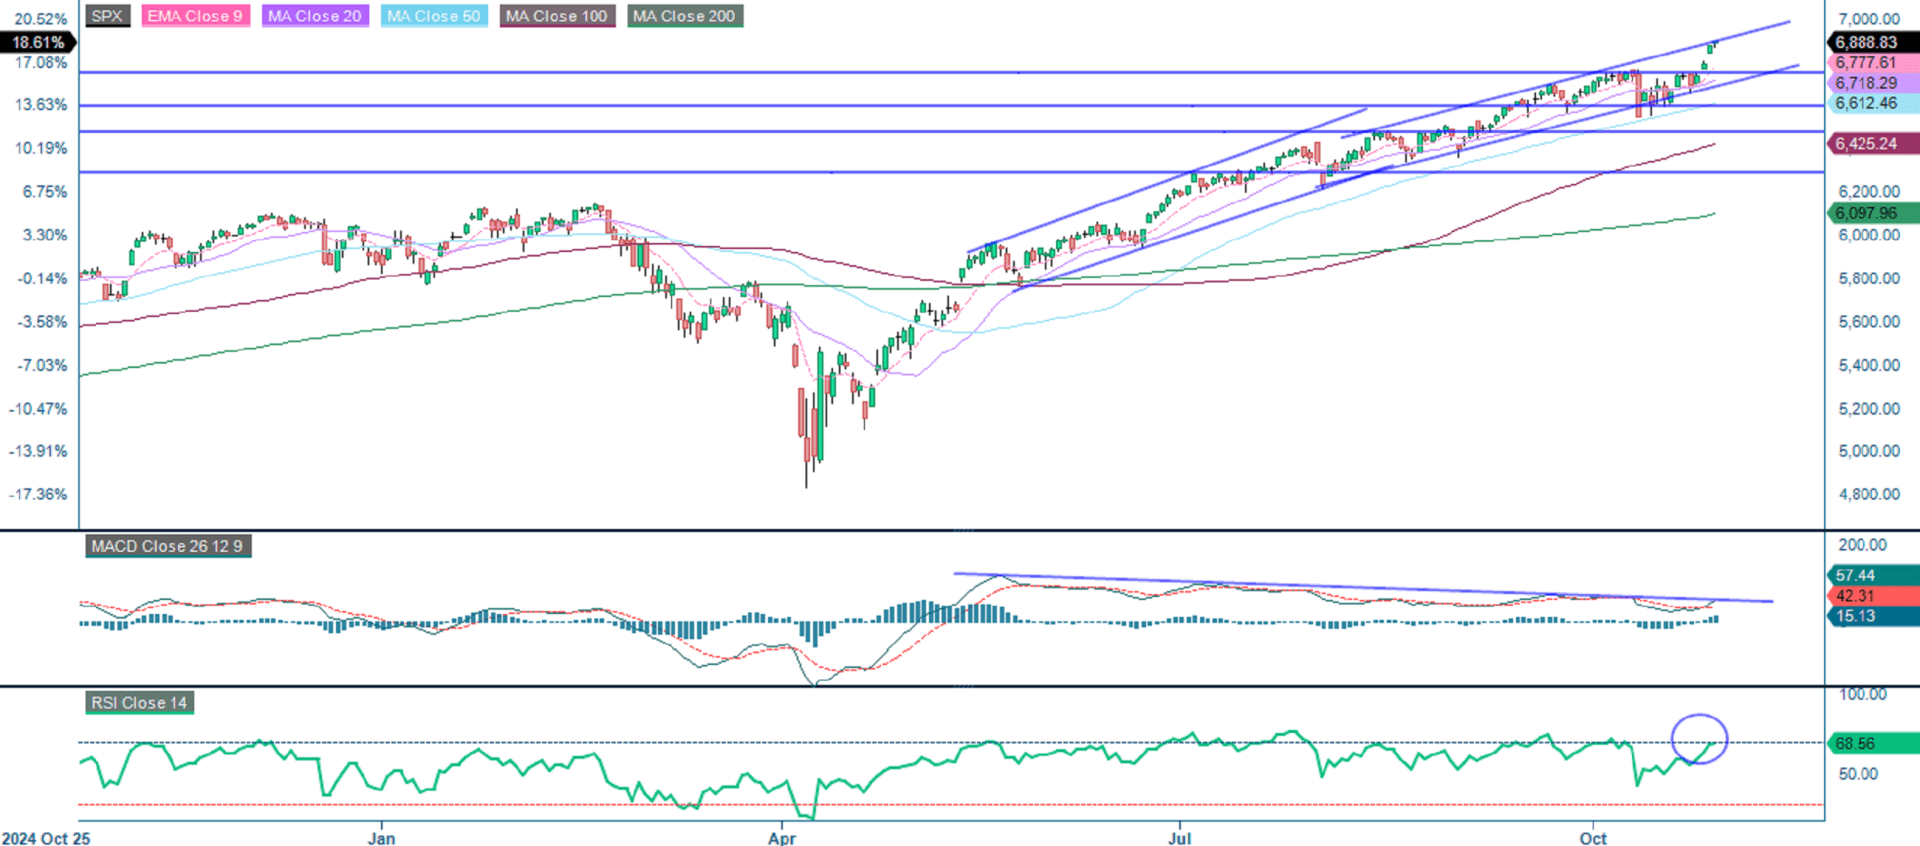
The S&P 500 is currently trading close to the upper boundary of an ascending trend channel. Former resistance levels are now acting as support. All major moving averages are aligned in a bullish manner, and the Moving Average Convergence Divergence (MACD) confirms strengthening momentum. With the Relative Strength Index (RSI) at 68.6, the market is approaching overbought conditions, suggesting scope for short-term consolidation. Overall, sentiment remains positive, though traders should watch out for a potential pullback towards 6,750 or a slowdown in momentum should the breakout fail to extend.
Related Products
S&P 500 (in USD), one-year daily chart
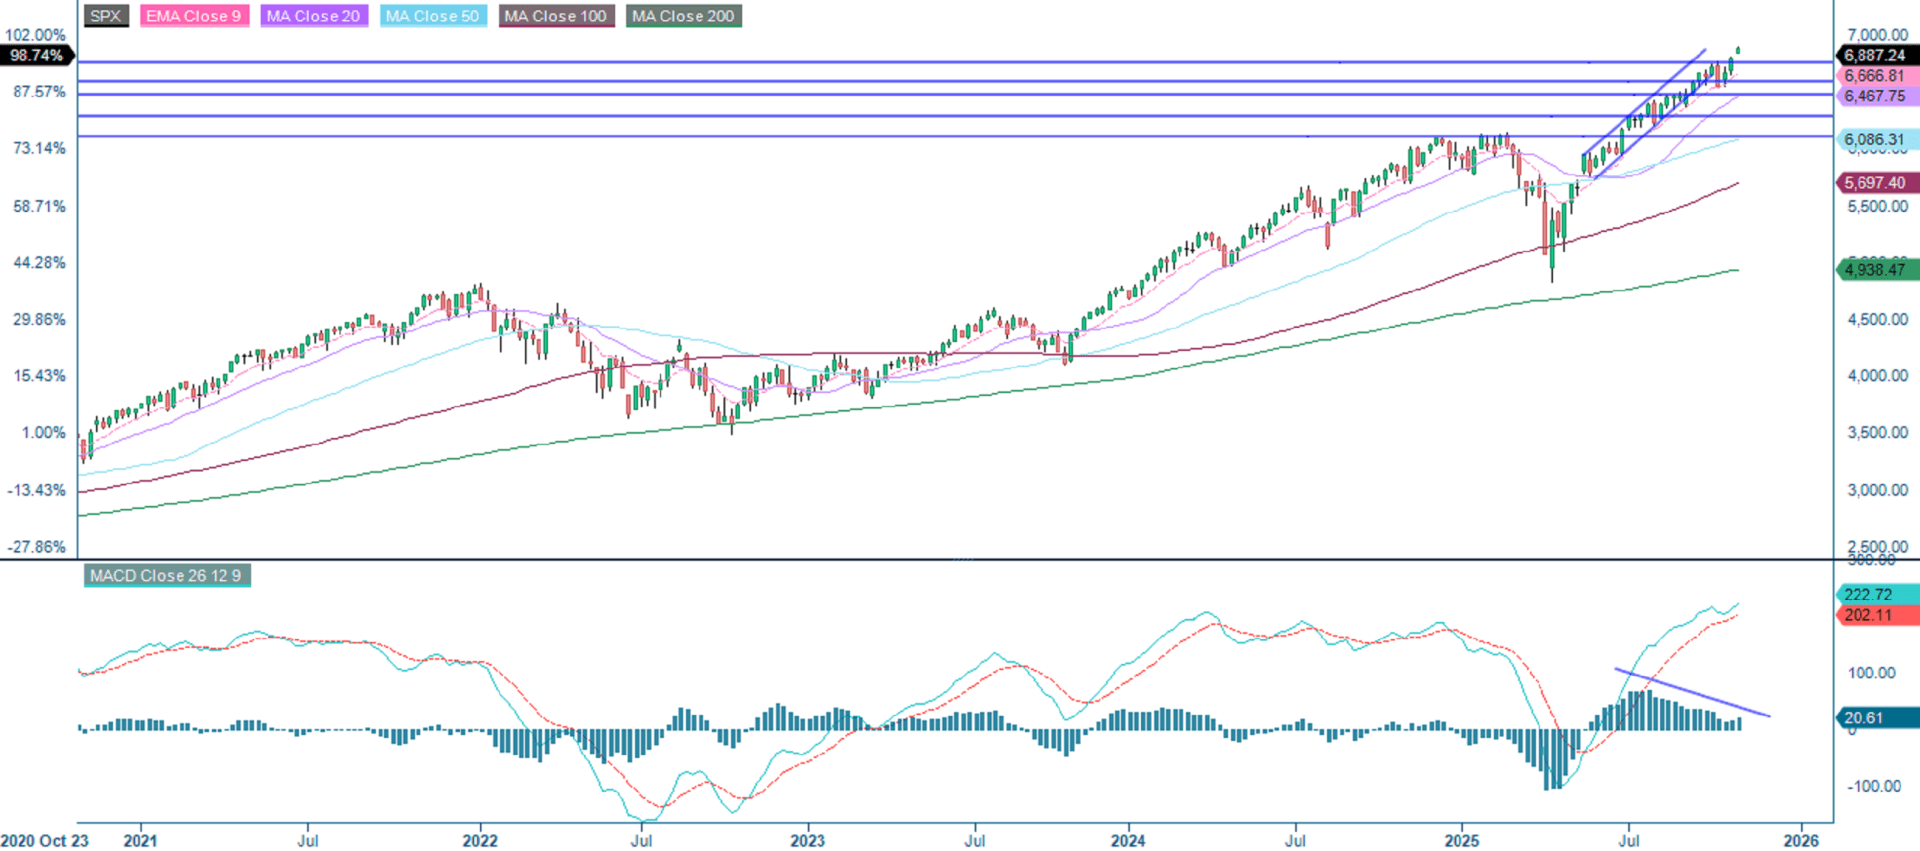
S&P 500 (in USD), weekly five-year chart
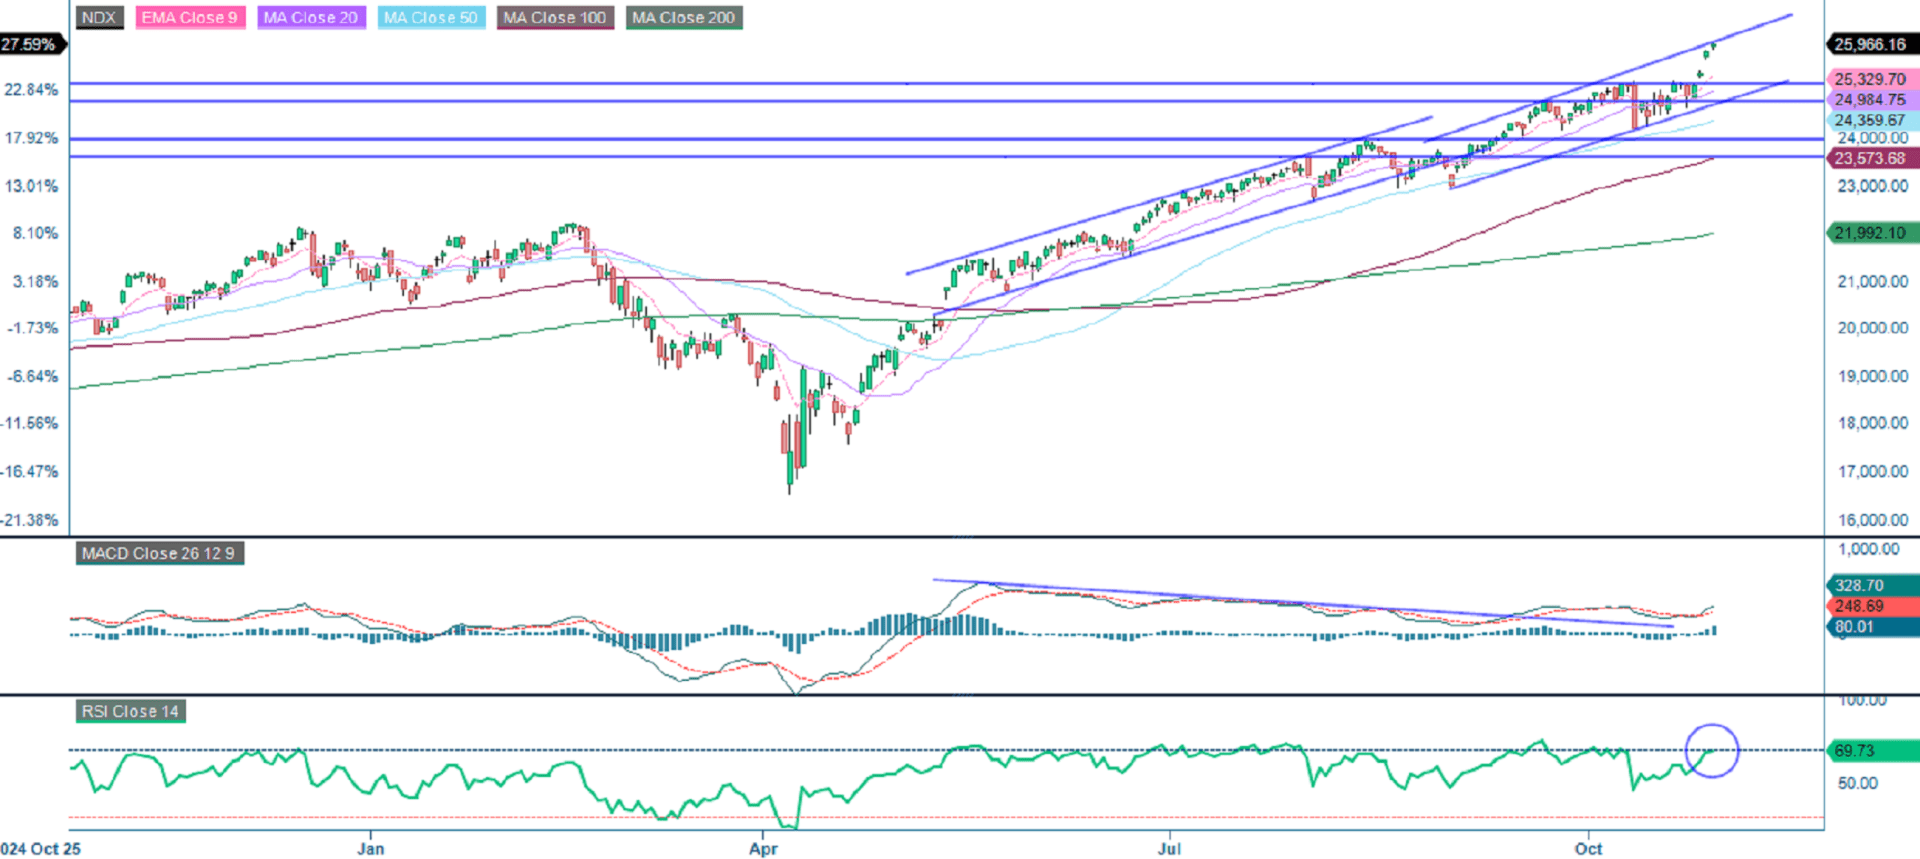
The NASDAQ-100 (NDX) remains in a strong upward trend. Its price structure consistently shows higher highs and lows, supported by bullishly aligned moving averages. Momentum indicators confirm this strength: the Moving Average Convergence Divergence (MACD) is expanding positively, and the Relative Strength Index (RSI) is at 69.7, indicating that the market is almost overbought and that there may be short-term consolidation or profit-taking. Overall, the trend remains firmly bullish, with 25,140 acting as critical support. Maintaining these levels keeps the outlook positive, unless a sharp reversal occurs.
Related Products
NASDAQ-100 (in USD), one-year daily chart
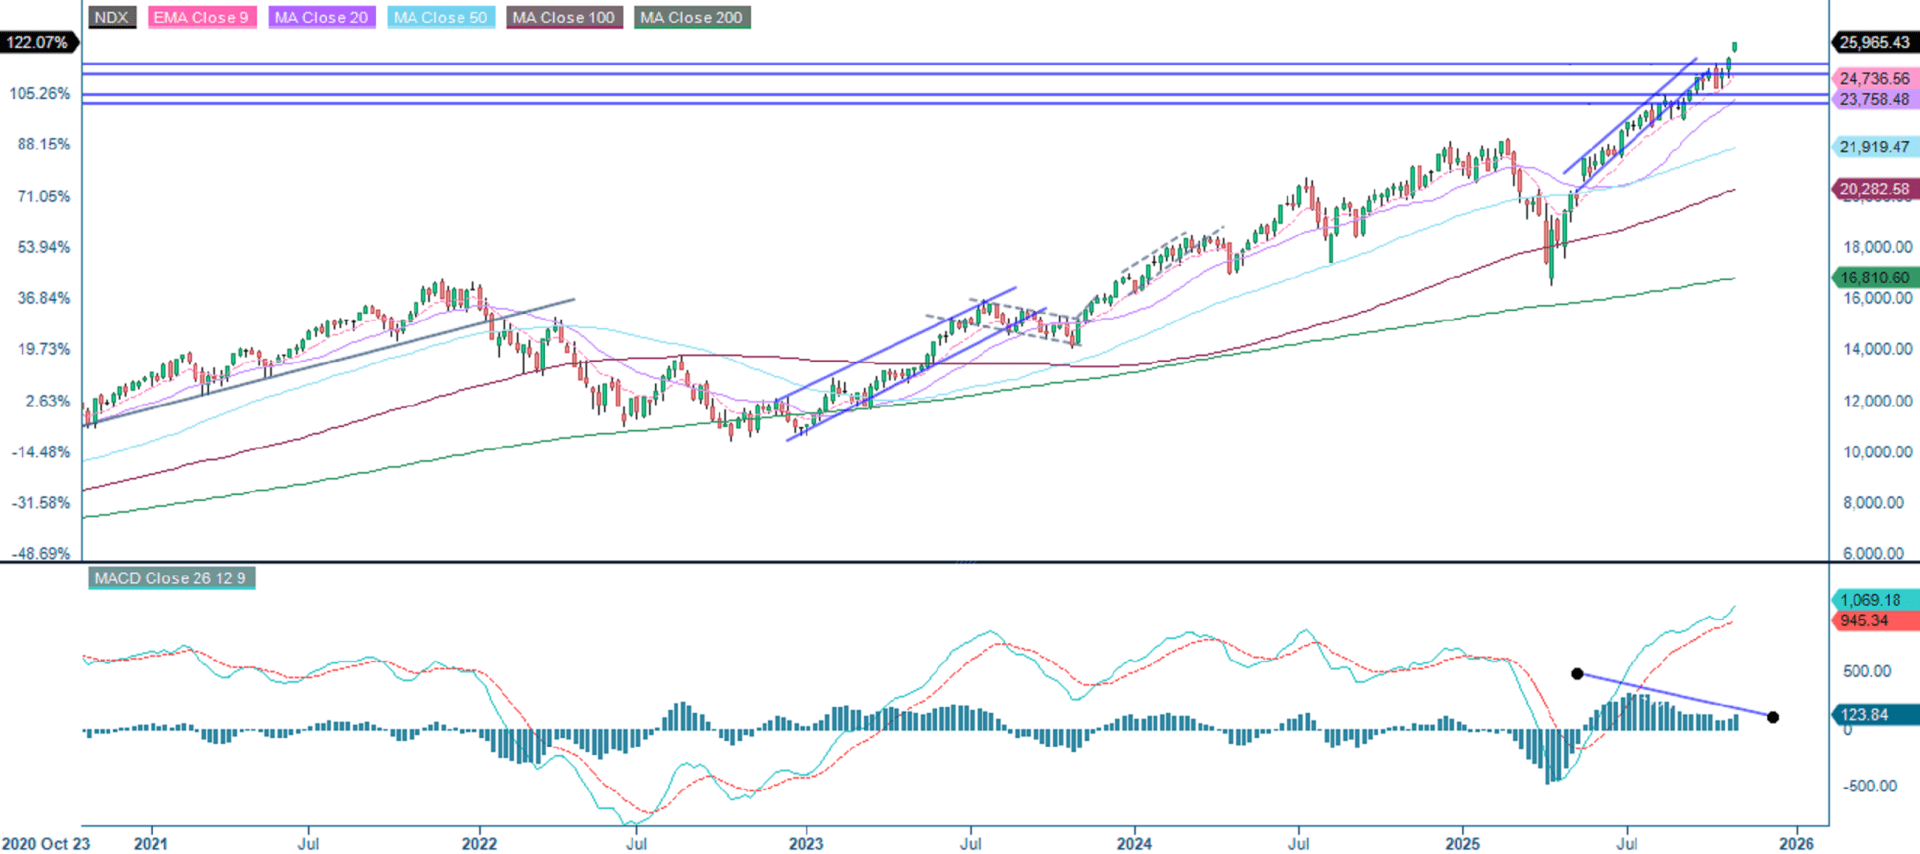
NASDAQ-100 (in USD), weekly five-year chart
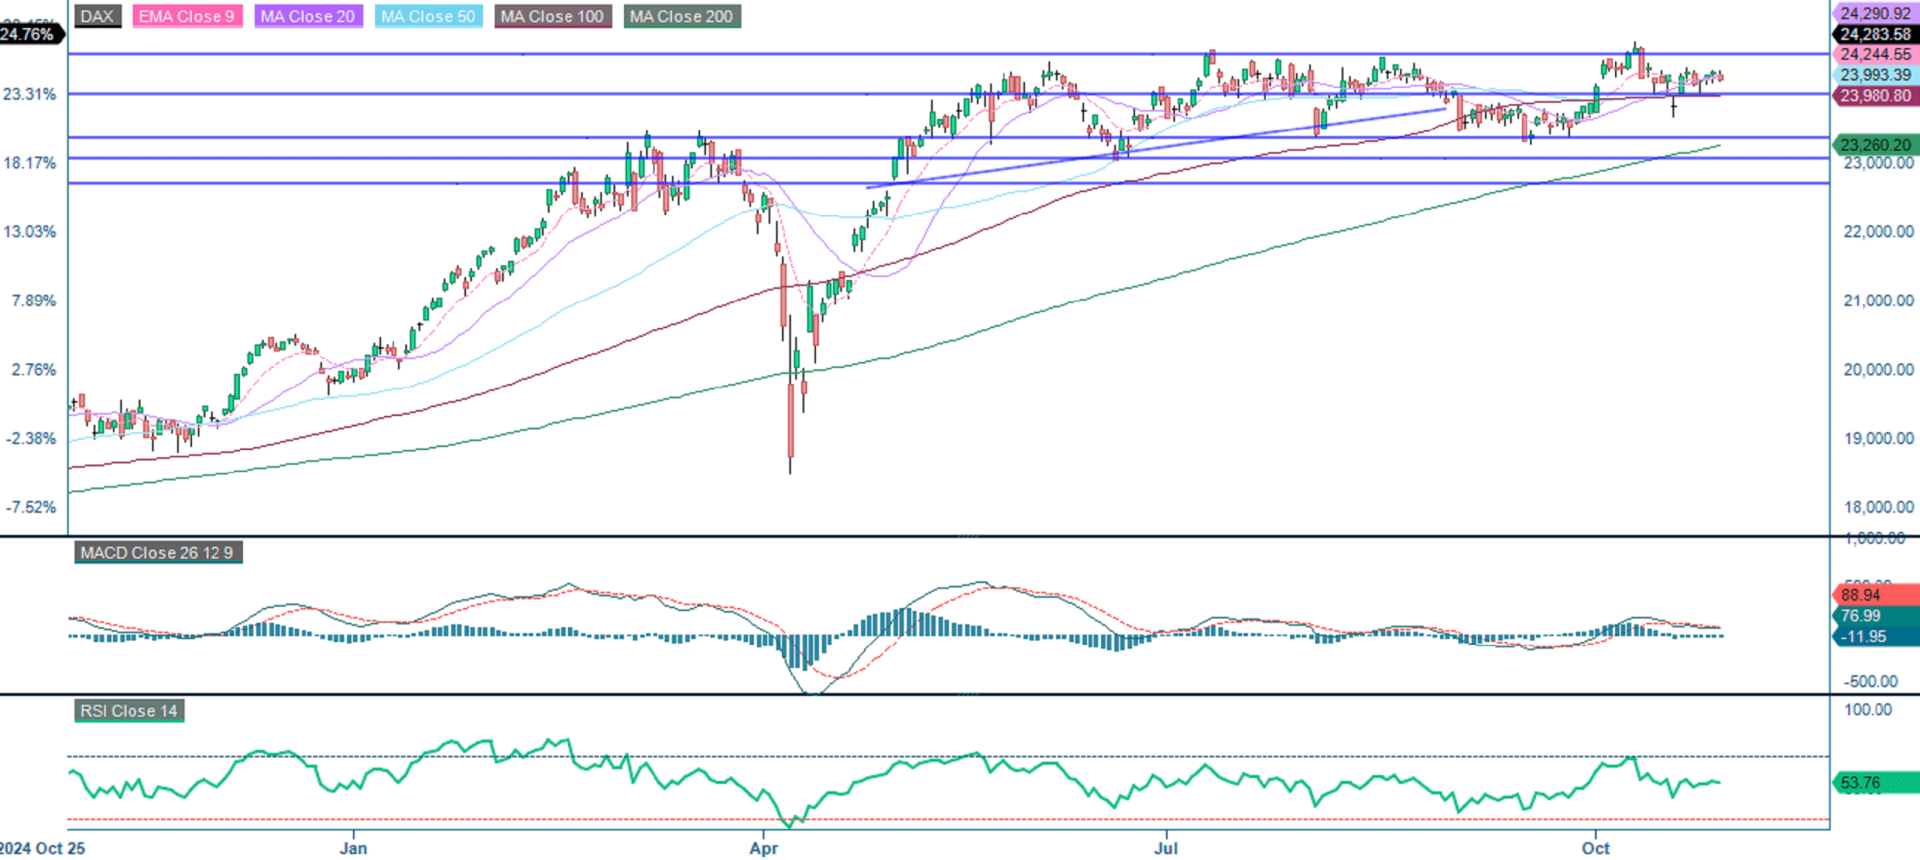
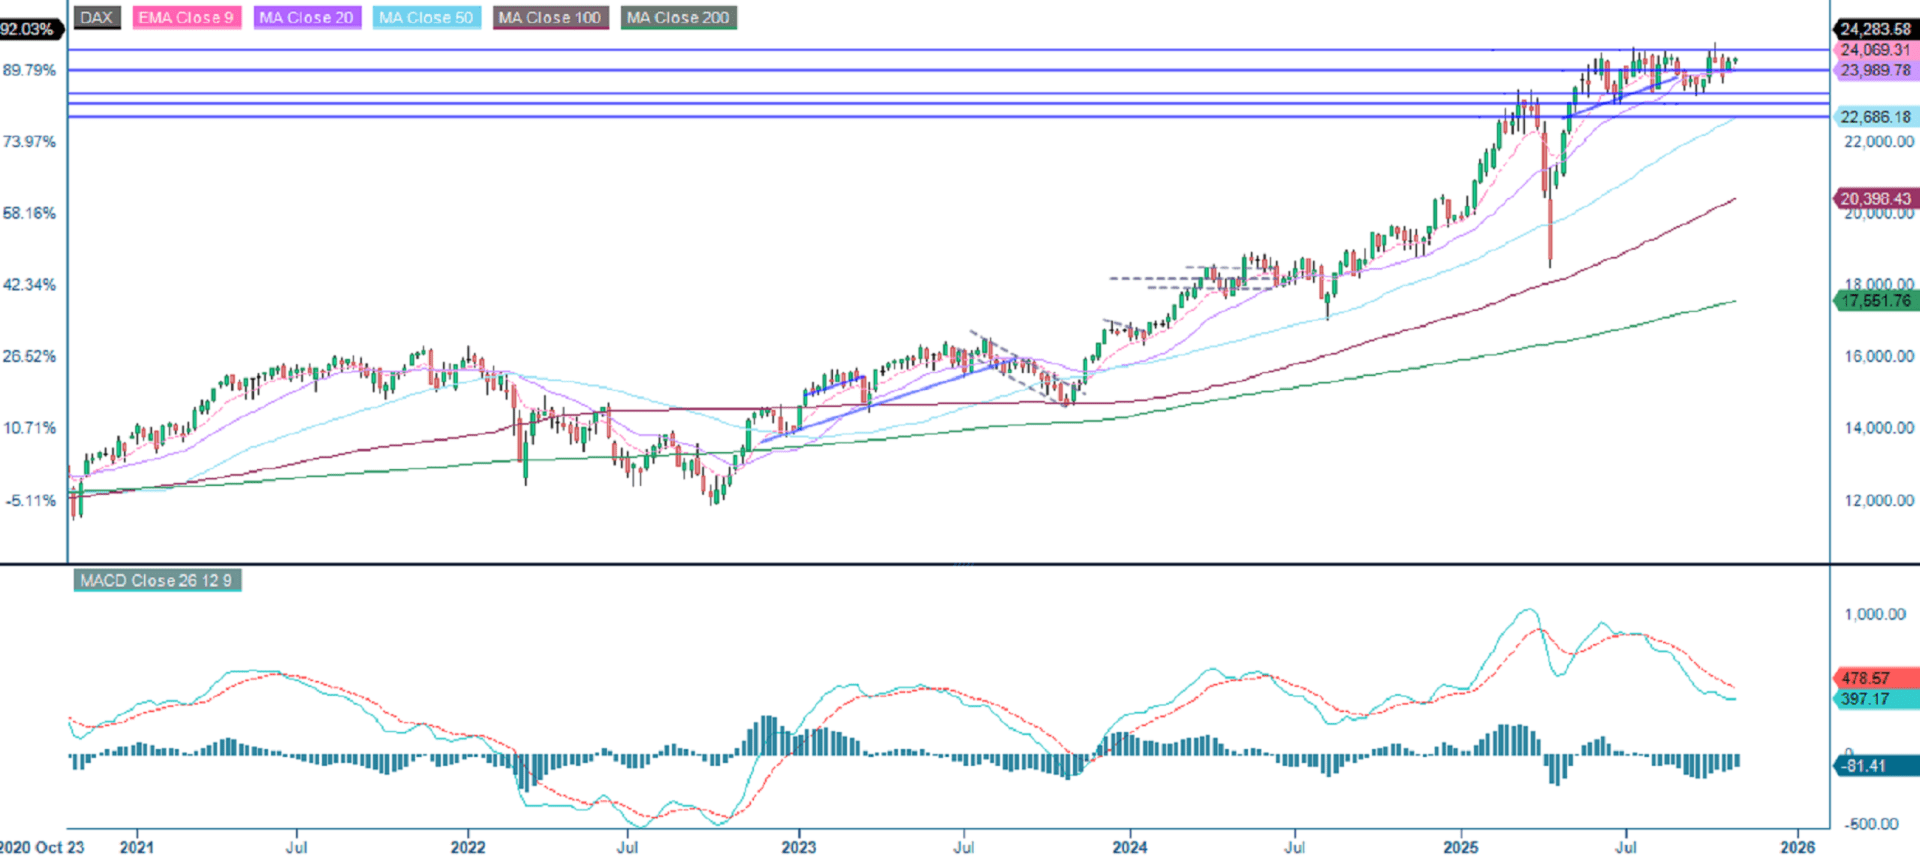
The DAX continues to consolidate, reflecting a pause in directional momentum. Price action is capped by resistance at 24,575, with support established at 24,000 and 23,365. Moving Average Convergence Divergence (MACD) and Relative Strength Index (RSI) (around 53.8) confirm neutral momentum. Overall, the index is in a balanced phase with no clear trend. A sustained break above 24,575 would signal renewed bullish strength, while a drop below 24,000 could pave the way could lead to a further decline towards the 20-day Moving Average (MA200).
Related Products
DAX (in EUR), one-year daily chart
DAX (in EUR), weekly five-year chart
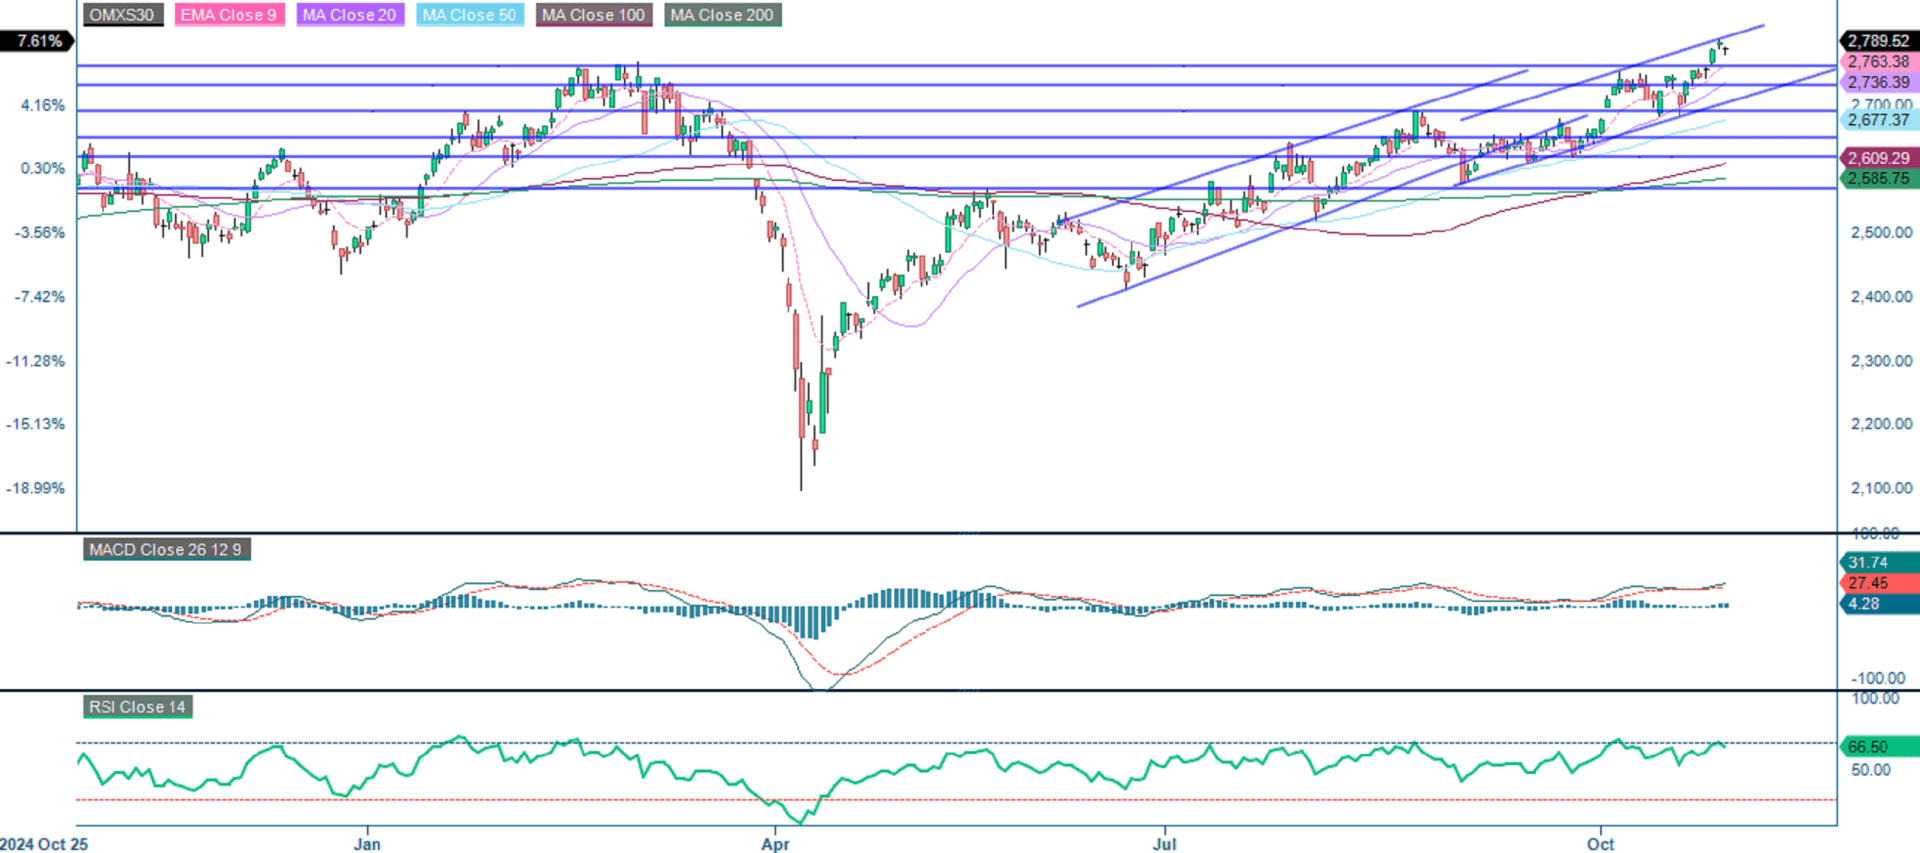
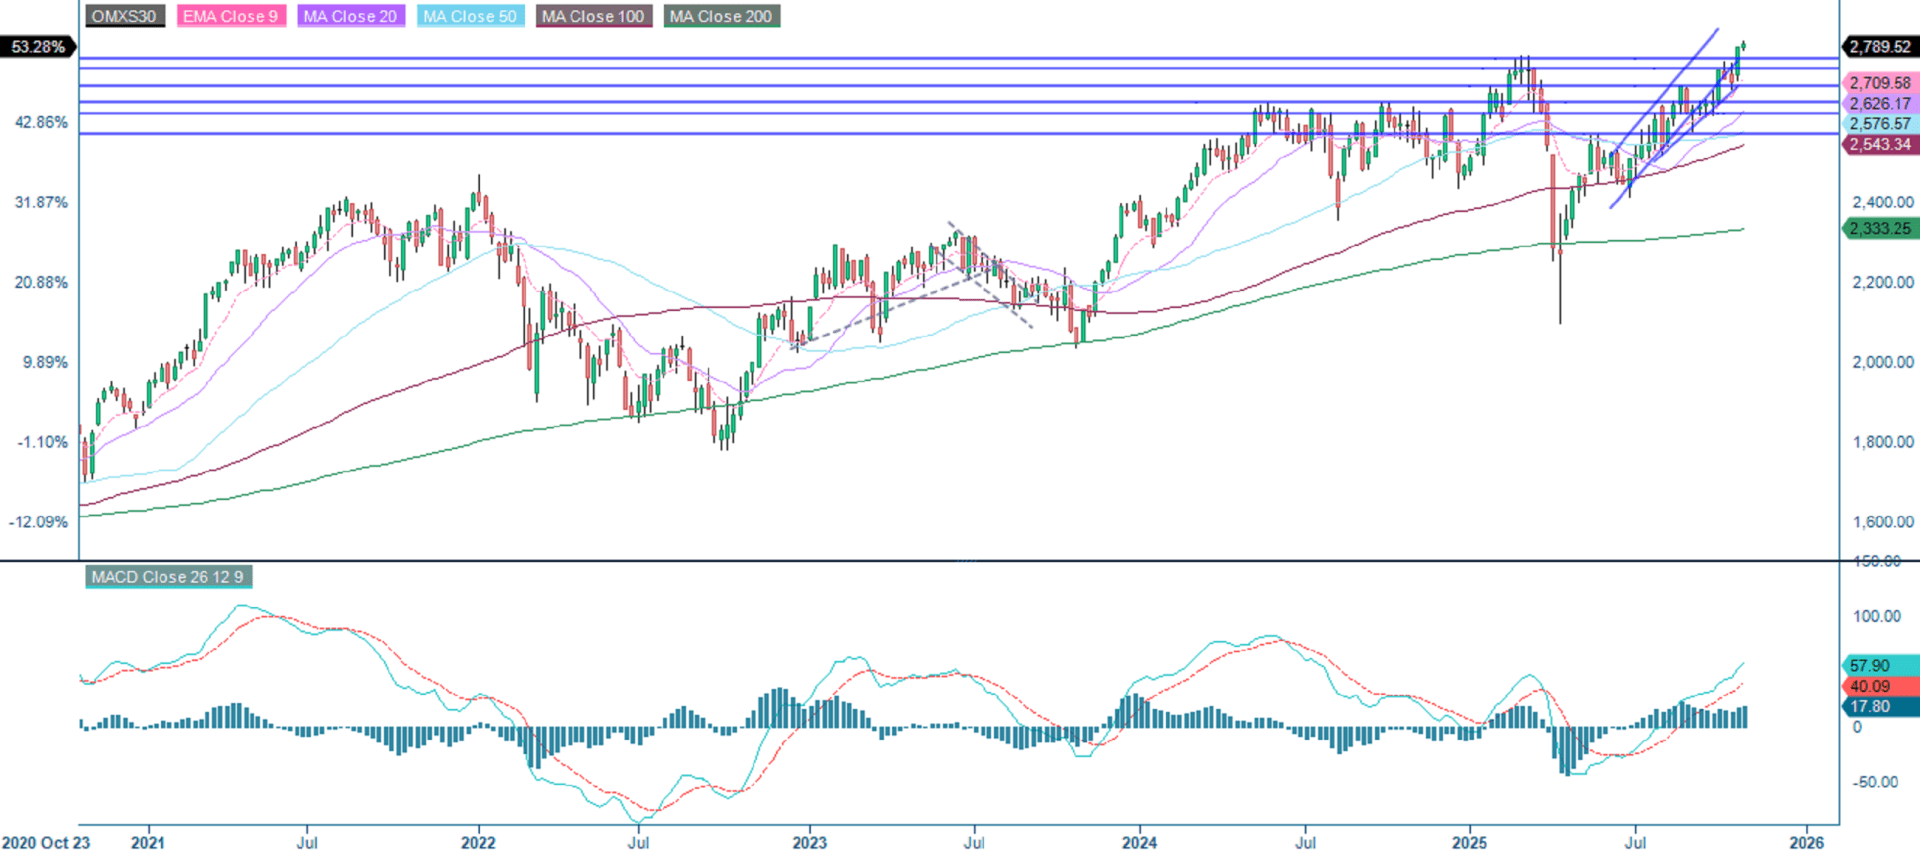
The OMXS30 remains firmly within an uptrend and a rising channel. It is currently testing the upper boundary of this channel, signaling sustained bullish momentum. Recent key resistance levels at 2,760 are now acting as support. All major moving averages are aligned positively, reinforcing the healthy trend. Meanwhile, the Moving Average Convergence Divergence (MACD) shows expanding bullish momentum without divergence. A Relative Strength Index (RSI) of 66.5 indicates strong momentum but suggests there is limited room before overbought conditions are reached. Overall, the outlook remains bullish, though minor pullbacks towards the 2,760 level are possible before further gains are made.
OMX30 (in SEK), one-year daily chart
OMX30 (in SEK), weekly five-year chart
The full name for abbreviations used in the previous text:
EMA 9: 9-day exponential moving average
Fibonacci: There are several Fibonacci lines used in technical analysis. Fibonacci numbers are a sequence in which each successive number is the sum of the two previous numbers.
MA20: 20-day Moving Average
MA50: 50-day Moving Average
MA100: 100-day Moving Average
MA200: 200-day Moving Average
MACD: Moving Average Convergence Divergence
Risks
Credit risk of the issuer:
Investors in the products are exposed to the risk that the Issuer or the Guarantor may not be able to meet its obligations under the products. A total loss of the invested capital is possible. The products are not subject to any deposit protection.
Currency risk:
If the product currency differs from the currency of the underlying asset, the value of a product will also depend on the exchange rate between the respective currencies. As a result, the value of a product can fluctuate significantly.
Market risk:
The value of the products can fall significantly below the purchase price due to changes in market factors, especially if the value of the underlying asset falls. The products are not capital-protected
Product costs:
Product and possible financing costs reduce the value of the products.
Risk with leverage products:
Due to the leverage effect, there is an increased risk of loss (risk of total loss) with leverage products, e.g. Bull & Bear Certificates, Warrants and Mini Futures.
External author:
This information is in the sole responsibility of the guest author and does not necessarily represent the opinion of Bank Vontobel Europe AG or any other company of the Vontobel Group. The further development of the index or a company as well as its share price depends on a large number of company-, group- and sector-specific as well as economic factors. When forming his investment decision, each investor must take into account the risk of price losses. Please note that investing in these products will not generate ongoing income.
The products are not capital protected, in the worst case a total loss of the invested capital is possible. In the event of insolvency of the issuer and the guarantor, the investor bears the risk of a total loss of his investment. In any case, investors should note that past performance and / or analysts' opinions are no adequate indicator of future performance. The performance of the underlyings depends on a variety of economic, entrepreneurial and political factors that should be taken into account in the formation of a market expectation.
Disclaimer:
This information is neither an investment advice nor an investment or investment strategy recommendation, but advertisement. The complete information on the products (securities) mentioned herein, in particular the structure and risks associated with an investment, are described in the base prospectus, together with any supplements, as well as the final terms relating to the securities. The base prospectus and final terms constitute the solely binding sales documents for the products mentioned herein. It is recommended that potential investors read these documents before making any investment decision. The documents and the key information document are published on the website of the issuer, Vontobel Financial Products GmbH, Bockenheimer Landstrasse 24, 60323 Frankfurt am Main, Germany, on https://prospectus.vontobel.com and are available from the issuer free of charge. The approval of the prospectus should not be understood as an endorsement of the securities. The securities are products that are not simple and may be difficult to understand. This information includes or relates to figures of past performance. Past performance is not a reliable indicator of future performance. This information may only be distributed or published in countries where such distribution or publication is permitted by applicable law. As stated in the relevant base prospectus, the distribution of the securities mentioned in this information is subject to restrictions in certain jurisdictions. This advertisement may not be reproduced or redistributed without prior permission by Vontobel.
© Bank Vontobel Europe AG and / or affiliated companies. All rights reserved.