Better third-quarter profits in the US than in Sweden

This week, we ask ourselves: is it time to halt the parabolic growth of the gold price? There are signs that this may be the case, ranging from central banks reducing their gold purchases at the current high price to technical analysis suggesting that gold is overvalued. Meanwhile, the focus of the stock market has now turned to the Q3 reporting season. While 86% of Q3 earnings have exceeded market consensus expectations for S&P 500 companies, the corresponding figure for OMX companies is currently just 63%.
Case of the week: Is it time for a break in the gold rush?
Gold has been a top-performing asset class in 2025, surpassing equities for the second consecutive year. Key drivers have included concerns about trade policy and geopolitics, such as the wars in Ukraine and Gaza, which have dimmed global growth prospects. More recently, the Federal Reserve began cutting interest rates, while the US government shutdown helped push the gold price above USD 3,500 and 4,000 per oz. Political turmoil in France has also increased the appeal of gold.
In recent years, central banks and investors have also been active buyers of gold. This is lilely due to a reduced appetite for US government bonds, following poor bond performance, and concerns that mounting government debt and fiscal irresponsibility could eventually jeopardise the US dollar's status as a reserve currency.
The rally in the gold price is notable from a historical perspective. For instance, the current ratio of the gold price to the oil price, which is around 70, is well above the historical average of 20–30. Similar ratio levels were last seen during the shutdowns of the 2020–21 pandemic.
Ratio of gold (USD per oz) to oil (Brent, USD per barrel) ratio, five-year weekly chart

While the main macroeconomic factors affecting the price of gold are expected to remain significant in the near future, there is a risk that the increase in the gold price has been excessive in the short term. According to S&P Capital IQ/World Gold Council, central banks have already slowed their gold purchases compared to 2023 and 2024. High prices are also negatively impacting jewelry demand. Consequently, ETF flows are becoming relatively more important for demand. If a ceasefire is successfully implemented and constructive peace negotiations are initiated in the Israel-Gaza and Russia-Ukraine conflicts, the desire for perceived safe-haven assets may decrease. Given the parabolic rise in the price of gold, it is also doubtful whether it will function as a hedge in the event of general turmoil and increased volatility in financial markets. Next week's FOMC meeting will be an important event in determining the future direction of gold. However, according to CME FedWatch, a 25 bp rate cut is already widely expected.
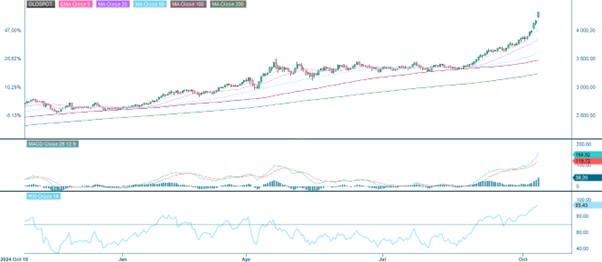
The latest upward movement in an almost parabolic pattern follows the USD 4,000 per oz breakthrough. From a technical perspective, gold is overbought, and a pullback seems likely. It seems likely that there will be a retracement to USD 4,000 per oz to test the recent rally. Further below, the 50-day Moving Average (MA50) at around 3,675 USD per oz could act as technical support.
Related Products
Gold (USD/oz), one-year daily chart
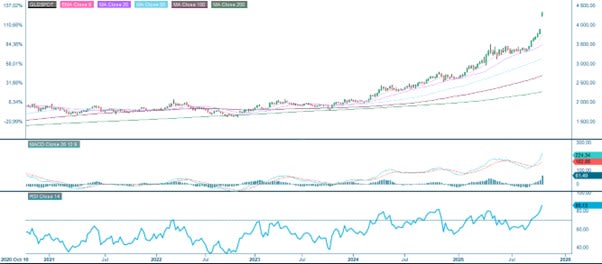
Gold (USD/oz), five-year weekly chart
Macro comments
As of Friday 17 October, approximately 60 companies in the S&P 500 had reported their results for the third quarter of 2025. According to Earnings Insight, 86% of these companies reported positive earnings surprises, while 84% reported positive revenue surprises. On average, the positive earnings surprise for S&P 500 companies that have reported thus far is 5.9%, ranging from 7.7% for consumer discretionary and 5.9% for financials, to 2.4% for information technology, and 1.1% for healthcare.
As of Tuesday, 21 October, 19 Swedish OMX companies had reported their Q3 results. Sixty-three per cent exceeded the market's consensus earnings expectations by a median of three per cent. Meanwhile, 53% of the Q3 reports were better than expected in terms of revenue. However, forward-looking indicators such as Volvo's declining global truck orders suggest that demand has not yet picked up.
The Q3 reporting season continues on Wednesday, 22 October with interim reports from US companies including Amphenol, AT&T, Boston Scientific, GE Vernova Inc., IBM, Lam Research, Tesla, and Thermo Fisher Scientific. In Sweden, companies reporting on Wednesday include Alleima, Boliden, Handelsbanken, JM, SSAB and Thule. Other Nordic companies reporting Q3 results include Aker, DNB, Norwegian and Storebrand. Barclays, which is based in the UK, is also scheduled to report its interim results on Wednesday. The macroeconomic agenda begins with the release of Japan's September trade balance, followed by the UK's September Consumer Price Index (CPI). In the evening, the US Department of Energy will release weekly statistics on oil inventories.
The following major US companies are scheduled to report their quarterly results on Thursday, 23 October: Honeywell International, Intel, Intuitive Surgical, the Blackstone Group, T-Mobile US, and Union Pacific. The following major Swedish companies are reporting their Q3 results on Thursday: AAK, Atlas Copco, Axfood, Castellum, Essity, Holmen, SEB, Swedbank, Telia and Volvo Cars. Other Nordic companies reporting their Q3 results include DSV, Elisa, Kone, Konecranes and Metso. Thursday's macroeconomic agenda begins with the release of French industrial expectations for October. This is followed by the UK CBI industrial trends and the Eurozone confidence indicator, both for October. From the US, we have the Chicago Fed Index and existing home sales for September, as well as the Kansas City Fed Index for October.
Procter & Gamble is set to release an interim report on Friday, 24 October. The major Swedish companies due to publish their interim results include Hexagon, Lagercrantz, Munters, Saab, SCA and Trelleborg. Friday's macroeconomic agenda is dominated by the release of October's Purchasing Managers’ Index (PMI) figures from Japan, India, France, Germany, the Eurozone, the UK and the US. Japan's September CPI will also be released early this morning. The UK will publish retail sales figures for September, while France will release an October household confidence indicator. From the US, we are awaiting the September CPI (see the graph below), the October Michigan index, and September's new home sales figures.
US Core Consumer Price Index: forecast from October 2020 to September 2025

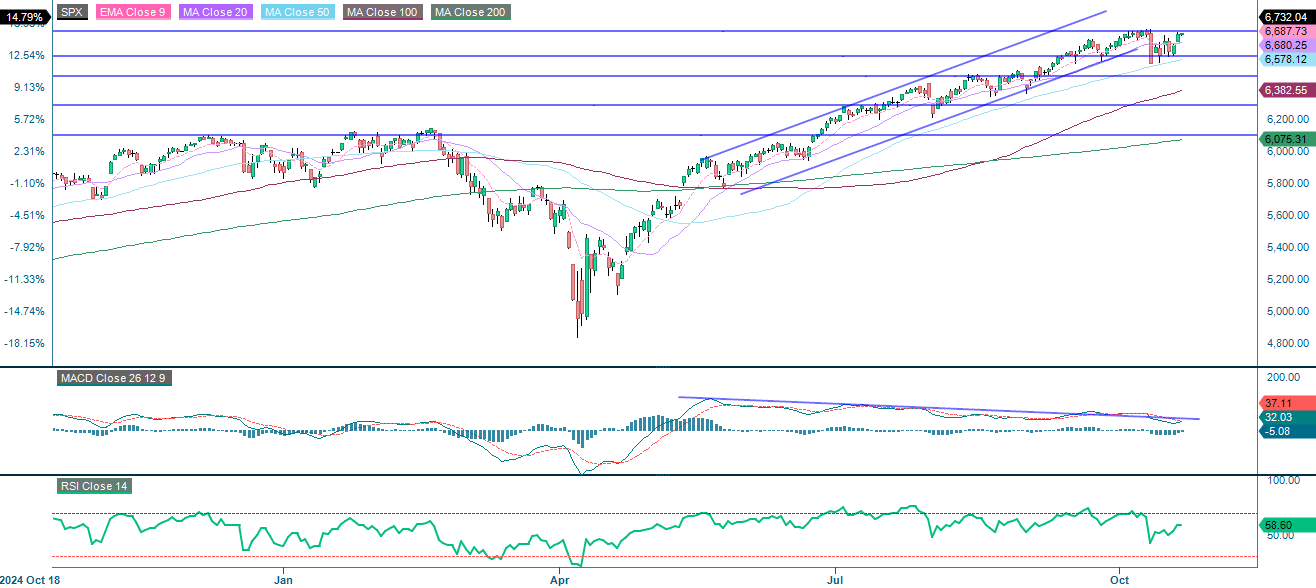
Time for a new all-time high in the US?
The S&P 500 is approaching the 6,750-resistance level. Breaking through this level would maintain a bullish outlook in the short and long term, though fading momentum suggests a potential period of consolidation if resistance holds. Support on the downside is found close to 6,600.
Related Products
S&P 500 (in USD), one-year daily chart
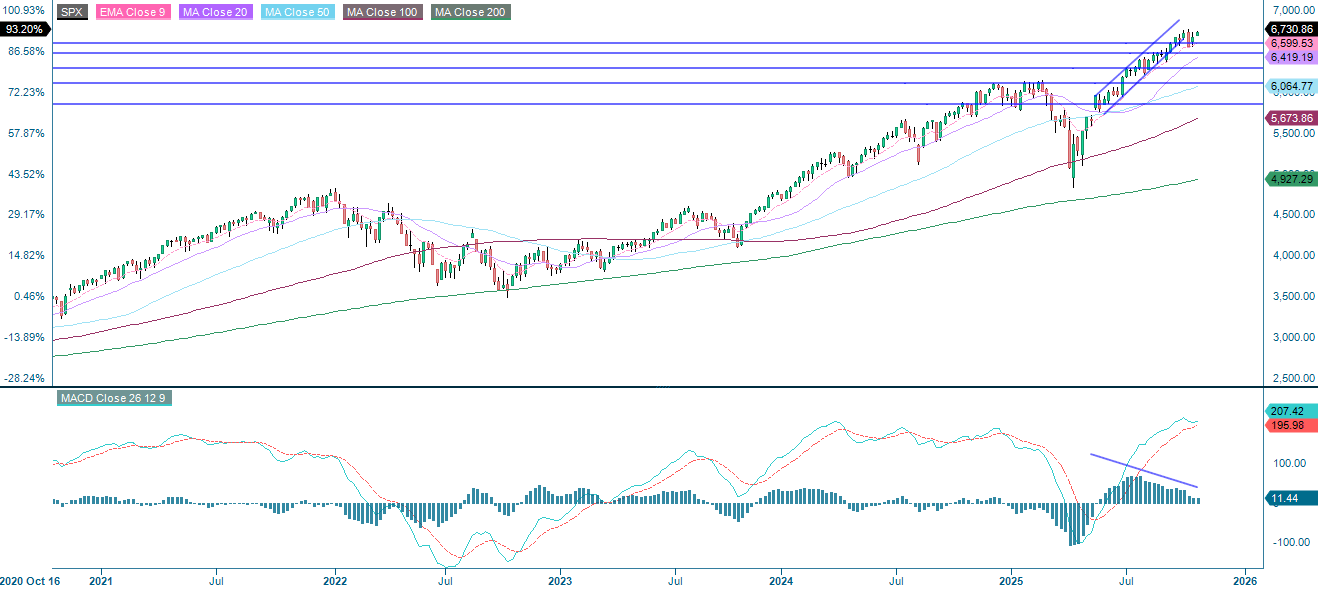
S&P 500 (in USD), weekly five-year chart
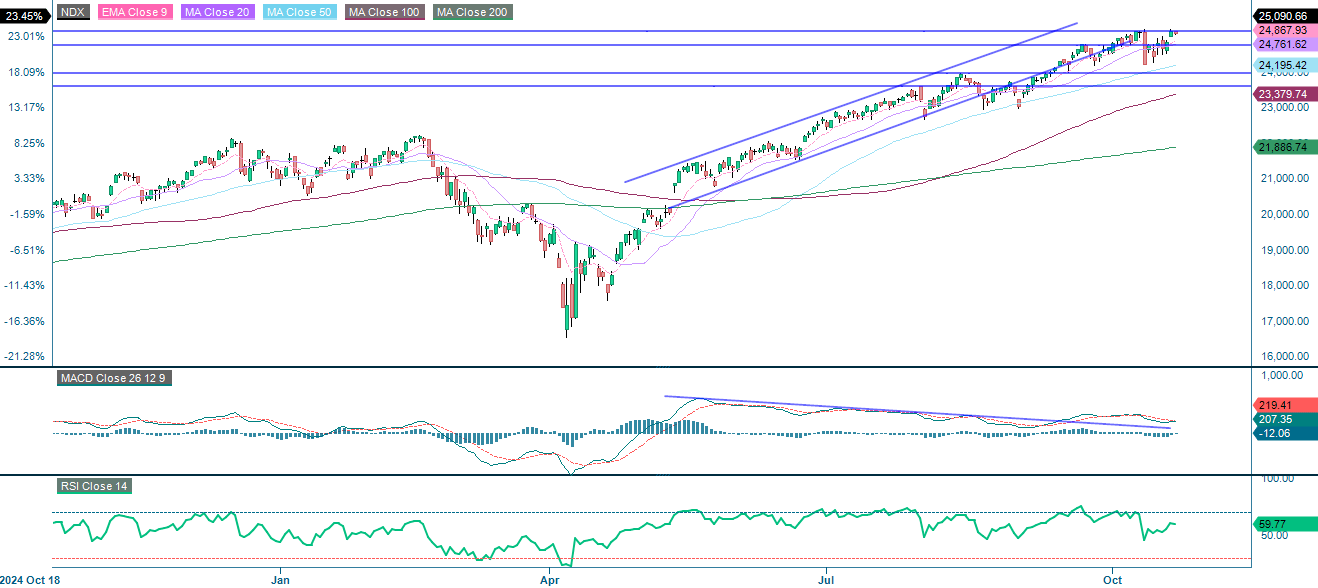
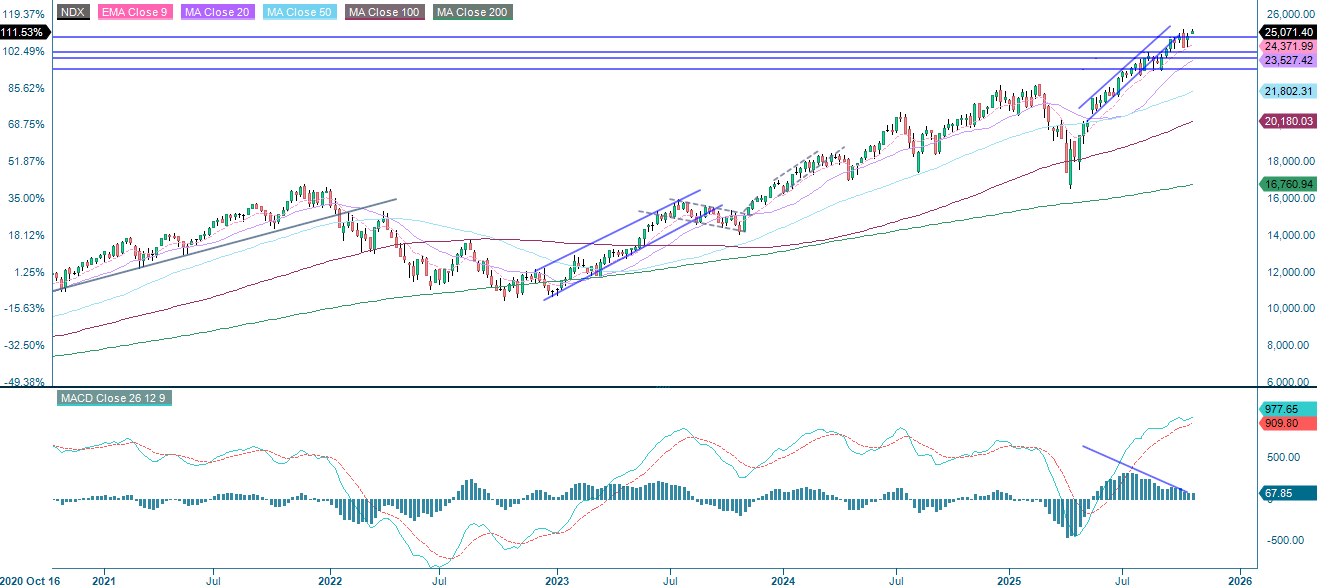
The NASDAQ-100 is trading above all key moving averages, which confirms strong upward momentum. Resistance is seen at 25,140. While the Moving Average Convergence Divergence ('MACD') remains positive, it shows fading strength; the Relative Strength Index ('RSI'), meanwhile, at 59.77, suggests mild overbought conditions. The outlook remains bullish as long as the 20-day Moving Average ('MA20'), currently at 24,760, holds on the downside.
Related Products
NASDAQ-100 (in USD), one-year daily chart
NASDAQ-100 (in USD), weekly five-year chart
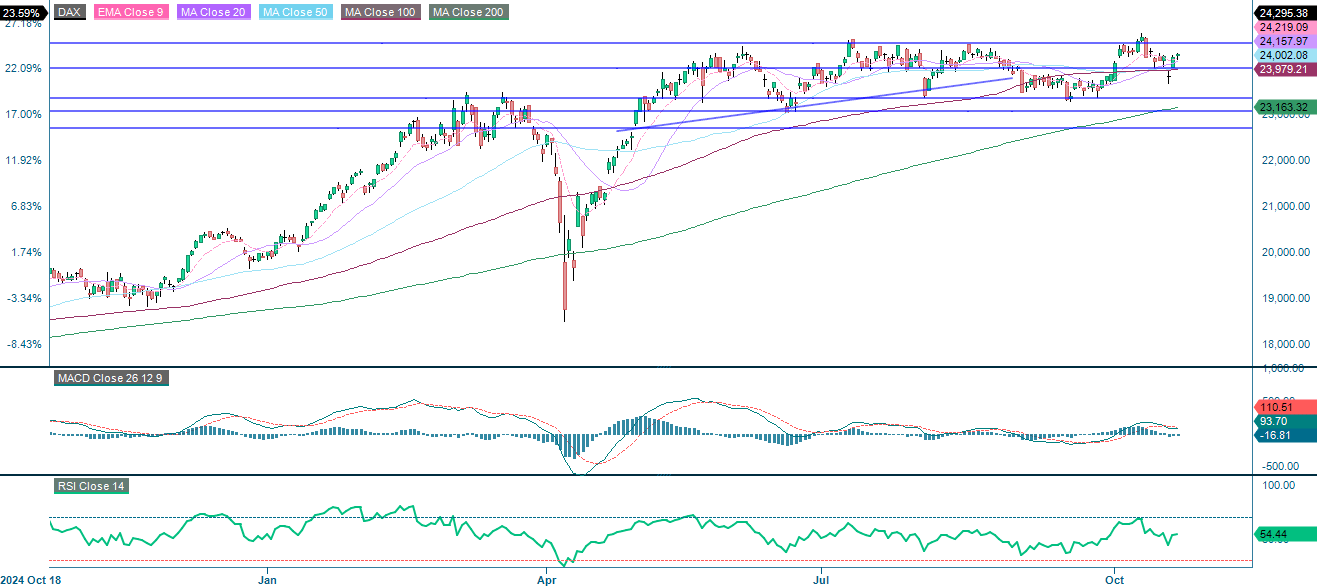
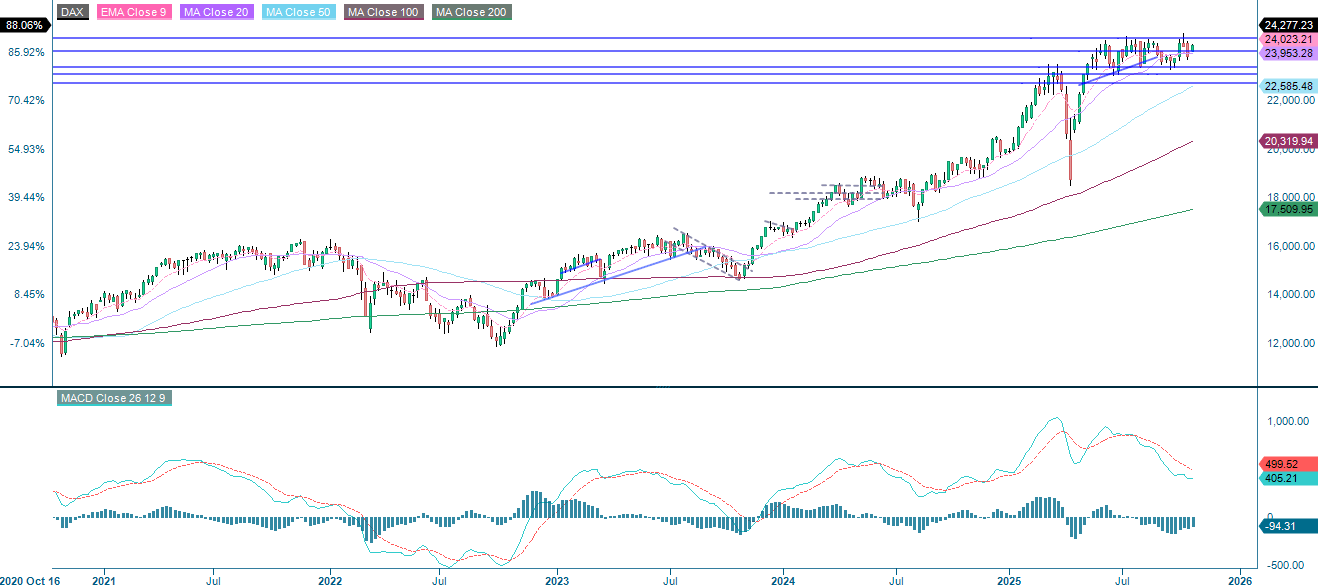
The German DAX is currently trading at around 24,280. All major moving averages are sloping upwards, supporting a mildly bullish outlook. Momentum remains neutral, with the MACD showing a slight positive bias and the RSI standing at 54.44. The index is facing resistance at 24,575 and support at 24,000. A breakout above the resistance level could signal further gains, while a drop below 24,000 would suggest renewed downward pressure.
Related Products
DAX (in EUR), one-year daily chart
DAX (in EUR), weekly five-year chart
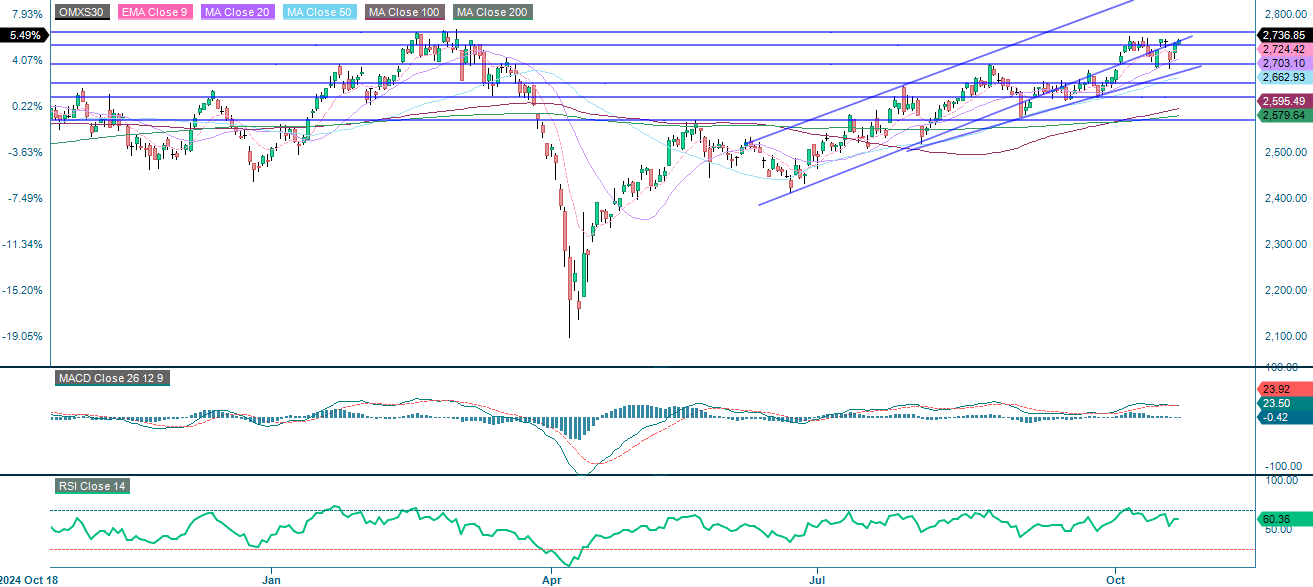
The OMXS30 continues to advance steadily within a rising channel, holding above all key moving averages and confirming a strong uptrend. Momentum remains mildly bullish, with the MACD showing a slight positive bias and the RSI standing at 60.36, which indicates limited but ongoing upside potential. Resistance is at 2,760, with support at 2,730 and 2,700.
OMX30 (in SEK), one-year daily chart
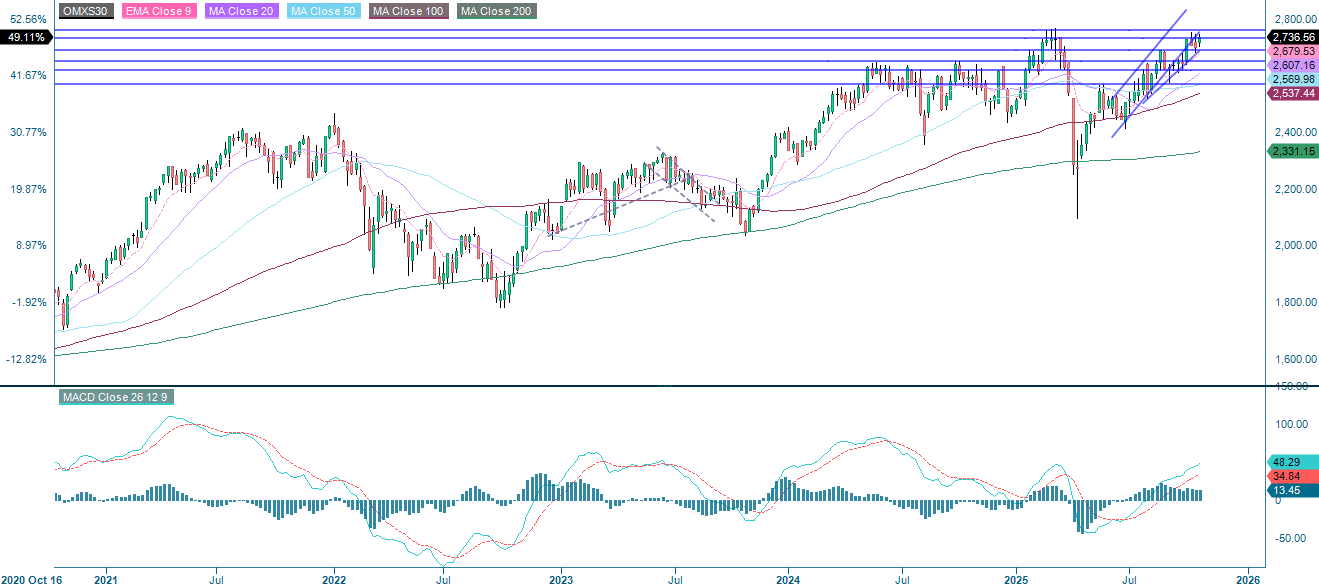
OMX30 (in SEK), weekly five-year chart
The full name for abbreviations used in the previous text:
EMA 9: 9-day exponential moving average
Fibonacci: There are several Fibonacci lines used in technical analysis. Fibonacci numbers are a sequence in which each successive number is the sum of the two previous numbers.
MA20: 20-day Moving Average
MA50: 50-day Moving Average
MA100: 100-day Moving Average
MA200: 200-day Moving Average
MACD: Moving Average Convergence Divergence
Risks
Credit risk of the issuer:
Investors in the products are exposed to the risk that the Issuer or the Guarantor may not be able to meet its obligations under the products. A total loss of the invested capital is possible. The products are not subject to any deposit protection.
Currency risk:
If the product currency differs from the currency of the underlying asset, the value of a product will also depend on the exchange rate between the respective currencies. As a result, the value of a product can fluctuate significantly.
Market risk:
The value of the products can fall significantly below the purchase price due to changes in market factors, especially if the value of the underlying asset falls. The products are not capital-protected
Product costs:
Product and possible financing costs reduce the value of the products.
Risk with leverage products:
Due to the leverage effect, there is an increased risk of loss (risk of total loss) with leverage products, e.g. Bull & Bear Certificates, Warrants and Mini Futures.
External author:
This information is in the sole responsibility of the guest author and does not necessarily represent the opinion of Bank Vontobel Europe AG or any other company of the Vontobel Group. The further development of the index or a company as well as its share price depends on a large number of company-, group- and sector-specific as well as economic factors. When forming his investment decision, each investor must take into account the risk of price losses. Please note that investing in these products will not generate ongoing income.
The products are not capital protected, in the worst case a total loss of the invested capital is possible. In the event of insolvency of the issuer and the guarantor, the investor bears the risk of a total loss of his investment. In any case, investors should note that past performance and / or analysts' opinions are no adequate indicator of future performance. The performance of the underlyings depends on a variety of economic, entrepreneurial and political factors that should be taken into account in the formation of a market expectation.
Disclaimer:
This information is neither an investment advice nor an investment or investment strategy recommendation, but advertisement. The complete information on the products (securities) mentioned herein, in particular the structure and risks associated with an investment, are described in the base prospectus, together with any supplements, as well as the final terms relating to the securities. The base prospectus and final terms constitute the solely binding sales documents for the products mentioned herein. It is recommended that potential investors read these documents before making any investment decision. The documents and the key information document are published on the website of the issuer, Vontobel Financial Products GmbH, Bockenheimer Landstrasse 24, 60323 Frankfurt am Main, Germany, on https://prospectus.vontobel.com and are available from the issuer free of charge. The approval of the prospectus should not be understood as an endorsement of the securities. The securities are products that are not simple and may be difficult to understand. This information includes or relates to figures of past performance. Past performance is not a reliable indicator of future performance. This information may only be distributed or published in countries where such distribution or publication is permitted by applicable law. As stated in the relevant base prospectus, the distribution of the securities mentioned in this information is subject to restrictions in certain jurisdictions. This advertisement may not be reproduced or redistributed without prior permission by Vontobel.
© Bank Vontobel Europe AG and / or affiliated companies. All rights reserved.