A good start to the US Q3 reporting season

This week's case is that the USD has the potential to strengthen against the GBP, given that the US economy is performing better than the UK economy in terms of growth and productivity. This should generate capital flows in support of a long USD/GBP position. The Q3 2025 reporting season got off to a good start yesterday, with major US banks and companies such as Johnson & Johnson clearly outperforming analysts’ earnings expectations. Our technical analysis considers whether now is a good time to buy following President Trump's threat to impose new, higher tariffs on China. Is this another TACO trade?
Case of the week: Return of the greenback, a potential to short cable
The US dollar has been weak for most of 2025, with other major currencies gaining ground against the dollar (“the greenback”). This decline is due to several factors, including uncertainty relating to President Trump’s tariffs and rate cuts, with many traders opting for other markets or investments, such as gold. Among the other major currencies, the GBP (colloquially known as 'cable') has performed relatively well, with the CHF gaining the most against the US dollar and the CAD gaining the least.
USD compared to other major currencies, five-year chart

More recent factors that have weighed on the USD are the government shutdown, now in its second week, and the announcement of higher tariffs against China. Regarding the former, the shutdown is set to enter a third week, with disagreements surrounding federal spending levels and health insurance subsidies ongoing. There is no indication that the situation will be resolved soon, which is moving the spotlight further away from the greenback and towards 'safer' investments such as gold. Regarding the latter, Trump initially indicated that he would raise tariffs on Chinese exports to the USA by 100%. This followed Beijing's unveiling of more export controls on rare earth minerals, which are critical for the US tech sector.
However, both issues could be soon resolved. On Monday 13 October, Trump indicated that the US could soften its stance on tariffs. In terms of the government shutdown, pressure is mounting from furloughed employees. For example, the 2018–19 shutdown lasted around a month. If history repeats itself, this will mean that we should already be past the halfway point. Furthermore, although nonfarm payrolls were significantly revised downwards — the largest downward revision since 2000 — productivity is still up in the USA. Additionally, both disposable personal income and personal spending are increasing, suggesting resilience against rising prices and mounting unemployment. Taken together, these factors could contribute to a resurgence in the US dollar, especially since the US stock markets continue to soar towards new record levels.
Across the Atlantic, the mood in the UK appears less joyous. While some variables are moving in the same direction as in the US, others are painting a more stagnant picture. While GDP growth remains strong in the USA, clocking in at 3.8% in Q2 2025, the corresponding figure for the UK is at 0.3%. Furthermore, government borrowing reached a five-year high in August, prompting the street to expect more tax raises in the autumn budget, to be presented by chancellor Rachel Reeves on November 26. Combined, the debt and stagnant performance caused the GBP to slip.
Overall, the greenback appears to have more momentum than the pound sterling, suggesting an opportunity to short cable. As Steve Englander, head of currencies research at Standard Chartered, wrote in a note to clients, 'We see a path by which dollar exceptionalism can be maintained through rapid productivity and profits growth, and consequent strong capital inflows', as quoted in the Financial Times. However, one should note that many key US data points are yet to be released owing to the government shutdown. Thus, there is more uncertainty than usual associated with betting on cable. However, if the US federal government shutdown ends at the end of October, a large amount of economic information will be released just before the FOMC interest rate decision on 29 October. This creates an interesting opportunity for bold traders, as betting on the USD looking more favourable than on the GBP.
GBP/USD, one-year daily chart

GBP/USD, five-year weekly chart

Macro comments
On Friday 10 October, the S&P 500 fell by 2.7%, while the EURO STOXX fell by 1.5%, after President Trump announced on Truth Social that the US would increase tariffs on Chinese goods to 100%. However, the stock markets recovered on Monday 13 October, with the S&P 500 rising by 1.6% and the EURO STOXX 600 by 0.3%.
The US government administration has now begun to shut down, resulting in the dismissal of a significant number of federal employees. Republicans and Democrats in Congress hold very different views on how to solve the issue of the US federal budget deficit.
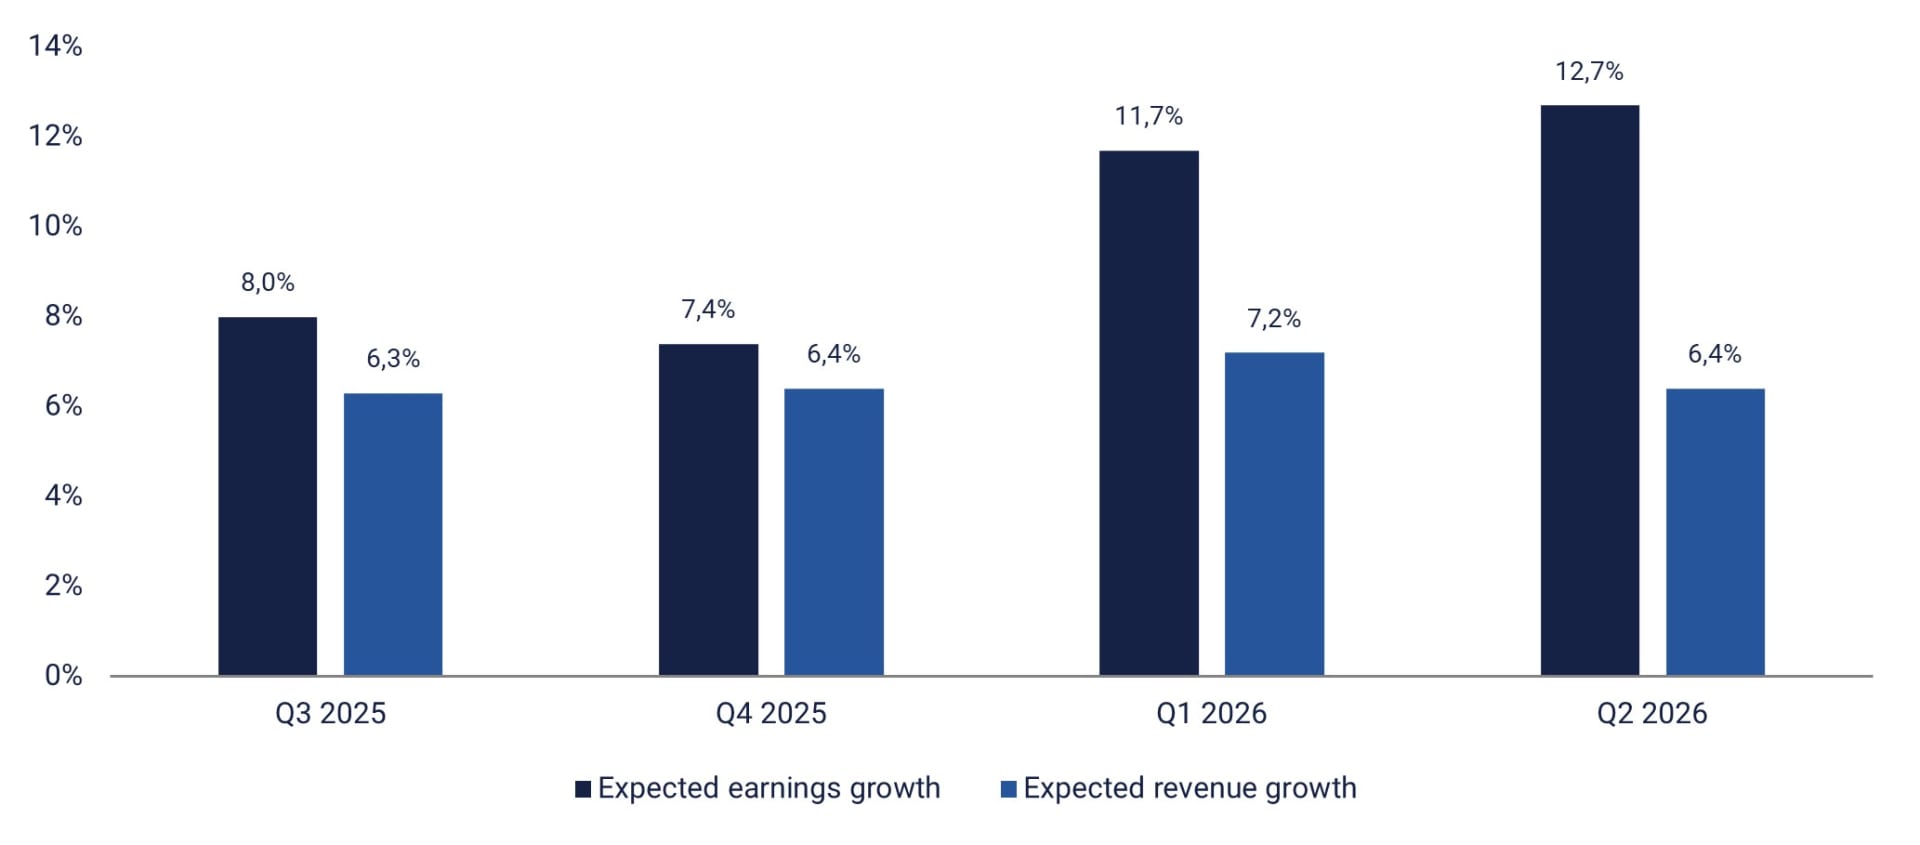
The Q3 2025 reporting season for S&P 500 companies began this week with Fastenal's Q3 results on Monday, 13 October, that was followed yesterday (Tuesday, 14 October) by interim reports from BlackRock, Citigroup, Goldman Sachs, Johnson & Johnson, JPMorgan Chase & Co, and Wells Fargo & Co. Although Fastenal's results were 3% below analysts' estimates on Monday. However, the six companies mentioned all beat the stock market's earnings expectations by around 8% on average when they reported yesterday.
As the graph below shows, Wall Street analysts are optimistic about S&P 500 corporate earnings over the next four quarters.
Expected earnings and revenue growth of S&P 500 companies in Q3 2025 to Q2 2026
The following companies are set to release their interim reports on Wednesday, 15 October: Abbott Laboratories, ASML Holding, Bank of America, Morgan Stanley, Prologis and Progressive (all US-based), and Rio Tinto (Canada-based). The macroeconomic agenda begins with China's September Consumer Price Index (CPI) and Producer Price Index (PPI) figures. This will be followed by Japan's final industrial production figures for August. Next, we will look at Sweden's CPI and Germany's wholesale prices, both for September. Then, the CPI figures for September from France and Spain are due. Finally, we will await the Eurozone's industrial production figures for August. From the US, we will consider the Empire State Manufacturing Survey for October and the Department of Energy's weekly oil stock statistics.
On Thursday, 16 October, more Q3 reports will be released, including those from ABB, EQT, Kinnevik, Investor and Industrivärden in Sweden, Nordea (headquartered in Helsinki, Finland, but also quoted on the Stockholm Stock Exchange), Charles Schwab, Interactive Brokers, Intuitive Surgical and Marsh & McLennan Companies in the United States, and Taiwan Semiconductor in Asia. The release of macro statistics begins on Thursday with Japan's machinery orders in August. This is followed by: UK GDP and industrial production in August. Next are Italy's CPI for September and the Eurozone's trade balance for August. The US macroeconomic calendar includes PPI and retail sales figures for September; the Philadelphia Fed Index and the NAHB Housing Market Index for October; and weekly jobless claims and unsold inventory figures for August.
On Friday, 17 October, we will receive interim reports from the following companies: Volvo, Avanza and Autoliv in Sweden; Tomra and Yara in Norway; and American Express in the US. Turning to the macro agenda, we will first examine Sweden's unemployment rate for September, followed by the Eurozone's CPI for the same month. From the US, we are awaiting September's figures on housing construction, import prices and industrial production, as well as Redbook's weekly retail sales data.
Is this a good time to buy the dip?
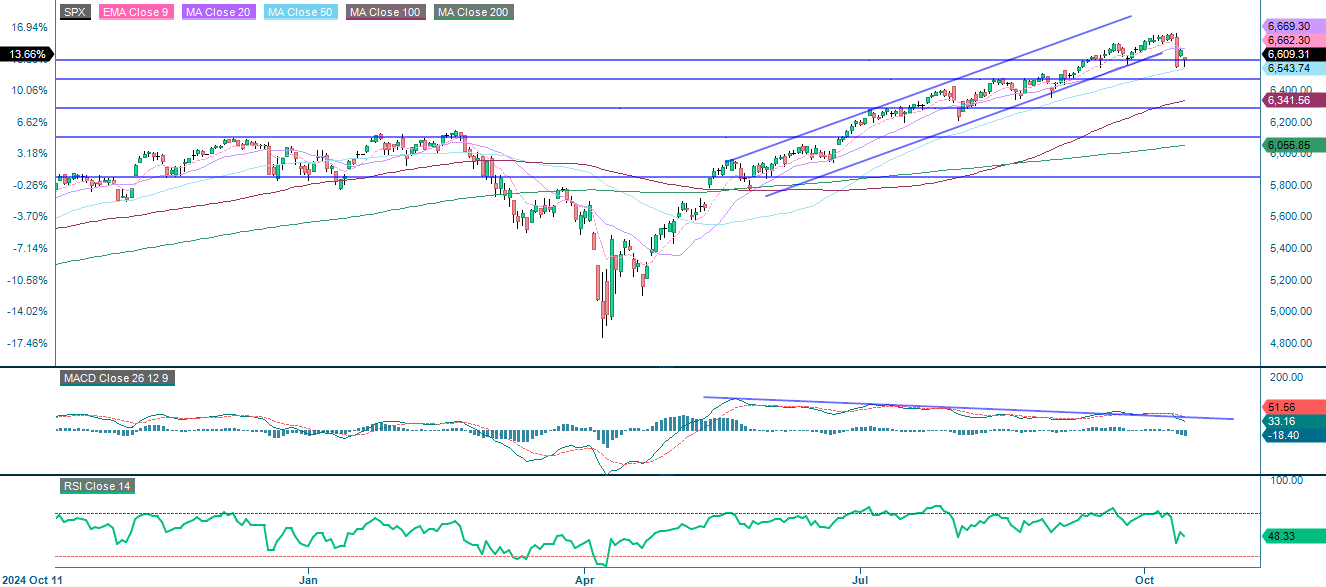
The S&P 500 index remains in a long-term uptrend, having broken below the 20-day moving average (MA20) on Friday, 10 October. After attempting to regain the MA20 level, the index pulled back to around 6,550, aligning with the key support level of the 50-day moving average (MA50), which is currently around 6,540. Can the index remain above the MA50 and keep the bullish structure intact? Is this an opportunity to buy the dip? Conversely, momentum has weakened, as indicated by a bearish crossover in the Moving Average Convergence Divergence (MACD) and a Relative Strength Index (RSI) of around 48, which signals neutrality. Breaking below 6,540 could lead to a decline towards 6,475, followed by a 100-day moving average (MA100), which is currently around 6,340.
Related Products
S&P 500 (in USD), one-year daily chart
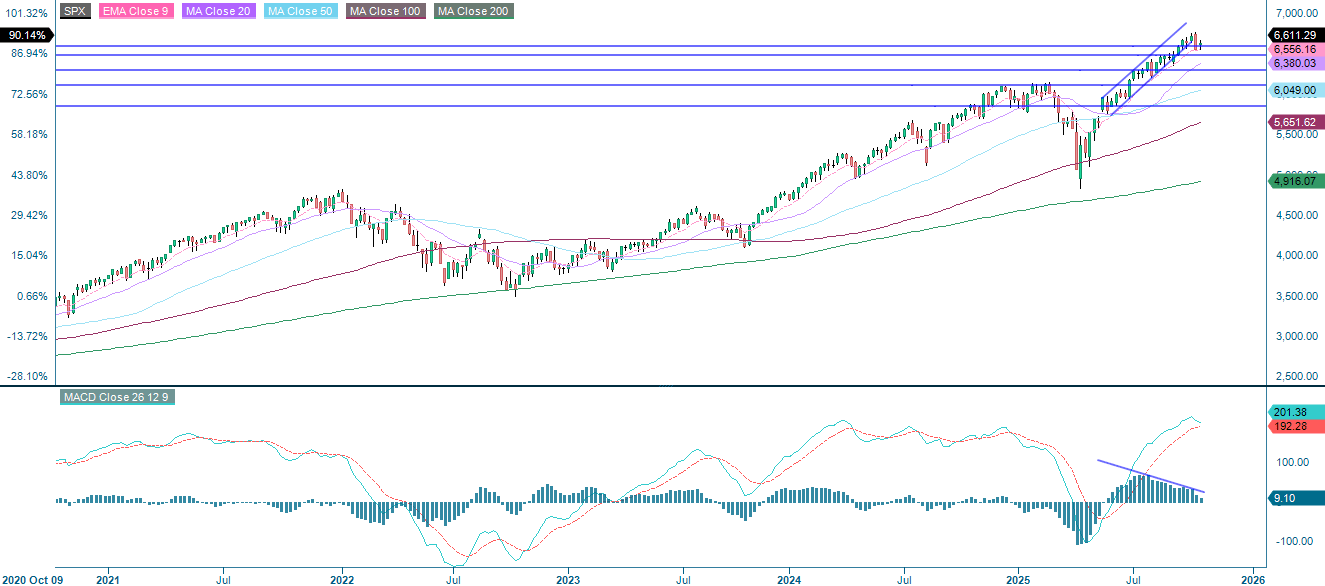
S&P 500 (in USD), weekly five-year chart
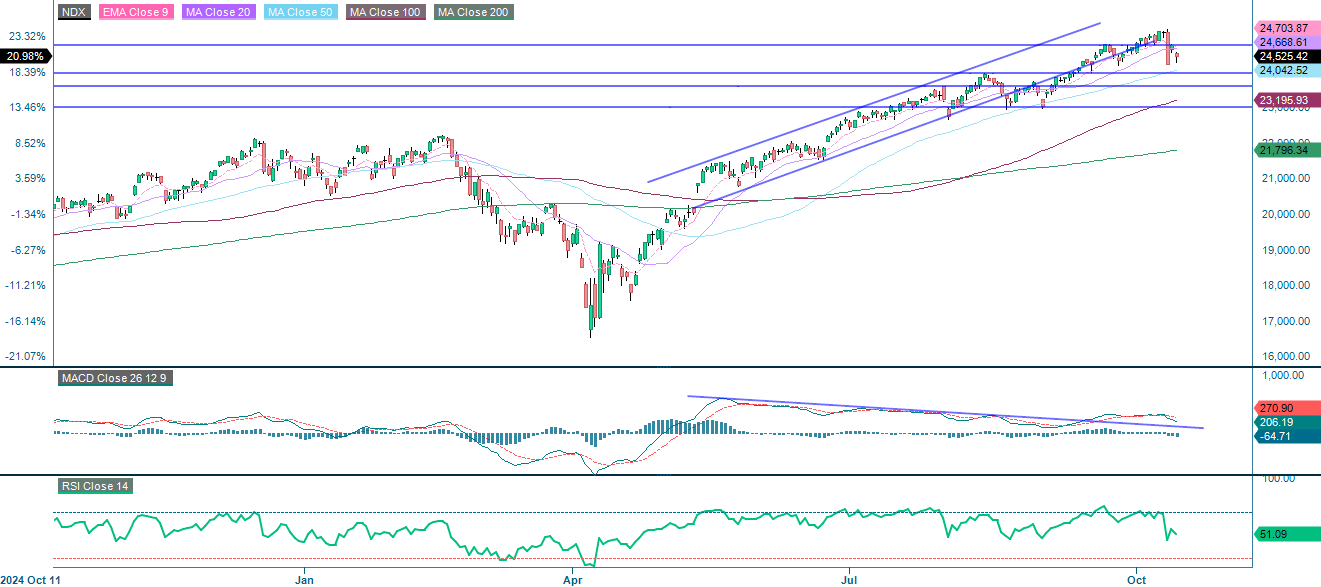
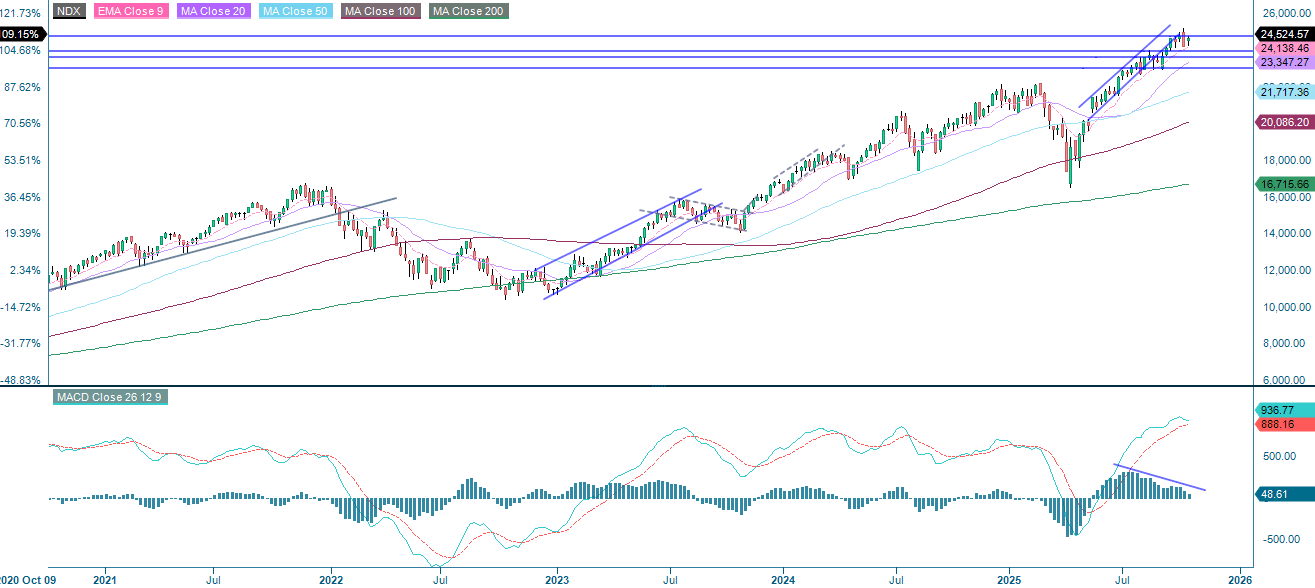
The NASDAQ-100 chart looks like the S&P 500 chart, as both indices remain in a long-term uptrend. Following Friday's bear market, the index attempted to regain momentum, encountering resistance at around 24,755. Like the S&P 500, the NASDAQ-100 is also trading below the MA20, as momentum has softened. Breaking below 24,000 could pave the way to 23,595, followed by the MA100, which is currently around 23,195.
Related Products
NASDAQ-100 (in USD), one-year daily chart
NASDAQ-100 (in USD), weekly five-year chart
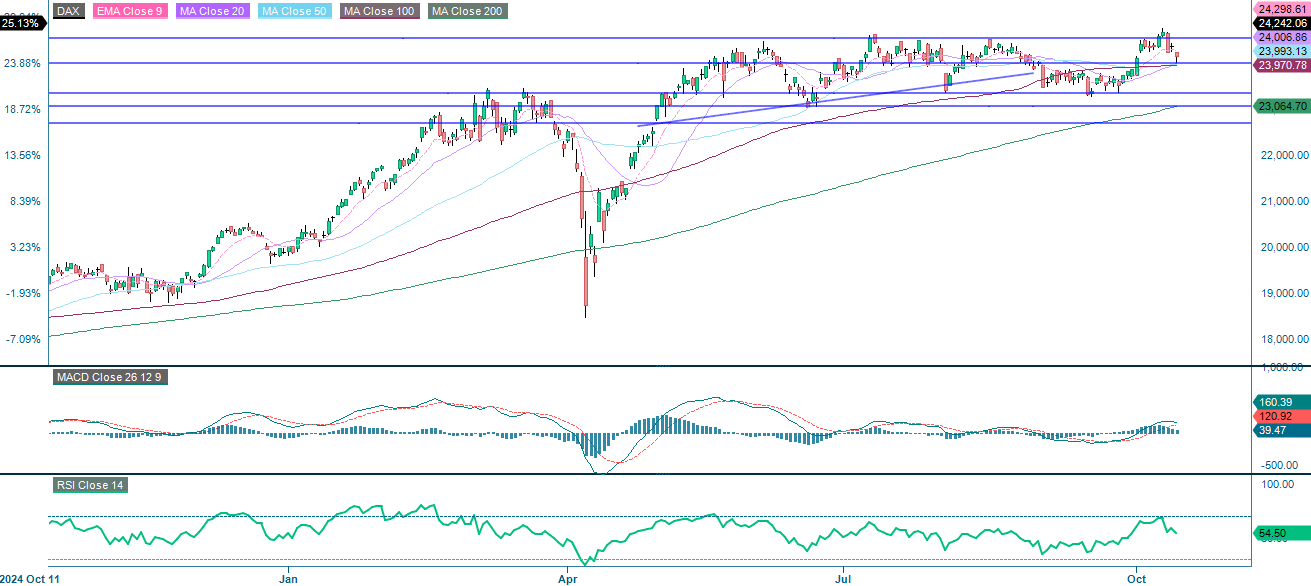
The DAX remains within a channel ranging from 23,360 to 24,550, with the current price close to the support level of 24,000. Momentum is steady but softening, and a Relative Strength Index (RSI) of 54 indicates neutrality with modest upside potential. Remaining above 24,000 would preserve the bullish structure and could trigger a rebound towards 24,360. Conversely, falling below 24,000 could lead to a more significant pullback towards 23,360.
Related Products
DAX (in EUR), one-year daily chart
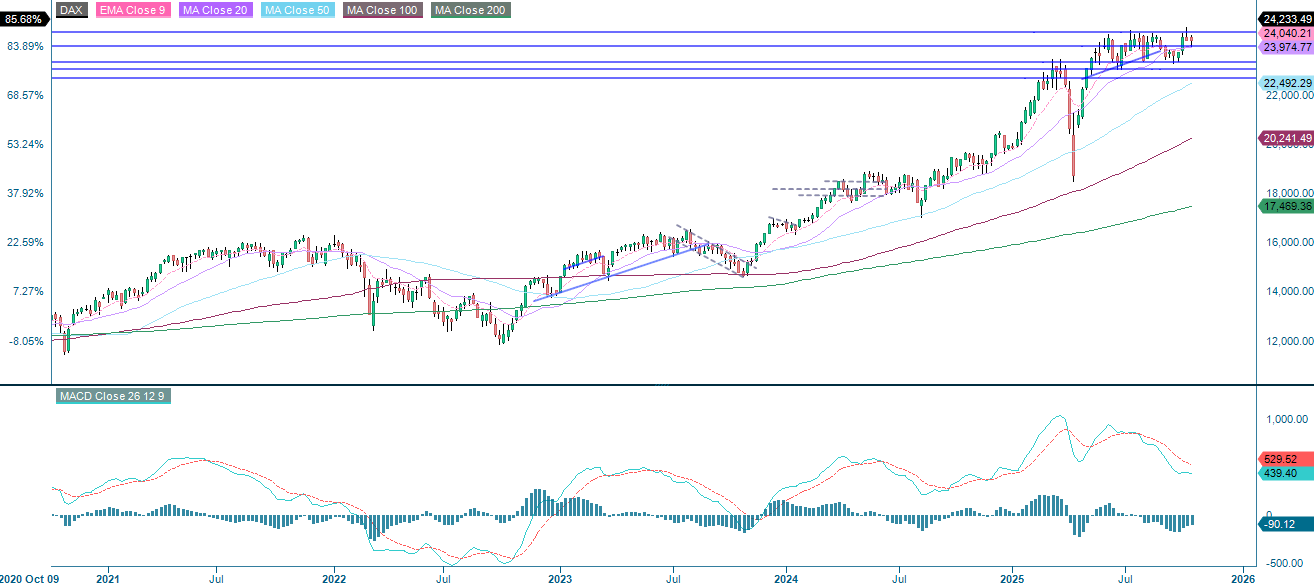
DAX (in EUR), weekly five-year chart
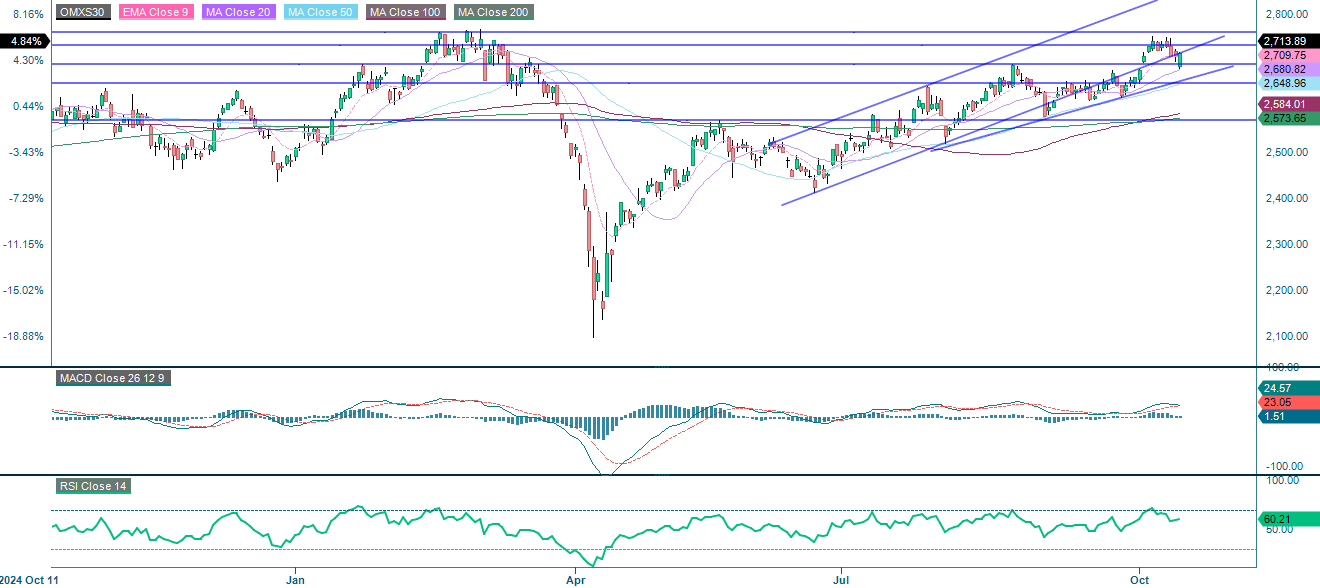
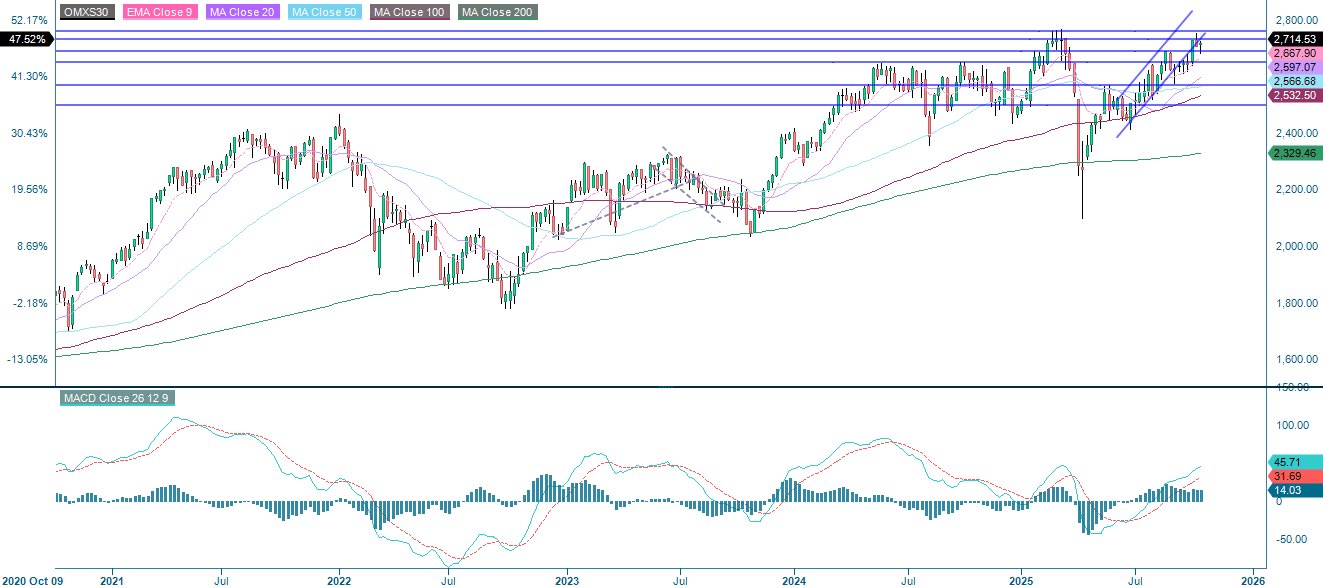
The OMXS30 remains in a solid uptrend. After retreating from the 2,680-resistance level, which is aligned with the MA20, the index bounced back. Momentum is fading slightly, while the RSI of 60 remains bullish but below overbought levels. Staying above 2,680 would maintain the uptrend with the potential for a rebound towards 2,730. However, breaking below 2,680 could lead to a decline towards 2,650, followed by 2,620 and the MA100, which is currently around 2,585.
OMX30 (in SEK), one-year daily chart
OMX30 (in SEK), weekly five-year chart
The full name for abbreviations used in the previous text:
EMA 9: 9-day exponential moving average
Fibonacci: There are several Fibonacci lines used in technical analysis. Fibonacci numbers are a sequence in which each successive number is the sum of the two previous numbers.
MA20: 20-day Moving Average
MA50: 50-day Moving Average
MA100: 100-day Moving Average
MA200: 200-day Moving Average
MACD: Moving Average Convergence Divergence
Risks
Credit risk of the issuer:
Investors in the products are exposed to the risk that the Issuer or the Guarantor may not be able to meet its obligations under the products. A total loss of the invested capital is possible. The products are not subject to any deposit protection.
Currency risk:
If the product currency differs from the currency of the underlying asset, the value of a product will also depend on the exchange rate between the respective currencies. As a result, the value of a product can fluctuate significantly.
Market risk:
The value of the products can fall significantly below the purchase price due to changes in market factors, especially if the value of the underlying asset falls. The products are not capital-protected
Product costs:
Product and possible financing costs reduce the value of the products.
Risk with leverage products:
Due to the leverage effect, there is an increased risk of loss (risk of total loss) with leverage products, e.g. Bull & Bear Certificates, Warrants and Mini Futures.
Disclaimer:
This information is neither an investment advice nor an investment or investment strategy recommendation, but advertisement. The complete information on the products (securities) mentioned herein, in particular the structure and risks associated with an investment, are described in the base prospectus, together with any supplements, as well as the final terms relating to the securities. The base prospectus and final terms constitute the solely binding sales documents for the products mentioned herein. It is recommended that potential investors read these documents before making any investment decision. The documents and the key information document are published on the website of the issuer, Vontobel Financial Products GmbH, Bockenheimer Landstrasse 24, 60323 Frankfurt am Main, Germany, on https://prospectus.vontobel.com and are available from the issuer free of charge. The approval of the prospectus should not be understood as an endorsement of the securities. The securities are products that are not simple and may be difficult to understand. This information includes or relates to figures of past performance. Past performance is not a reliable indicator of future performance. This information may only be distributed or published in countries where such distribution or publication is permitted by applicable law. As stated in the relevant base prospectus, the distribution of the securities mentioned in this information is subject to restrictions in certain jurisdictions. This advertisement may not be reproduced or redistributed without prior permission by Vontobel.
© Bank Vontobel Europe AG and / or affiliated companies. All rights reserved.