Equity markets are showing resilence

Before the summer break, we are launching the soybean case, where demand is driven by soy oil. Investing in soybeans is expected to generate stable returns in 2025. Meanwhile, leading equity markets such as the S&P 500 and Nasdaq have shown resilience in the face of the new military conflict between Israel and Iran. So far, the main consequence has been a spike in oil prices.
Case of the week: If you want ROI, go for soy
The price of soybeans is usually determined by market dynamics in China, the USA, Argentina and Brazil. China is the main consumer of soybeans, accounting for almost 60% of total demand, while the latter countries are among the top three producers. Since late summer last year, the price of soybeans has grown steadily, driven by demand for soy oil. There is no indication that this trend will stop, meaning soybeans could be a relatively stable investment in 2025.
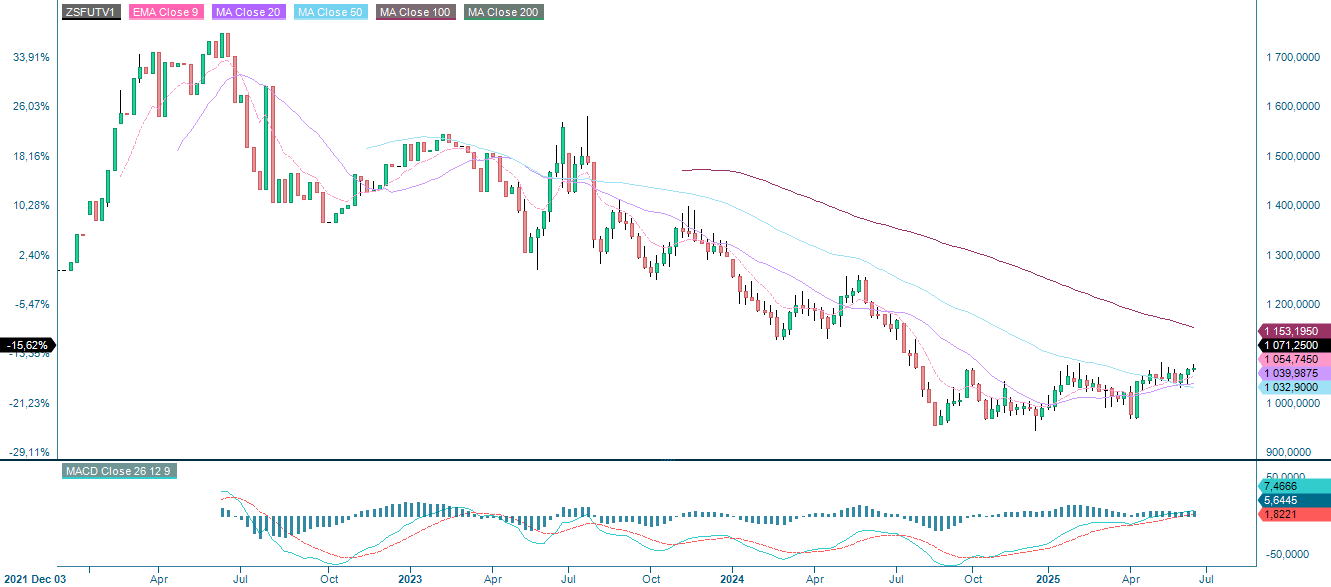
Since peaking at just over 16 USD per bushel in 2022, the price declined considerably until bottoming out at just under 9.4 USD per bushel in August last year. Better-than-expected yields combined with flat demand contributed to pushing prices down. However, since then, prices have steadily increased due to various factors, some related to demand and some to production. This has led to a slow and steady rise in prices to USD 10.7 per bushel.
In terms of production, results have been mixed depending on the country. In the USA, above-average precipitation in spring boosted crop prospects. The rain fell during the 'planting' part of the crop cycle, which is usually carried out from May to early July. This may explain why the USDA recently rated 66% of soybean crops as 'Excellent', the highest rating it gives. Ongoing trade disputes between the USA and China have negatively impacted futures prices. Uncertainty surrounding tariffs has distorted pricing, with new tariffs and delays emerging over time. However, the Trump administration has proposed allowing oil refiners to blend more biofuels into gasoline and diesel, which is a positive factor for soybean futures prices.
At the other end of the crop calendar, Argentina and Brazil are currently harvesting. While Argentina's harvest is likely to finish soon, Brazil's is expected to continue until July. Although Brazil has enjoyed a successful harvest season, supply issues in Argentina have impacted its harvest. The threat of a strike in Q1 has somewhat counteracted the relatively weak peso. However, as summer begins, the peso has appreciated against most major currencies, which is a negative factor for exports.
In summary, although supply-side factors suggest that soybean futures prices will remain relatively stable, demand-side factors appear to indicate otherwise. More specifically, soybean prices could continue to rise in 2025 as trading relations with China improve and demand for soy oil remains strong.
Soybean Future (USD), one-year daily chart

Soybean Future (USD), five-year weekly chart
Macro comments
The leading stock markets fell sharply following Israel's military attacks on Iran, which began on the weekend of 14–15 June. At the time of writing, the S&P 500 and Nasdaq have recovered, which suggests that investors are becoming increasingly resilient in the face of various crises. The most significant long-term change appears to be the increase in oil prices, rising from approximately USD 62 per barrel on 31 May to USD 75 per barrel as of 17 June.
On Wednesday 18 June, the macroeconomic agenda begins with the release of Japan's trade balance and machinery orders data for April and May, respectively. Later, the UK will publish the CPI figures for May. This will be followed by the Eurozone's current account balance for April and CPI for May. From the US, statistics on housing starts in May, a rate announcement from the Fed and weekly oil inventories (DOE) will be released. The Swedish Riksbank will also issue a rate announcement on Wednesday.
A comparison of the FED and ECB policy rates from January 2024 to June 2025

Key events due on Thursday 19 June include April construction output figures from the Eurozone and initial weekly jobless claims from the US. Interest rate announcements are due from the Bank of England, as well as from the central banks of Switzerland, Norway and Turkey. US stock markets will be closed on Thursday, as it is a national holiday.
On Friday 20 June, the macroeconomic agenda starts with the release of Japan's May CPI figures. In Europe, the news feed starts at 08.00 CET with UK retail sales figures and German May PPI figures. This will be followed by French industrial expectations for June. The US will contribute the Philadelphia Fed Index for June, as well as a household confidence indicator for May. Accenture is also scheduled to publish an interim report on Friday. Friday is Midsummer's Eve, a public holiday in Sweden and Finland, meaning the Stockholm and Helsinki stock exchanges will be closed for trading
Soft momentum in both the US and Europe
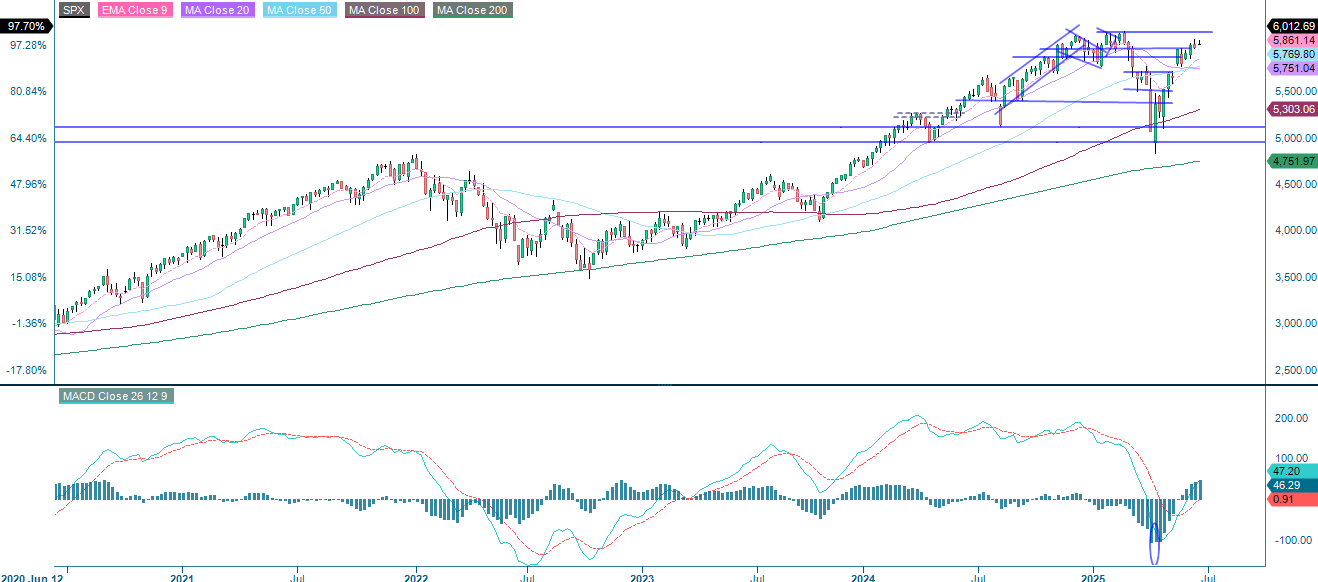
Since April 2025, the S&P 500 has been in a strong uptrend, rising sharply from around 5,200 to just above 6,000. However, a rising wedge pattern has emerged, which is usually considered a bearish signal. Additionally, both the MACD and RSI are displaying bearish divergences, indicating weakening momentum. Although the price remains above all major moving averages, indicating a continued bullish structure, the rally appears to be losing momentum near the key resistance level of 6,010. Breaking below the wedge could trigger a pullback towards 5,950–5,800, whereas breaking out cleanly above 6,010 would open the way for further gains.
Related Products
S&P 500 (in USD), one-year daily chart

S&P 500 (in USD), weekly five-year chart
The Nasdaq 100 has staged a sharp recovery, rising from below 17,000 to around 21,800 since April 2025 — an increase of almost 30%. Once again, the rally has formed a rising wedge pattern. Despite strong support from moving averages, particularly the MA50 and MA20, a breakdown below 21,550 could lead to a correction towards 21,000 or lower. However, a breakout above 21,820 would invalidate the bearish setup and confirm continued bullish momentum.
Nasdaq 100 (in USD), one-year daily chart

Nasdaq 100 (in USD), weekly five-year chart
In Europe, the DAX has continued to rise, reaching a high of almost 24,000 before showing signs of reversal. Recently, the index broke below the short-term moving averages and is now testing the support level of 23,500–23,450. The MACD has formed a clear bearish crossover (circled), confirming a shift in momentum to the downside. The RSI has dropped sharply and is now at around 44, indicating weakening bullish strength and approaching oversold territory. A decisive break below the 22,900–22,650 area would confirm a deeper pullback, with further support near the 21,100 level. Conversely, if buyers intervene at this point, the 23,800–24,000 area remains key resistance that must be reclaimed for bullish continuation.
DAX (in EUR), one-year daily chart

DAX (in EUR), weekly five-year chart

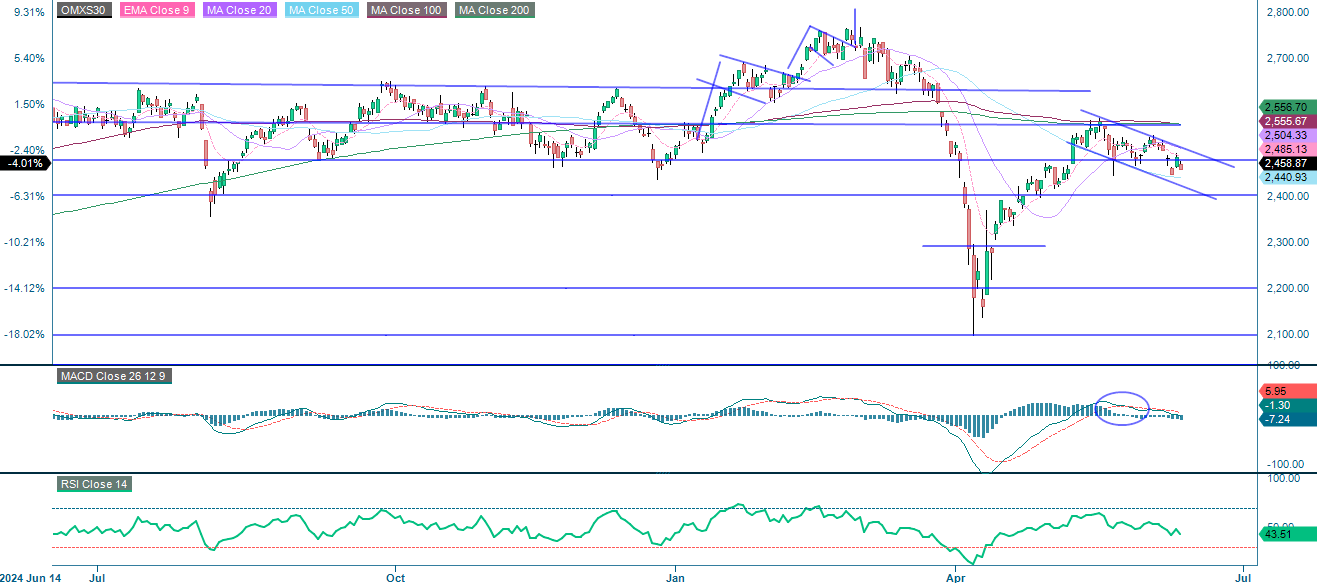
Although the OMXS30 has recovered from its sharp sell-off in March, it has since entered a downward trend, indicating a bearish short-term outlook. The index is currently trading below key moving averages (EMA9, MA20, MA50 and MA100), signalling persistent downward pressure. A recent MACD bearish crossover (circled) supports the weakening momentum. Immediate support lies near 2,440; a breakdown below this level could open the door to 2,300. For the index to become bullish again, it needs to break above the descending channel and reclaim the 2,505–2,556 range.
OMX30 (in SEK), one-year daily chart
OMX30 (in SEK), weekly five-year chart

The full name for abbreviations used in the previous text:
EMA 9: 9-day exponential moving average*
Fibonacci: There are several Fibonacci lines used in technical analysis. Fibonacci numbers are a sequence in which each successive number is the sum of the two previous numbers.
MA20: 20-day moving average
MA50: 50-day moving average
MA100: 100-day moving average
MA200: 200-day moving average
MACD: Moving average convergence divergence
Risks
External author:
This information is in the sole responsibility of the guest author and does not necessarily represent the opinion of Bank Vontobel Europe AG or any other company of the Vontobel Group. The further development of the index or a company as well as its share price depends on a large number of company-, group- and sector-specific as well as economic factors. When forming his investment decision, each investor must take into account the risk of price losses. Please note that investing in these products will not generate ongoing income.
The products are not capital protected, in the worst case a total loss of the invested capital is possible. In the event of insolvency of the issuer and the guarantor, the investor bears the risk of a total loss of his investment. In any case, investors should note that past performance and / or analysts' opinions are no adequate indicator of future performance. The performance of the underlyings depends on a variety of economic, entrepreneurial and political factors that should be taken into account in the formation of a market expectation.
Credit risk of the issuer:
Investors in the products are exposed to the risk that the Issuer or the Guarantor may not be able to meet its obligations under the products. A total loss of the invested capital is possible. The products are not subject to any deposit protection.
Currency risk:
If the product currency differs from the currency of the underlying asset, the value of a product will also depend on the exchange rate between the respective currencies. As a result, the value of a product can fluctuate significantly.
Market risk:
The value of the products can fall significantly below the purchase price due to changes in market factors, especially if the value of the underlying asset falls. The products are not capital-protected
Product costs:
Product and possible financing costs reduce the value of the products.
Risk with leverage products:
Due to the leverage effect, there is an increased risk of loss (risk of total loss) with leverage products, e.g. Bull & Bear Certificates, Warrants and Mini Futures.