New energy is needed to support US equity indices

This week's case focuses on Tesla, which has recently been in the spotlight due to the deteriorating relationship between US President Trump and Elon Musk, following open disagreements regarding the proposed tax cuts in the US. Despite the decline, it seems difficult to justify the high EV/EBITDA (Enterprise Value/Earnings Before Interest, Taxes, Depreciation and Amortization) multiples at which Tesla shares are still traded. On Friday 6 June, better-than-expected US nonfarm payroll figures boosted US equity indices. However, from a technical perspective, these leading indices appear to be losing momentum.
Case of the week: Tesla faces increasing political headwinds
Tesla (TSLA) saw its stock price plummet by 15% on Thursday amid growing tension between US President Trump and Elon Musk over the Big, Beautiful Bill. Although the stock made a modest recovery on Friday 6 June, the company's future is looking increasingly uncertain. What once seemed like a solid partnership with the current administration now appears to be unravelling.
The broader picture over the past year has also been unstable. Tesla shares soared from around USD 200 to nearly USD 480 in six months, only to fall back down to around USD 230. This downturn has largely been blamed on political backlash relating to Musk's involvement in US national affairs, as well as weaker-than-expected sales performance.
In April 2025, Tesla's market presence waned significantly, with vehicle registrations plummeting by 53% year-on-year to a mere 5,475 units. This sharp decline contrasts sharply with the broader automotive market, which saw modest growth of 1.3% over the same period.
The end of tax incentives for Tesla buyers, in the form of a USD 7,500 tax credit, is expected to further dampen demand. This tax credit has played a significant role in how these vehicles are positioned in the market. Without it, a mid-range price tag of USD 42,000 could start to feel out of reach for certain buyers. Given Trump’s emphasis on reducing government spending, eliminating this kind of incentive would be an obvious way to cut costs, particularly as it directly affects federal spending. Furthermore, tariff-related headwinds, frequently criticised by Elon Musk, add to the company’s mounting challenges. The result is a perfect storm of an uncertain macro and geopolitical landscape, reputational damage linked to Musk’s political entanglements, fading demand drivers and a steep drop in sales, despite an overall market growth.
The valuation raises even more concerns. With Tesla trading at over 60 times EV/EBITDA on a forward-looking basis, investors are paying a premium for a company that is grappling with serious economic and political risks, declining sales and a brand that is under pressure due to its CEO's public persona. This is a difficult situation to justify.
Significant headline risks surround Tesla, and there are signs pointing to potential long-term damage to the brand. Amid his escalating feud with President Trump, Elon Musk has made several public comments suggesting he intends to remain heavily involved in US political discourse — a move that could continue to negatively impact Tesla's public perception. Furthermore, the Trump administration may respond with increased regulatory scrutiny, reduced access to subsidies, delays in approvals or obstacles to securing government contracts, all of which could pose serious challenges for Tesla.
TSLA (USD), one-year daily chart

TSLA (USD), five-year weekly chart

Macro comments
On Friday, June 6, both the S&P 500 and the NASDAQ rose by 1.0%. This followed the release of US nonfarm payroll figures showing 139,000 new jobs, exceeding the expected 130,000. Private sector employment increased by 140,000, surpassing the anticipated figure of 120,000. Meanwhile, US market interest rates increased in response to the positive employment figures, with the ten-year US Treasury yield rising 12 basis points to 4.51%.
Japan's May PPI (Producer Price Index) figures will be released on Wednesday, 11 June in the early morning. Later in the day, the US is expected to publish its CPI (Consumer Price Index) for May (see graph below) and weekly oil inventory statistics (Department of Energy). Oracle is also scheduled to publish an interim report.
US CPI (percentage change year on year) from March 2023 to May 2025

On Thursday, 12 June, Clas Ohlson will release its Q4 (2024/25) report and May 2025 sales figures. From the UK, April's GDP (Gross Domestic Product) and industrial production figures are expected. The US will provide PMI (Purchasing Managers’ Index) figures for May, as well as initial weekly jobless claims. An interim report from Adobe is also anticipated.
Friday 13 June, starts with Japan's industrial production figures for April. A few hours later, the May CPI figures from Sweden, Germany, France and Spain will be received. Moreover, the Eurozone's industrial production and trade balance figures for April and the Michigan index for June from the USA will be received.
Reduce exposure to the US and the DAX in favour of the OMXS30
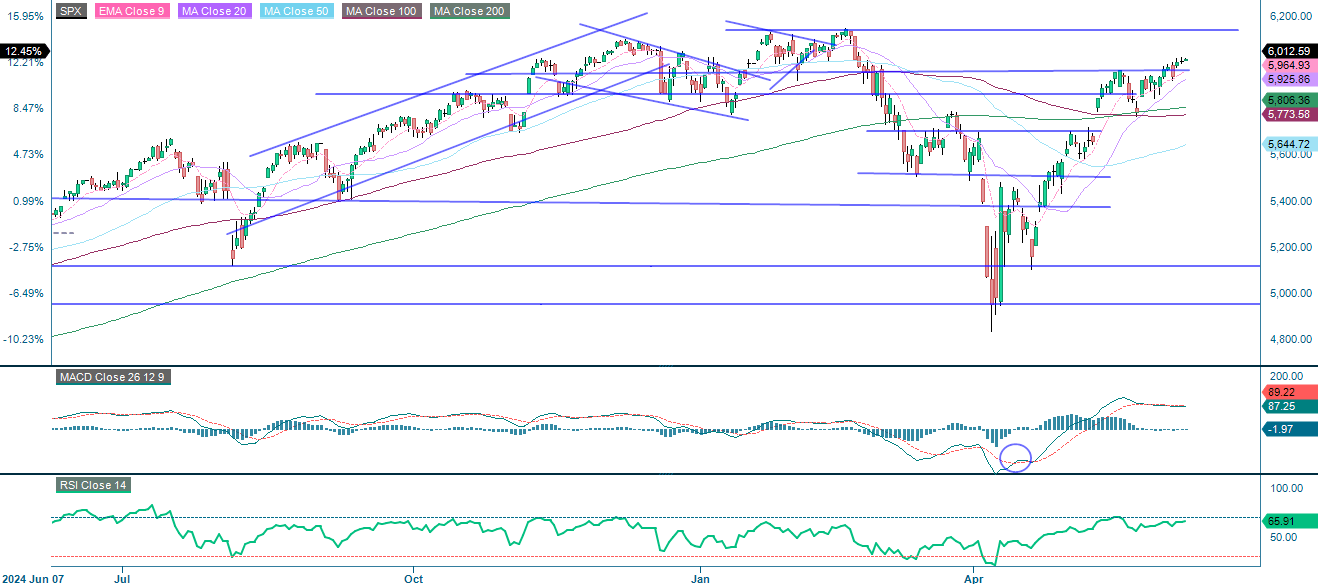
As the chart shows, the S&P 500 has broken above the 5,950 level. The next significant resistance level is around 6,145, which corresponds to previous peaks observed in early 2025. However, the MACD indicator suggests that momentum is weakening. Considering these developments, it may now be prudent to consider taking partial profits on long positions.
Related Products
S&P 500 (in USD), one-year daily chart
S&P 500 (in USD), five-year weekly chart

As the NASDAQ-100 chart shows, the index has broken above key resistance levels and is approaching its previous highs. However, momentum appears to be waning, as indicated by weakening technical indicators. Given this, it may be sensible to consider taking some profits from long positions at this stage.
Related Products
NASDAQ-100 (in USD), one-year daily chart

NASDAQ-100 (in USD), five-year weekly chart

In Europe, the DAX is showing signs of waning momentum, with the MACD indicator generating a mild sell signal. If the index falls below the 20-day moving average, which is currently just above 24,000, the next technical target could be a decline towards the 23,400 support level.
DAX (in EUR), one-year daily chart

DAX (in EUR), five-year weekly chart

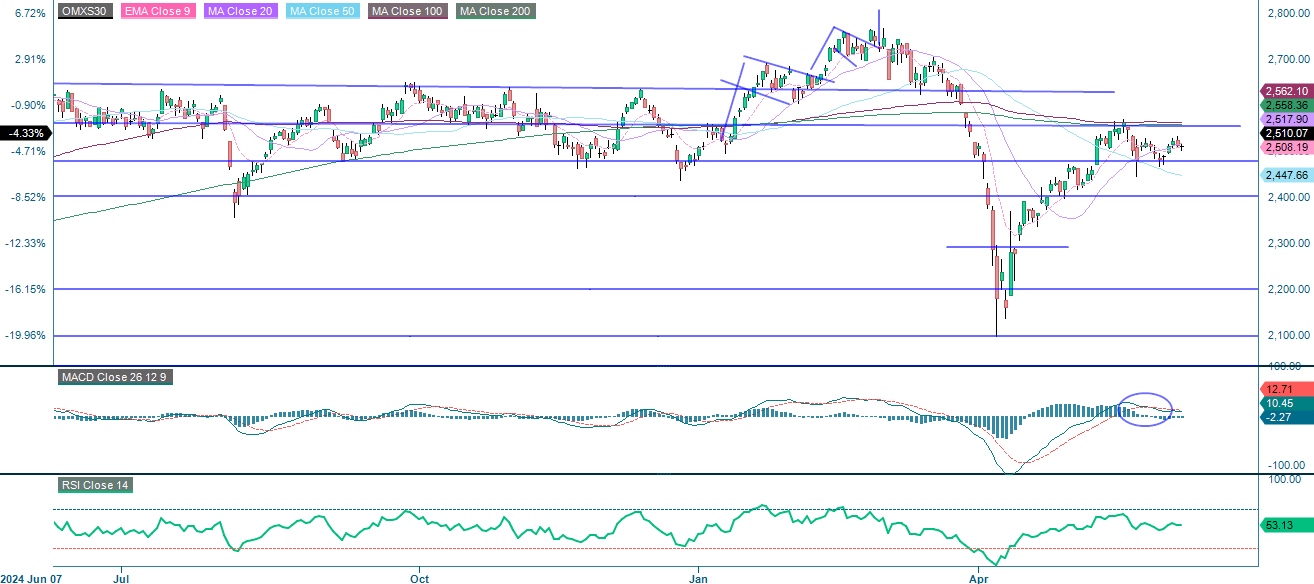
The OMXS30 is currently consolidating between a support level of around 2,480 and a resistance level of approximately 2,550. Various technical indicators currently suggest taking a cautious stance. At the same time, the Swedish krona (SEK) is beginning to weaken against the euro. Historically, a weaker domestic currency has supported export-oriented indices such as the OMXS30, potentially enabling Swedish equities to catch up with major European and US indices. In this context, it could be a good idea to reduce exposure to US and DAX positions and invest some of the capital in Swedish stocks instead, in anticipation of possible relative outperformance if the SEK continues to weaken.
OMX30 (in SEK), one-year daily chart
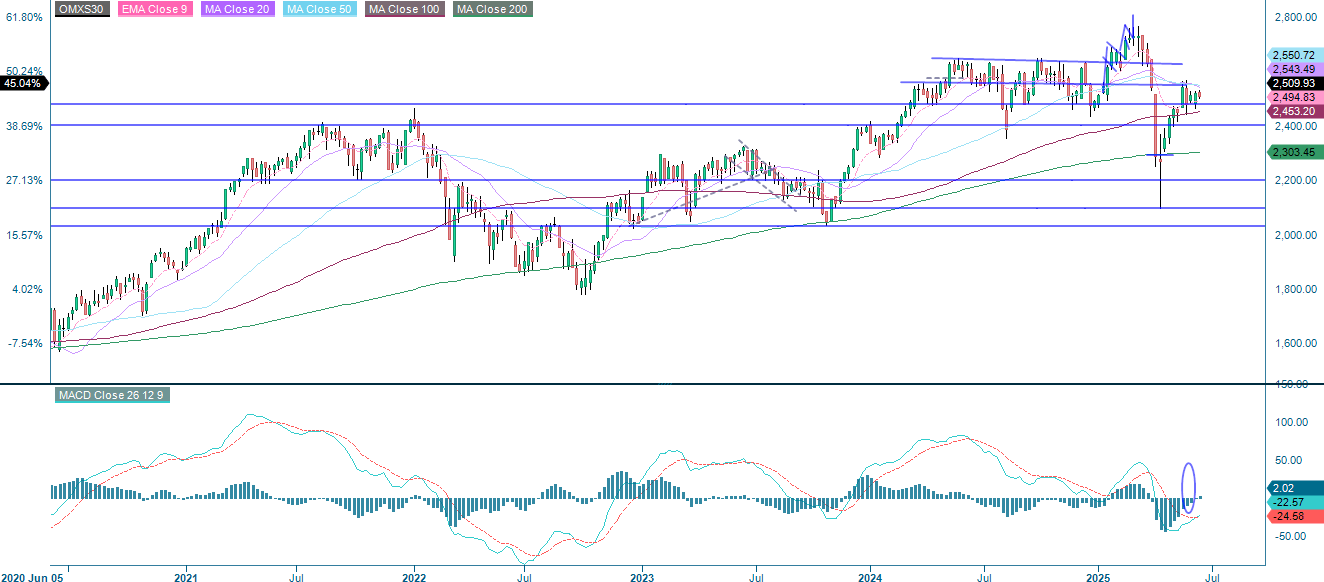
OMX30 (in SEK), five-year weekly chart
The full name for abbreviations used in the previous text:
EMA 9: 9-day exponential moving average
Fibonacci: There are several Fibonacci lines used in technical analysis. Fibonacci numbers are a sequence in which each successive number is the sum of the two previous numbers.
MA20: 20-day moving average
MA50: 50-day moving average
MA100: 100-day moving average
MA200: 200-day moving average
MACD: Moving average convergence divergence
Risks
Credit risk of the issuer:
Investors in the products are exposed to the risk that the Issuer or the Guarantor may not be able to meet its obligations under the products. A total loss of the invested capital is possible. The products are not subject to any deposit protection.
Currency risk:
If the product currency differs from the currency of the underlying asset, the value of a product will also depend on the exchange rate between the respective currencies. As a result, the value of a product can fluctuate significantly.
External author:
This information is in the sole responsibility of the guest author and does not necessarily represent the opinion of Bank Vontobel Europe AG or any other company of the Vontobel Group. The further development of the index or a company as well as its share price depends on a large number of company-, group- and sector-specific as well as economic factors. When forming his investment decision, each investor must take into account the risk of price losses. Please note that investing in these products will not generate ongoing income.
The products are not capital protected, in the worst case a total loss of the invested capital is possible. In the event of insolvency of the issuer and the guarantor, the investor bears the risk of a total loss of his investment. In any case, investors should note that past performance and / or analysts' opinions are no adequate indicator of future performance. The performance of the underlyings depends on a variety of economic, entrepreneurial and political factors that should be taken into account in the formation of a market expectation.
Market risk:
The value of the products can fall significantly below the purchase price due to changes in market factors, especially if the value of the underlying asset falls. The products are not capital-protected
Product costs:
Product and possible financing costs reduce the value of the products.
Risk with leverage products:
Due to the leverage effect, there is an increased risk of loss (risk of total loss) with leverage products, e.g. Bull & Bear Certificates, Warrants and Mini Futures.
Disclaimer:
This information is neither an investment advice nor an investment or investment strategy recommendation, but advertisement. The complete information on the products (securities) mentioned herein, in particular the structure and risks associated with an investment, are described in the base prospectus, together with any supplements, as well as the final terms relating to the securities. The base prospectus and final terms constitute the solely binding sales documents for the products mentioned herein. It is recommended that potential investors read these documents before making any investment decision. The documents and the key information document are published on the website of the issuer, Vontobel Financial Products GmbH, Bockenheimer Landstrasse 24, 60323 Frankfurt am Main, Germany, on https://prospectus.vontobel.com and are available from the issuer free of charge. The approval of the prospectus should not be understood as an endorsement of the securities. The securities are products that are not simple and may be difficult to understand. This information includes or relates to figures of past performance. Past performance is not a reliable indicator of future performance. This information may only be distributed or published in countries where such distribution or publication is permitted by applicable law. As stated in the relevant base prospectus, the distribution of the securities mentioned in this information is subject to restrictions in certain jurisdictions. This advertisement may not be reproduced or redistributed without prior permission by Vontobel.
© Bank Vontobel Europe AG and / or affiliated companies. All rights reserved.