Investors appear to have stopped worrying

Over the past six months, the world market price of sugar has fallen by more than 20%. The price of sugar has been weighed down by a global surplus and stagnant demand. However, meteorologists have predicted that the summer of 2025 could be very hot, which could lead to higher sugar prices. On Friday 16 May, Moody’s downgraded the US credit rating from Aaa to Aa1, which increased market interest rates and further weakened the US-dollar (USD) . However, both US equity indices and the OMXS30 now appear to be in a strong technical position.
Case of the week: A sugary moon might be on the rise
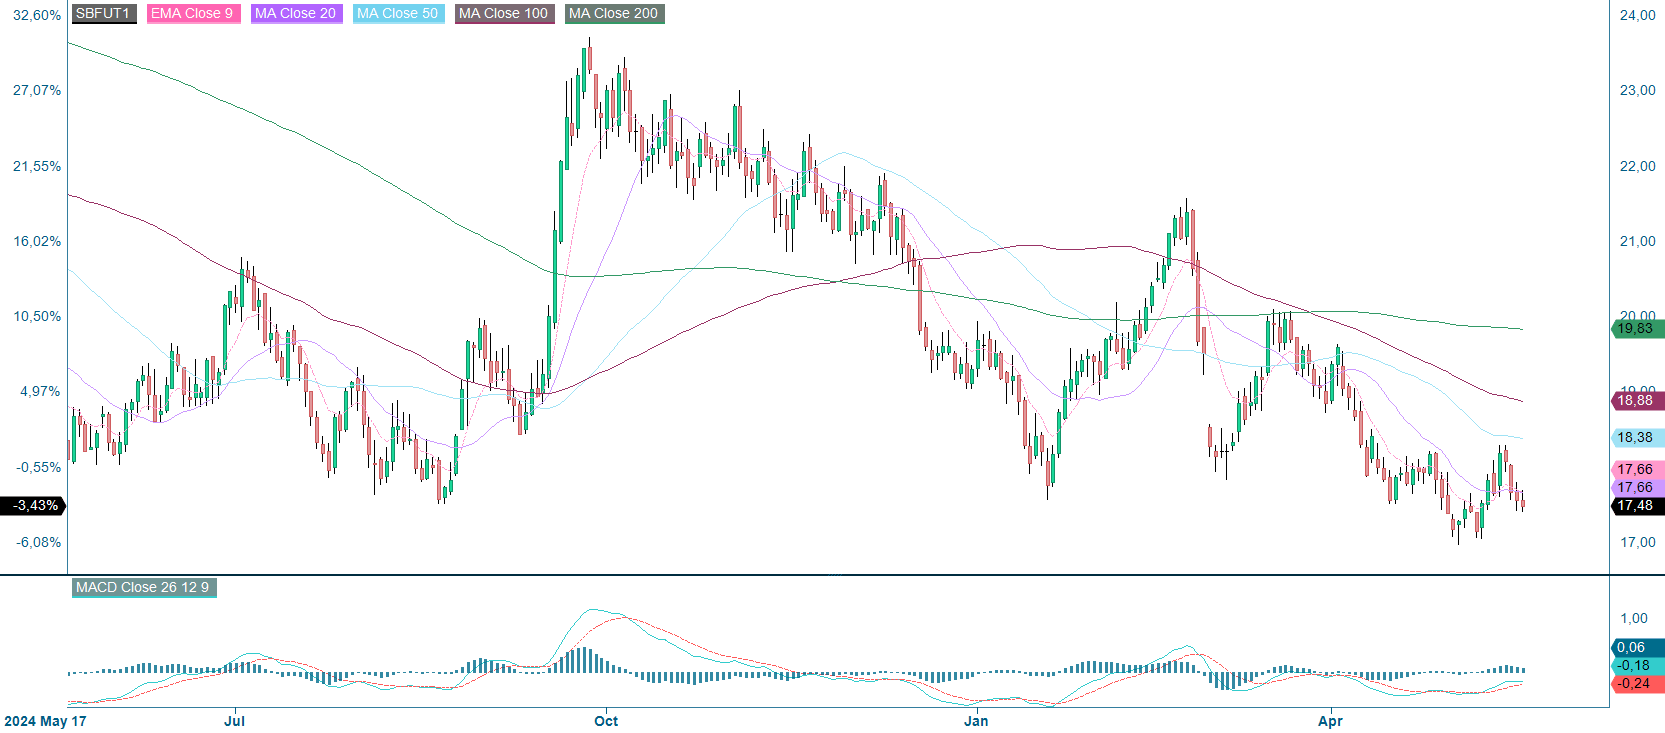
Over the last six months, sugar prices have been on a downward trend, falling from a contract for difference (CFD) price of just over 22 US cents per pound to just over 17 US cents per pound. With strong production in Brazil and favourable weather conditions, supply is expected to remain robust. However, currency effects and a scorching summer could potentially interfere with these plans.
Brazil and India, the two biggest sugar producers in the world, have slightly different crop cycles. While India should have finished harvesting by the beginning of June, Brazil should have finished planting for the season. Although some ratooning may take place in Brazil, harvesting is expected to start at the end of July or beginning of August, which corresponds with a dry period in terms of precipitation.
Sugar prices have been weighed down by a global surplus and stagnant demand. On 6 May, the Foreign Agricultural Service (FAS) predicted that India's sugar output for the 2025/26 season would rise 26% year on year to 35 MMT (Million Metric Tons), based on favourable rainfall during the monsoon season. Turning to Brazil, the same agency predicted a 2.3% increase in production to 44.7 MMT. This compares to a 4% increase forecast by Brazil’s own agency, Conab, to just under 46 MMT.
At the same time, the USD has fallen in value against other currencies. Since the peak in Q4 2024, the US dollar has dropped close to 10% against the Brazilian real (BRL). While the drop is less significant against the Indian rupee, the US imports most of its sugar from Brazil, making the currency pair more important to track. Looking ahead to the rest of 2025, it is possible that the BRL will remain strong against the USD as tariffs and political uncertainty continue to drive investment away from the USA. If this happens, exporting sugar or sugar cane to the USA will be less attractive than exporting to destinations where the real is relatively weaker.
Furthermore, many different agencies have recently predicted extreme heat and prolonged drought for the 2025 summer season. German meteorologists and NOAA (National Oceanic and Atmospheric Administration) in the USA have predicted that the very hot summer of 2024 may be repeated in 2025. This is positive for sugar prices, as sweltering heat and the risk of fires could destroy millions of tonnes of crops before they are harvested.
Overall, it seems that markets are confident that strong production in India, coupled with growth expectations in Brazil, will meet our sugar needs this year. However, given the number of important variables that could affect this outlook, it is possible that markets are being overly optimistic, with sugar prices potentially rising as summer approaches.
Sugar (USD/lbs), one-year daily chart
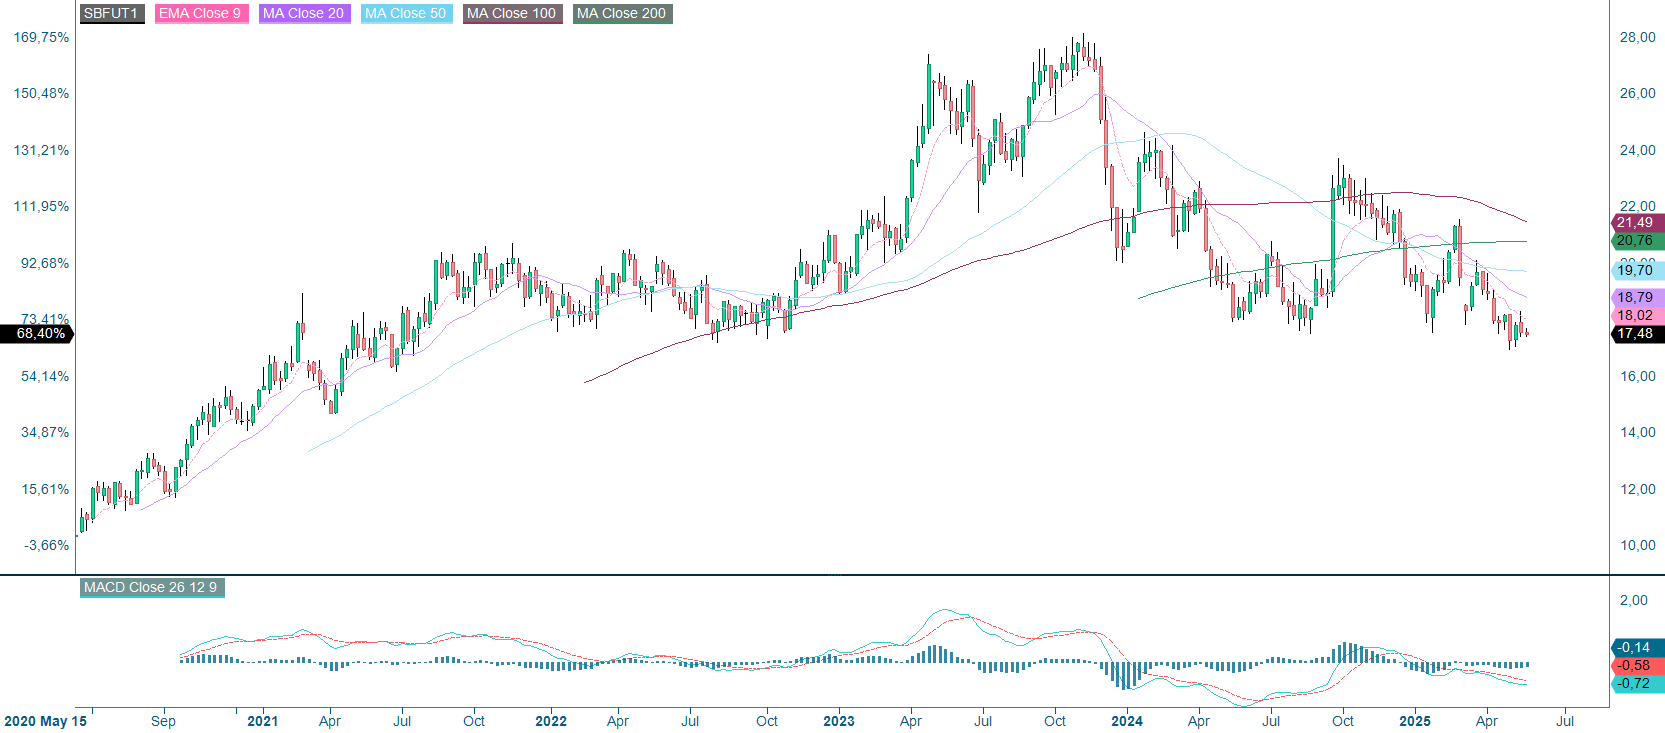
Sugar (USD/lbs), five-year weekly chart
Macro comments
Late on Friday 16 May, Moody’s downgraded the US credit rating to Aa1 from Aaa, pushing up market interest rates and weakening the USD further. This downgrade came against the backdrop of a major US legislative package involving tax cuts, increased spending and welfare cuts. This package risks significantly increasing the US national debt.
On Wednesday 21 May there are still interim reports coming in the US from companies like Lowe’s Companies, Medtronic and the TJX Companies. The macro news begins with Japan's trade balance for April. This is followed by Sweden's industrial capacity utilisation in Q1 and the UK's CPI (Consumer Price Index) for April. From the US weekly oil inventories statistics (Department of Energy) will be released.
On Thursday 22 May, the macro agenda begins with Japan's March machinery orders and May PMI (Purschasing Managers’ Index). The May PMI will also be released for India, France, Germany, the eurozone, the UK and the US. Also in May,French industrial expectations will be presented, the German Business Climate Index (IFO) and UK industrial trends survey (CBI). In addition to the aforementioned PMI figures, the US will release the Chicago Fed National Activity Index for April, weekly jobless claims, existing home sales for April, and the Kansas City Fed Index for May. Large North American companies reporting their quarterly results on Thursday include Analog Devices, Intuit and the Toronto Dominion Bank.
On Friday 23 May, the macroeconomic agenda begins with Japan's April CPI. A few hours later, the focus shifts to the UK's April retail sales and Germany's Q1 GDP (Gross Domestic Product). Next, the French household confidence indicator for May is presented. Finally, with US new home sales for April will be shown.
Manufacturing PMI for the eurozone and the US from June 2023 to May 2025 (forecast)

Equities still have an upside
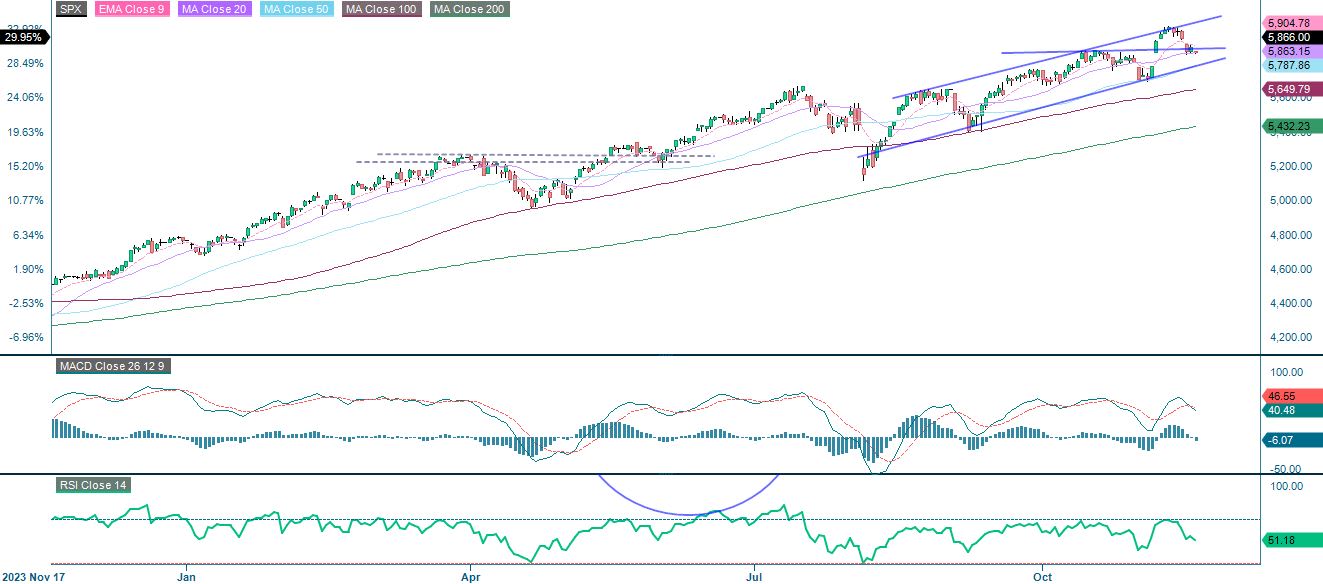
The S&P 500 has rallied strongly since its low in April, breaking through key resistance. The MACD indicates a bullish crossover with sustained upward momentum, and an RSI (Relative Strength Index) of around 68 suggests robust buying without over-extension. The price is comfortably above all major moving averages, which are also rising, thus reinforcing the bullish structure. Although short-term consolidation is possible, the trend remains positive, with no immediate signs of a reversal.
Related Products
S&P 500 (in USD), one-year daily chart
S&P 500 (in USD), five-year weekly chart

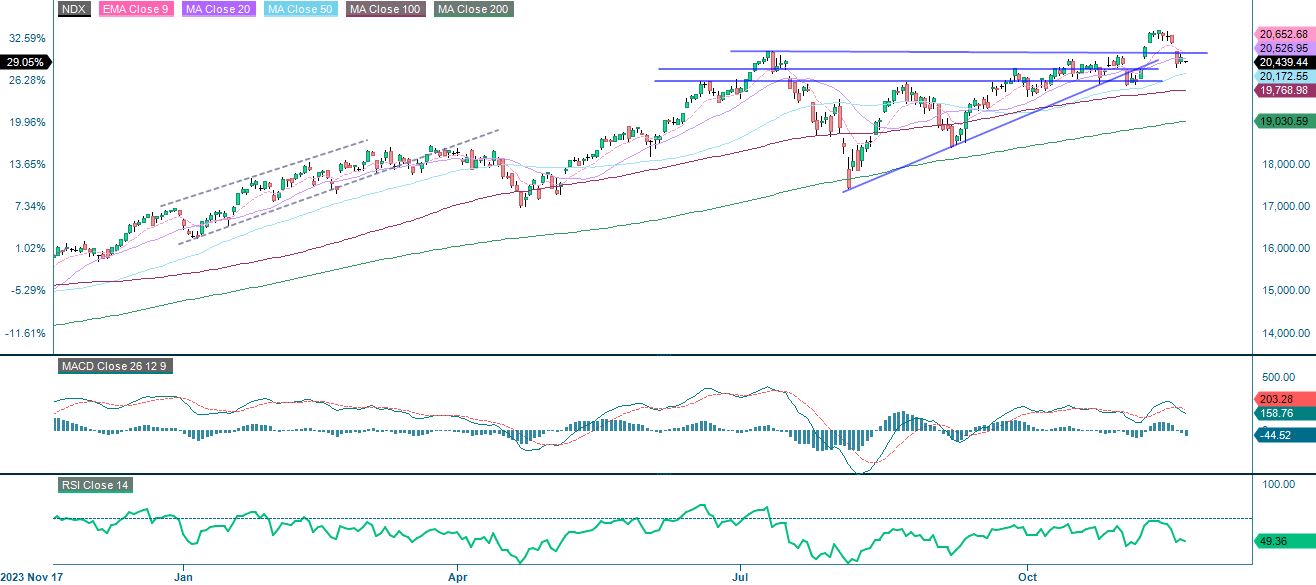
The Nasdaq 100 has broken through the key resistance level of 21,000. The MACD indicates sustained upward momentum, and the RSI near 69 signals strength without reaching extreme overbought levels. The price is trading above all major moving averages, which are turning upwards and reinforcing the bullish trend. However, after the sharp rally, consolidation or a short-term pullback may occur before further gains.
Related Products
NASDAQ-100 (in USD), one-year daily chart
Note that the MACD indicator has generated a soft buy signal on the weekly chart below.
NASDAQ-100 (in USD), five-year weekly chart

The DAX index continues to show a strong bullish trend. However, the RSI has risen above 70, indicating overbought conditions and sustained strength. Price action is supported by rising moving averages and recent consolidation has given way to fresh upward momentum. This suggests that the uptrend is intact, although a short-term pullback cannot be ruled out.
DAX (in EUR), one-year daily chart

DAX (in EUR), five-year weekly chart

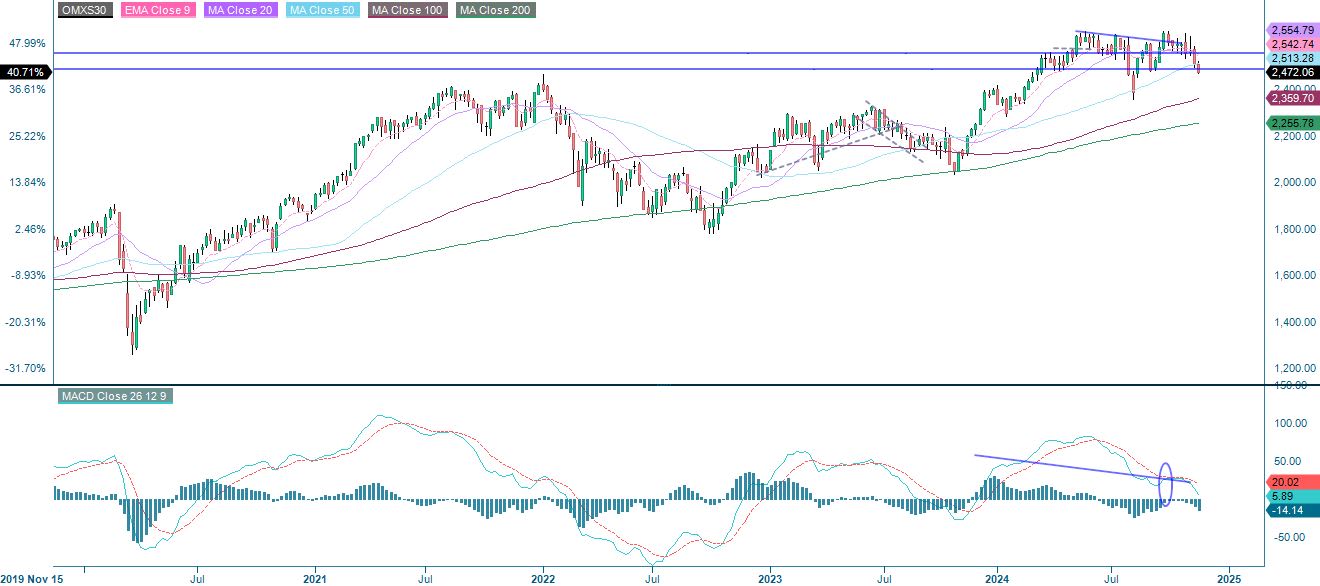
The OMX Stockholm 30 Index (OMXS30) has broken through several resistance levels. It is currently approaching the 2,560–2,565 area, where several moving averages converge. Momentum indicators support the uptrend: the MACD has formed a bullish crossover and is rising, and the RSI is above 60, which indicates strong buying interest but not overbidding. While the recent rally appears healthy, further confirmation above the current resistance levels is key for sustained upside.
OMX30 (in SEK), one-year daily chart

OMX30 (in SEK), five-year weekly chart
The full name for abbreviations used in the previous text:
EMA 9: 9-day exponential moving average
Fibonacci: There are several Fibonacci lines used in technical analysis. Fibonacci numbers are a sequence in which each successive number is the sum of the two previous numbers.
MA20: 20-day moving average
MA50: 50-day moving average
MA100: 100-day moving average
MA200: 200-day moving average
MACD: Moving average convergence divergence
Risks
Credit risk of the issuer:
Investors in the products are exposed to the risk that the Issuer or the Guarantor may not be able to meet its obligations under the products. A total loss of the invested capital is possible. The products are not subject to any deposit protection.
Currency risk:
If the product currency differs from the currency of the underlying asset, the value of a product will also depend on the exchange rate between the respective currencies. As a result, the value of a product can fluctuate significantly.
External author:
This information is in the sole responsibility of the guest author and does not necessarily represent the opinion of Bank Vontobel Europe AG or any other company of the Vontobel Group. The further development of the index or a company as well as its share price depends on a large number of company-, group- and sector-specific as well as economic factors. When forming his investment decision, each investor must take into account the risk of price losses. Please note that investing in these products will not generate ongoing income.
The products are not capital protected, in the worst case a total loss of the invested capital is possible. In the event of insolvency of the issuer and the guarantor, the investor bears the risk of a total loss of his investment. In any case, investors should note that past performance and / or analysts' opinions are no adequate indicator of future performance. The performance of the underlyings depends on a variety of economic, entrepreneurial and political factors that should be taken into account in the formation of a market expectation.
Market risk:
The value of the products can fall significantly below the purchase price due to changes in market factors, especially if the value of the underlying asset falls. The products are not capital-protected
Product costs:
Product and possible financing costs reduce the value of the products.
External author:
This information is in the sole responsibility of the guest author and does not necessarily represent the opinion of Bank Vontobel Europe AG or any other company of the Vontobel Group. The further development of the index or a company as well as its share price depends on a large number of company-, group- and sector-specific as well as economic factors. When forming his investment decision, each investor must take into account the risk of price losses. Please note that investing in these products will not generate ongoing income.
The products are not capital protected, in the worst case a total loss of the invested capital is possible. In the event of insolvency of the issuer and the guarantor, the investor bears the risk of a total loss of his investment. In any case, investors should note that past performance and / or analysts' opinions are no adequate indicator of future performance. The performance of the underlyings depends on a variety of economic, entrepreneurial and political factors that should be taken into account in the formation of a market expectation.
Disclaimer:
This information is neither an investment advice nor an investment or investment strategy recommendation, but advertisement. The complete information on the products (securities) mentioned herein, in particular the structure and risks associated with an investment, are described in the base prospectus, together with any supplements, as well as the final terms relating to the securities. The base prospectus and final terms constitute the solely binding sales documents for the products mentioned herein. It is recommended that potential investors read these documents before making any investment decision. The documents and the key information document are published on the website of the issuer, Vontobel Financial Products GmbH, Bockenheimer Landstrasse 24, 60323 Frankfurt am Main, Germany, on https://prospectus.vontobel.com and are available from the issuer free of charge. The approval of the prospectus should not be understood as an endorsement of the securities. The securities are products that are not simple and may be difficult to understand. This information includes or relates to figures of past performance. Past performance is not a reliable indicator of future performance. This information may only be distributed or published in countries where such distribution or publication is permitted by applicable law. As stated in the relevant base prospectus, the distribution of the securities mentioned in this information is subject to restrictions in certain jurisdictions. This advertisement may not be reproduced or redistributed without prior permission by Vontobel.
© Bank Vontobel Europe AG and / or affiliated companies. All rights reserved.