Navigating a tricky market

The strong rally in the S&P500 since the middle of last week may have been overdone. A period of negotiation is now beginning between the US and other countries over the level of tariffs. However, despite some reduction following these negotiations, the US tariffs are still significantly higher than those in place on 20 January 2025. The new tariffs mean a large increase in corporate taxes, which could trigger a global recession.
Case of the week: S&P 500, The Trump circus is just getting started
Last Wednesday, news of a 90-day pause in US trade tariffs sent stock markets soaring. The S&P 500 jumped 9.5%, its third best day since 1950.
To put this in context, the only two days with larger gains for the S&P 500 were 13 October 2008 (+12%) and 28 October 2008 (+11%). However, these rallies were short-lived. The market continued to slide for another five months, bottoming out in March 2009 after the S&P 500 had lost half its value.
The market seems encouraged by signs that Trump may be willing to at least partially reverse course on the latest round of tariff threats. However, significant tariffs are still being implemented. What's been avoided are the extremely steep increases previously announced. Still, the numbers remain substantial. With tariffs on Chinese imports set at 125% and those on other countries at 10%, the effective overall rate is now around 24%. That’s only slightly below the earlier forecast of 27%. For context, the effective tariff rate was just 2% as recently as 20 January 2025. No matter how you frame it, this represents a significant tax hike for businesses..
Markets seem to be betting that the upcoming negotiations will reduce or eliminate the 10% tariffs and that China may soften its retaliatory stance. Time will tell if this optimism is justified.
A similar pattern played out in 2001. The bear market that began in March 2000 was marked by five sharp counter-trend rallies, each lasting from a few days to a few months. Despite these temporary rallies, the NASDAQ ultimately fell 78% from its March 2000 peak and 62% from its January 2001 rebound high before bottoming in October 2002.
Market volatility aside, the economic impact remains unclear. At worst, there could be some disruption; at best, the next 90 days offer a window of uncertainty. Most challenging of all is the lack of clarity on future tariff policy, leaving businesses and investors waiting for more definitive guidance.
Given this historical context and the current uncertainties, it's important to temper enthusiasm with caution. While the recent rally reflects hope for de-escalation, history has shown that sharp rebounds in volatile markets can be fleeting. With tariff rates and future trade policy in flux, the path forward is likely to remain rocky. Investors would be wise to remain vigilant and avoid over-committing based on short-term optimism, as further market volatility is not only possible but likely. However, volatility creates opportunities for risk-taking investors.
Related Products
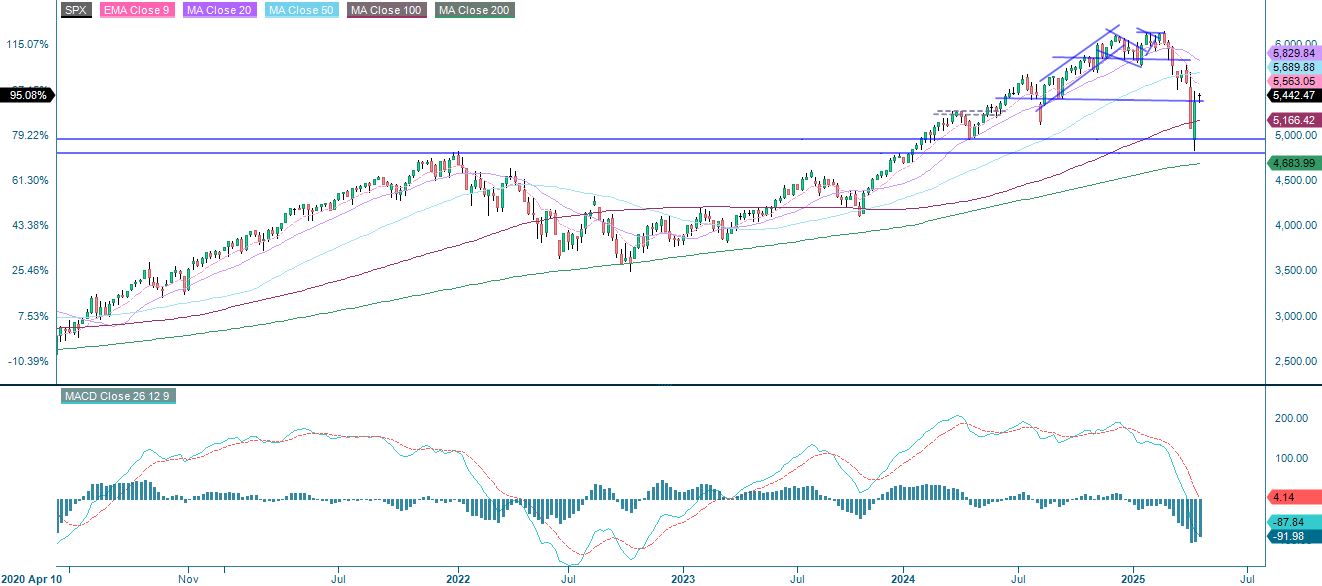
From a technical perspective, the MACD on the S&P 500 has generated a soft buy signal. A break above the MA20, currently at 5,495 and the MA200, currently at 5,762, could be the next move. On the other hand, a break below 5,400 and levels around 5,000 may be next.
S&P 500 (in USD), one-year daily chart

S&P 500 (in USD), weekly five-year chart
Macro comments
This week marks the start of the Q1 2025 reporting season, with some blue chip companies reporting. Thursday's ECB (European Central Bank) rate decision is a key one, with expectations for a cut from 2.50% to 2.25%.
Today, Wednesday 16 April 2025, Nordea, EQT, Sandvik and Autoliv are scheduled to report. In the US, Abbott Laboratories, ASML Holding and Prologis are among the companies reporting. The macro news feed starts early in the morning with Japan's February machinery orders. A few hours later, a block of statistics from China in the form of Q1 GDP (Gross Domestic Product), March industrial production, retail sales, investment, house prices and unemployment will be made public. At 8:00 CET, the European news feed begins with the UK's March CPI (Consumer Price Index). This will be followed by the Eurozone's February current account balance and March CPI, as well as Italy's March CPI. In the afternoon, the US will release retail sales and industrial production for March, inventories of unsold goods for February, the NAHB housing index for April and weekly oil inventories (Department of Energy). We will also get an interest rate statement from the Bank of Canada.
On Thursday 17 April 2025, ABB and Elisa will release their interim reports. US companies reporting quarterly figures on Thursday include Netflix, United Health Group, American Express, The Blackstone Group, Charle Schwab and Marsh & McLennan Companies. Japan's March trade balance will be the first in the morning macro news flow. In Europe, Germany's March PPI (Producer Price Index) and an interest rate announcement from the ECB followed by a press conference will be made public. From the US, we will see Housing Starts for March, the Philadelphia Fed Index for April and the weekly jobless claims.
Euro area marginal lending facility rate (in %), 16 March 2023 to forecast for 17 April 2025

Friday 18 April 2025 is Good Friday in most markets in the Americas, Europe, Australia and a few other countries, which means that the major stock exchanges in these countries will be closed. The only macro news on Friday is Japan's CPI for March and China's FDI (Foreign Direct Investment) for March.
What is a soft buy signal worth?
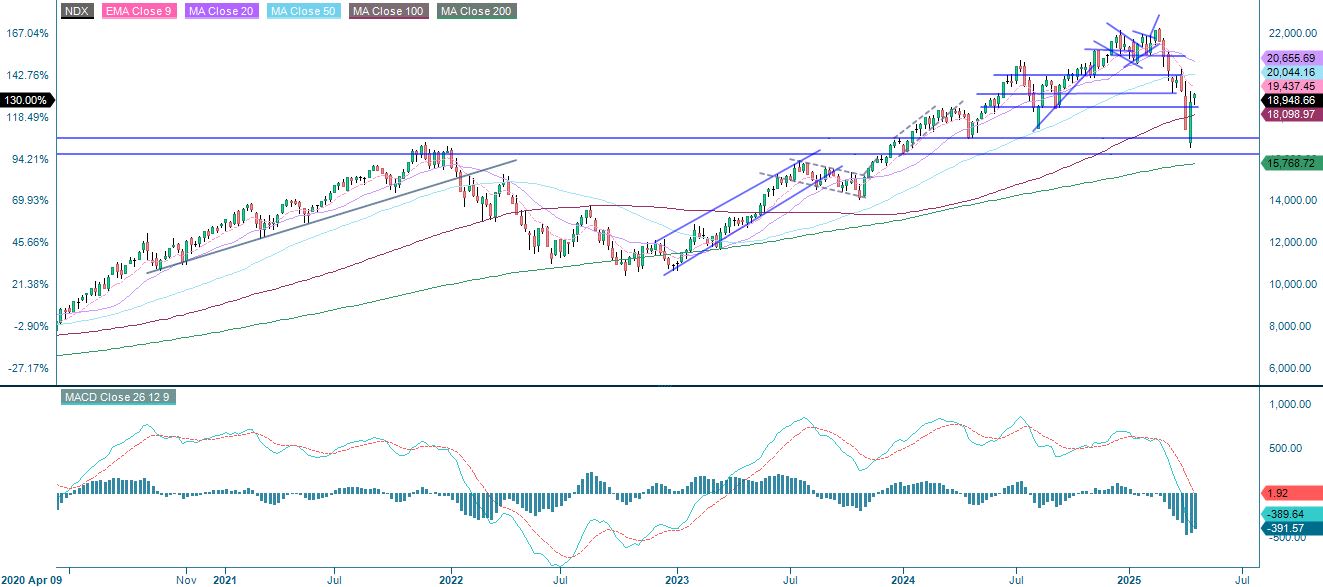
The NASDAQ-100 is at a crossroads. A break above 19,100 and levels around 20,000 could be next. Again, the MACD has given a soft buy signal.
Related Products
NASDAQ-100 (in USD), one-year daily chart

NASDAQ-100 (in USD), weekly five-year chart
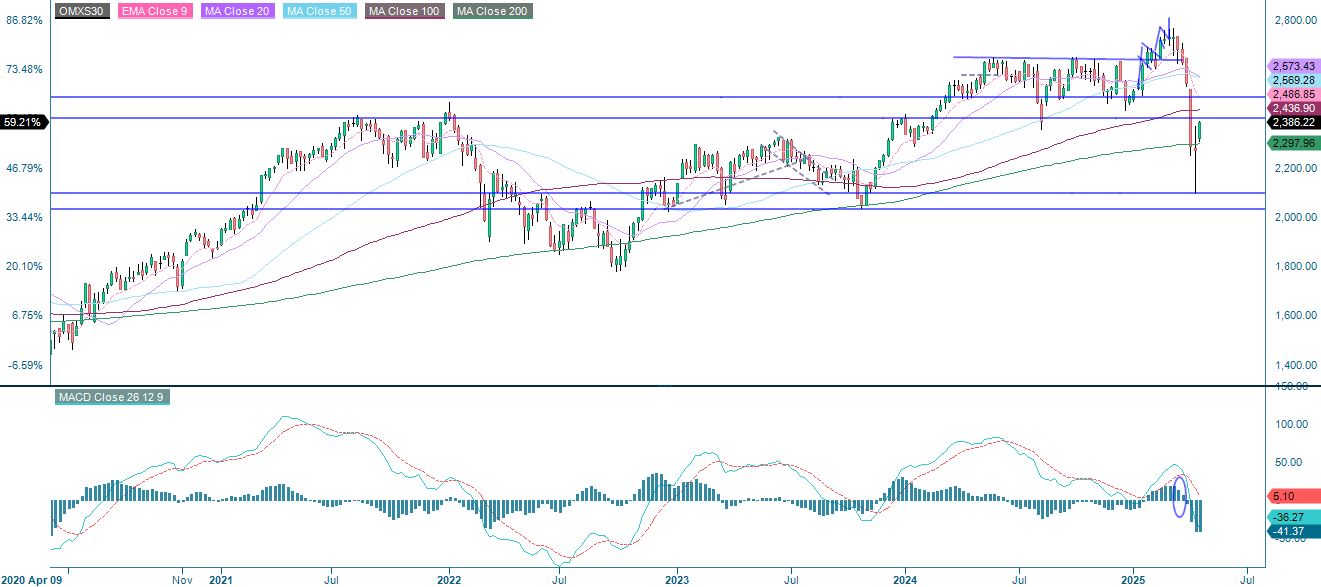
As in the US, the Swedish OMXS30 has gained some momentum as the MACD is close to giving a soft buy signal. A break above 2,400 and the MA20, currently at 2,450, acts as the first level of resistance, followed by 2,500.
OMXS30 (in SEK), one-year daily chart

OMXS30 (in SEK), weekly five-year chart
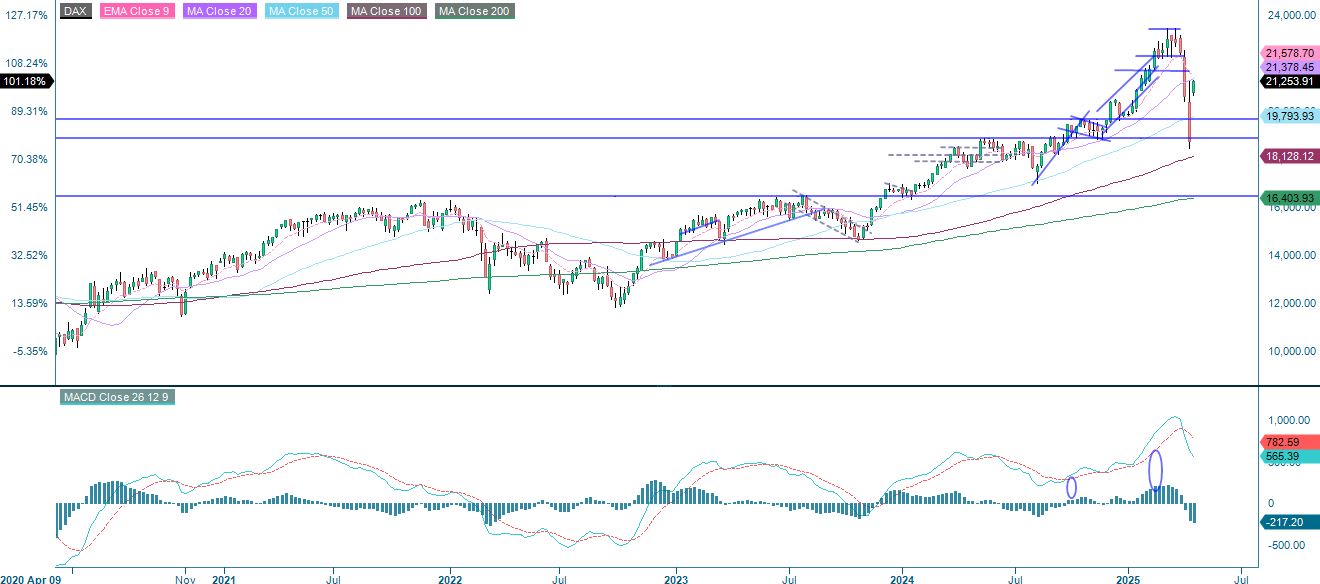
The German DAX is testing the MA100 which is currently just above 21,300. The MACD is about to give a soft buy signal and the nest level on the upside is around 21,775 followed by 22,240 where the MA50 meets.
DAX (in EUR), one-year daily chart

DAX (in EUR), weekly five-year chart
The full name for abbreviations used in the previous text:
EMA 9: 9-day exponential moving average
Fibonacci: There are several Fibonacci lines used in technical analysis. Fibonacci numbers are a sequence in which each successive number is the sum of the two previous numbers.
MA20: 20-day moving average
MA50: 50-day moving average
MA100: 100-day moving average
MA200: 200-day moving average
MACD: Moving average convergence divergence
Risks
Credit risk of the issuer:
Investors in the products are exposed to the risk that the Issuer or the Guarantor may not be able to meet its obligations under the products. A total loss of the invested capital is possible. The products are not subject to any deposit protection.
Currency risk:
If the product currency differs from the currency of the underlying asset, the value of a product will also depend on the exchange rate between the respective currencies. As a result, the value of a product can fluctuate significantly.
External author:
This information is in the sole responsibility of the guest author and does not necessarily represent the opinion of Bank Vontobel Europe AG or any other company of the Vontobel Group. The further development of the index or a company as well as its share price depends on a large number of company-, group- and sector-specific as well as economic factors. When forming his investment decision, each investor must take into account the risk of price losses. Please note that investing in these products will not generate ongoing income.
The products are not capital protected, in the worst case a total loss of the invested capital is possible. In the event of insolvency of the issuer and the guarantor, the investor bears the risk of a total loss of his investment. In any case, investors should note that past performance and / or analysts' opinions are no adequate indicator of future performance. The performance of the underlyings depends on a variety of economic, entrepreneurial and political factors that should be taken into account in the formation of a market expectation.
Market risk:
The value of the products can fall significantly below the purchase price due to changes in market factors, especially if the value of the underlying asset falls. The products are not capital-protected
Product costs:
Product and possible financing costs reduce the value of the products.
Risk with leverage products:
Due to the leverage effect, there is an increased risk of loss (risk of total loss) with leverage products, e.g. Bull & Bear Certificates, Warrants and Mini Futures.
Disclaimer:
This information is neither an investment advice nor an investment or investment strategy recommendation, but advertisement. The complete information on the products (securities) mentioned herein, in particular the structure and risks associated with an investment, are described in the base prospectus, together with any supplements, as well as the final terms relating to the securities. The base prospectus and final terms constitute the solely binding sales documents for the products mentioned herein. It is recommended that potential investors read these documents before making any investment decision. The documents and the key information document are published on the website of the issuer, Vontobel Financial Products GmbH, Bockenheimer Landstrasse 24, 60323 Frankfurt am Main, Germany, on https://prospectus.vontobel.com and are available from the issuer free of charge. The approval of the prospectus should not be understood as an endorsement of the securities. The securities are products that are not simple and may be difficult to understand. This information includes or relates to figures of past performance. Past performance is not a reliable indicator of future performance. This information may only be distributed or published in countries where such distribution or publication is permitted by applicable law. As stated in the relevant base prospectus, the distribution of the securities mentioned in this information is subject to restrictions in certain jurisdictions. This advertisement may not be reproduced or redistributed without prior permission by Vontobel.
© Bank Vontobel Europe AG and / or affiliated companies. All rights reserved.