Focus on Micron and US non-farm payrolls


Eli Lilly & Co is one of the world's leading pharmaceutical companies. In recent periods, the company's financial performance has been supported by sales of products, including Mounjaro and Zepbound, while market participants continue to assess the potential commercial contribution of Foundayo.. During2026, Eli Lilly’s stock has underperformed against global pharmaceutical indices, creating potential for share price appreciation from current levels. Stock markets are likely to pay close attention to an interim report from Micron Technology later today, as well as to the US non-farm payroll figure on Friday, 2 October.
This will be the last weekly newsletter that Carlsquare produces on behalf of Vontobel. We would like to thank Vontobel and our readers for the opportunity to share our trading insights since we began producing this newsletter in 2019.
Case of the week: Eli Lilly, a pharma giant in a strong trend
Eli Lilly and Company (also referred to here as “Lilly”) is among the largest pharmaceutical companies by market capitalisation globally. In the first six months of 2026, the company reported revenue of approximately $23 billion, reflecting growth compared with the corresponding period of the previous year, supported primarily by sales of Mounjaro and Zepbound (Insert source). Although Foundayo, the obesity pill, had a slower launch than its main rival, the oral drug Wegovy (marketed by Novo), the obesity franchise has strengthened its position overall and gained market share in the lucrative weight-loss drug market.
Over the past five years, Lilly’s share has outperformed the US pharmaceuticals sector (as represented by the 'IHE' ETF in the graph below). However, in 2026, its performance will lag that of the overall sector, with an expected increase of around 10 per cent compared to approximately 20 per cent for the sector as a whole. Based on the company's current guidance of 'non-GAAP EPS in the range of $35.50 to $36.50', the price-earnings ratio for the current year (2026E) is 32.5–33.4x, compared to ~32.5x a year ago. Therefore, earnings growth is keeping up with the solid share price performance. The valuation remains markedly higher than that of most other 'Big Pharma' companies. This premium valuation, driven by strong growth prospects relative to the overall sector, arguably represents a potential downside risk in the event of earnings or outlook disappointments. However, there can be no assurance that these expectations will be met, and changes in earnings, company guidance, market sentiment or broader market conditions could have an impact on the share price. Investors should be aware that shares may fluctuate in value and may lose value over time.
Eli Lilly share price vs the US Pharmaceuticals ETF (IHE, USD), five-year chart

The next test will be whether Q3 earnings on 29 October show that demand and the launch of Foundayo are increasing quickly enough to boost confidence in the outlook. In the short term, presentations at the 2026 EASD scientific conference could also strengthen the argument for a wider cardiometabolic portfolio. The meeting runs from 28 September to 2 October. On 30 September, Lilly will present Phase 2 results for eloraTZP, a combination of the drug candidates eloralintide and tirzepatide (Zepbound).
Retatrutide, Eli Lilly’s most advanced obesity drug candidate and an investigational triple-hormone receptor peptide, is a key milestone in the company's pipeline, with a target date of early 2027. According to Lilly, the clinical data package is complete and ready to support applications for obesity, obstructive sleep apnoea, and knee osteoarthritis pain. The company plans to submit an application for market approval in the US in Q1 2027. A timely filing would strengthen Lilly's prospects of extending its lead into the next generation of obesity medicines.
Related Products
Eli Lilly (in USD), one-year daily chart

Eli Lilly (in USD), five-year weekly chart

Macro comments
Despite global uncertainty, PMI data for both the Eurozone and the US suggest an ongoing improvement in the economic outlook during the third quarter of 2026. The PMI average 52.5stood at in the Eurozone (up from 51.7 inQ2) and at 54.6 in the US (up from 53.9). The services sector, which largely reflects private consumption, has continued to improve this autumn. In the Eurozone, the index level reached 53.0 in September, marking the highest reading since April 2024. Leading indicators suggest positive prospects for corporate earnings in the short term. The PMI figures in the US reinforced expectations of a further key interest rate hike by the Fed in October.
Following weak demand at the 23 September auction of 5-year US Treasury notes, the yield on the five-year note settled at its highest level since 2007. Meanwhile, the yield on the 30-year Treasury note reached 5.4%, and the yield on the 10-year note rose to 5.11%. On 23 September, the likelihood of the Federal Reserve raising interest rates again at their next announcement on 28 October increased from 55% to almost 70%.
Calendar
Micron Technology, one of the world’s largest memory companies, will report its earnings later today (Wednesday 30 September). The macroeconomic news cycle begins with data on Japan’s industrial production and retail sales in August. Shortly afterwards, China's Purchasing Managers' Index (PMI) for September will be released. A few hours later, data will be released on Finland’s GDP for August, Denmark’s GDP for the second quarter and Sweden’s retail sales, as well as the weekly indicator of household consumption for August. The National Institute of Economic Research (NIESR) will present a forecast of the Swedish economic outlook. Next comes the UK's GDP for the second quarter. Germany will publish data on retail sales and import prices for August. France, Italy and Germany will report consumer price index (CPI) figures for September. The US is expected to release September's ADP private-sector employment data, as well as the final figures for second-quarter GDP, personal consumption, PCE inflation, the goods trade balance and wholesale inventories. The US is also expected to release the Chicago PMI for September, as well as weekly oil inventory statistics from the Department of Energy.
On Thursday 1 October, interim reports are expected interim reports from the Danish company Stolt-Nielsen, and from the US companies Nike and Accenture. Stock markets in mainland China will be closed on Thursday. Japan will publish the results of the Tankan survey for the manufacturing sector in the third quarter. Thursday will otherwise be dominated by the release of the September Manufacturing Purchasing Managers' Indexes (PMIs) from Japan, India, Russia, Sweden, Spain, Italy, France, Germany and the US.ill. Statistics on job cuts from Challenger and weekly jobless claims data from the US are also expected.
On Friday 2 October, the Eurozone Consumer Price Index for September will be released. Then, the US nonfarm payroll report will be expected. Consensus expectations are for 98 thousand new jobs to have been created in September. See the five-year chart of forecasts and actual outcomes below. US factory orders for August are also expected on Friday.
US non-farm payrolls (in thousands of new jobs), monthly five-year chart

Waiting for a trigger that will boost equities
In the US, equities have held up relatively well against increasing yields. As can be seen in the chart below, the S&P 500 is still trading above the 20-day moving average (MA20). However, a downward break opens the way to levels around 7,600, followed by the MA100, which is currently at 7,556. If yields continue to rise, a specific trigger will likely be needed to improve the outlook for the previous high to be tested.
Related Products
S&P500 (in USD), one-year daily chart

S&P500 (in USD), five-year weekly chart

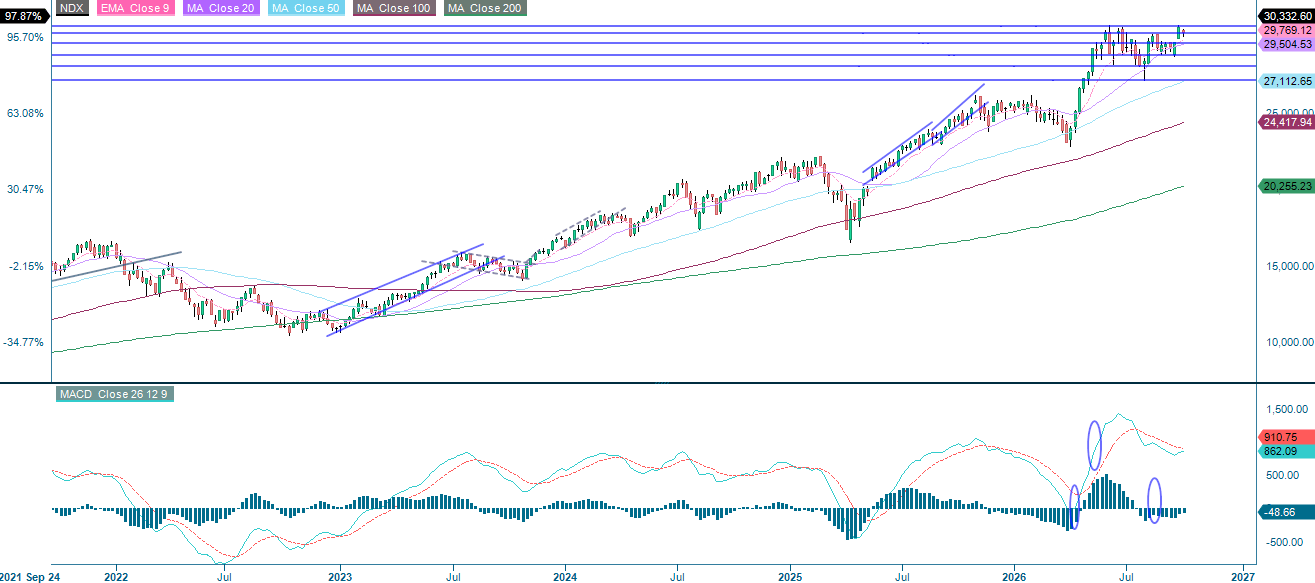
The tech-heavy Nasdaq-100 is trading above the EMA9 level and the 30,245 level, which is serving as the first level of support. The next step could be a break on the downside and a fall to the MA20, which is currently at 29,707.
Related Products
Nasdaq 100 (in USD), one-year daily chart

Nasdaq 100 (in USD), five-year weekly chart
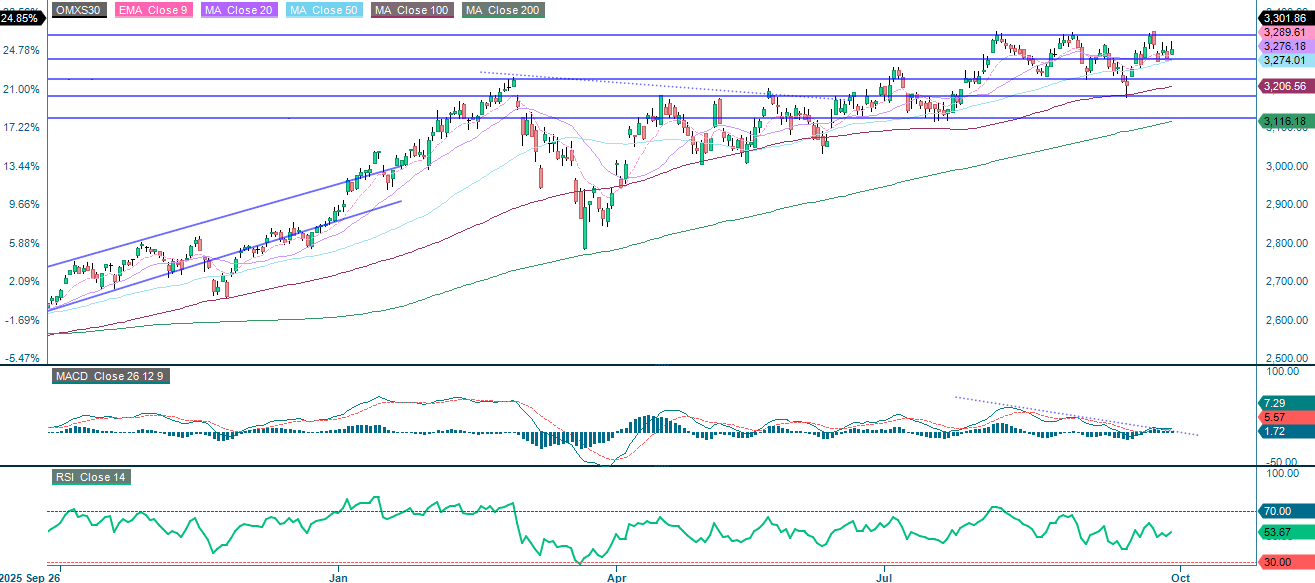
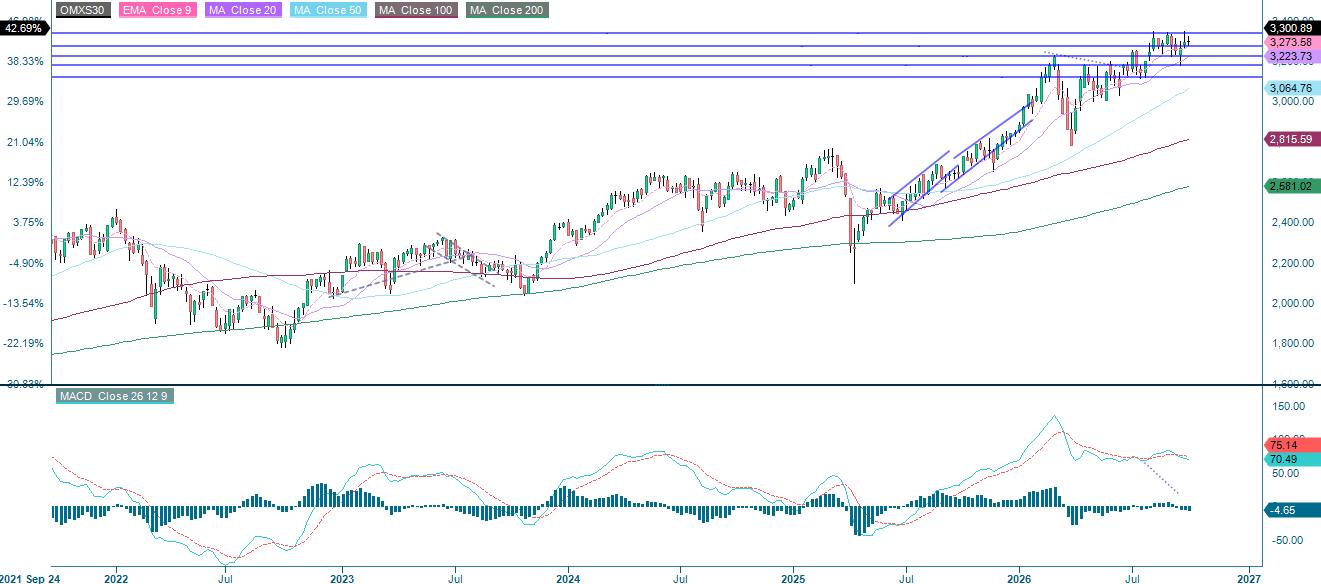
At the time of writing, the Swedish OMXS30 index is being supported by the 20-day moving average (MA20) and the rising 50-day moving average (MA50). A fall below 3,274 and 3,225 is a possibility.
OMX30 (in SEK), one-year daily chart
OMX30 (in SEK), five-year weekly chart
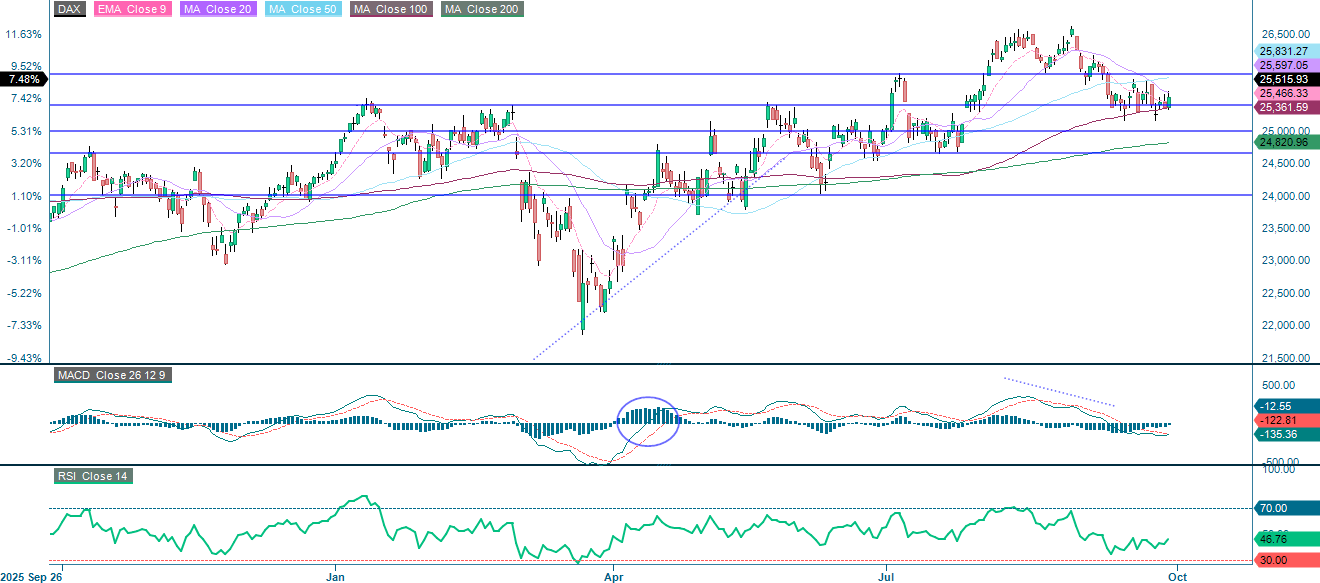
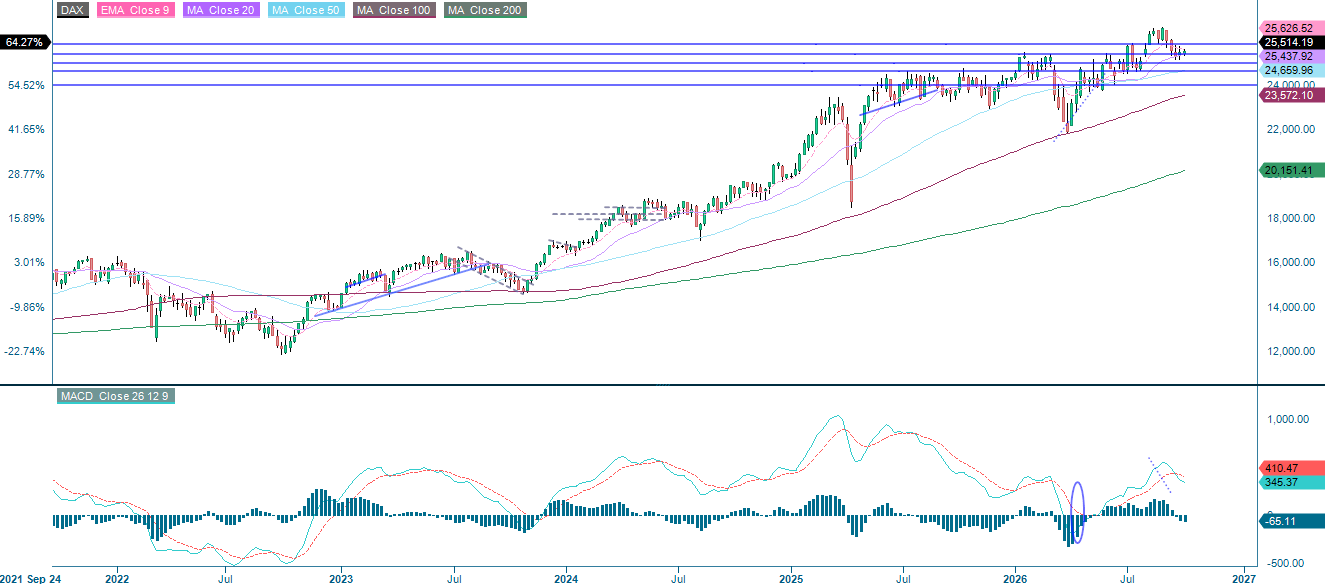
In Germany, the DAX is under pressure, trading below the falling MA20. The MA100, along with the 25,400 level, serves as support. If this level is broken, the next level to watch is around 25,000.
Related Products
DAX (in EUR), one-year daily chart
DAX (in EUR), five-year weekly chart
The full name for abbreviations used in the previous text:
EMA 9: 9-day exponential moving average
Fibonacci: There are several Fibonacci lines used in technical analysis. Fibonacci numbers are a sequence in which each successive number is the sum of the two previous numbers.
MA20: 20-day moving average
MA50: 50-day moving average
MA100: 100-day moving average
MA200: 200-day moving average
MACD: Moving average convergence divergence
Risks
Credit risk of the issuer:
Investors in the products are exposed to the risk that the Issuer or the Guarantor may not be able to meet its obligations under the products. A total loss of the invested capital is possible. The products are not subject to any deposit protection.
Currency risk:
If the product currency differs from the currency of the underlying asset, the value of a product will also depend on the exchange rate between the respective currencies. As a result, the value of a product can fluctuate significantly.
Market risk:
The value of the products can fall significantly below the purchase price due to changes in market factors, especially if the value of the underlying asset falls. The products are not capital-protected
Product costs:
Product and possible financing costs reduce the value of the products.
Risk with leverage products:
Due to the leverage effect, there is an increased risk of loss (risk of total loss) with leverage products, e.g. Bull & Bear Certificates, Warrants and Mini Futures.
External author:
This information is in the sole responsibility of the guest author and does not necessarily represent the opinion of Bank Vontobel Europe AG or any other company of the Vontobel Group. The further development of the index or a company as well as its share price depends on a large number of company-, group- and sector-specific as well as economic factors. When forming his investment decision, each investor must take into account the risk of price losses. Please note that investing in these products will not generate ongoing income.
The products are not capital protected, in the worst case a total loss of the invested capital is possible. In the event of insolvency of the issuer and the guarantor, the investor bears the risk of a total loss of his investment. In any case, investors should note that past performance and / or analysts' opinions are no adequate indicator of future performance. The performance of the underlyings depends on a variety of economic, entrepreneurial and political factors that should be taken into account in the formation of a market expectation.
Disclaimer:
This information is neither an investment advice nor an investment or investment strategy recommendation, but advertisement. The complete information on the products (securities) mentioned herein, in particular the structure and risks associated with an investment, are described in the base prospectus, together with any supplements, as well as the final terms relating to the securities. The base prospectus and final terms constitute the solely binding sales documents for the products mentioned herein. It is recommended that potential investors read these documents before making any investment decision. The documents and the key information document are published on the website of the issuer, Vontobel Financial Products GmbH, Bockenheimer Landstrasse 24, 60323 Frankfurt am Main, Germany, on https://prospectus.vontobel.com and are available from the issuer free of charge. The approval of the prospectus should not be understood as an endorsement of the securities. The securities are products that are not simple and may be difficult to understand. This information includes or relates to figures of past performance. Past performance is not a reliable indicator of future performance. This information may only be distributed or published in countries where such distribution or publication is permitted by applicable law. As stated in the relevant base prospectus, the distribution of the securities mentioned in this information is subject to restrictions in certain jurisdictions. This advertisement may not be reproduced or redistributed without prior permission by Vontobel.
© Bank Vontobel Europe AG and / or affiliated companies. All rights reserved.