Resilient stock market sees optimism return


This week's case study focuses on H&M, which is set to release its third-quarter report for 2026 on Thursday, 24 September. After rising over the summer, the stock has fallen again towards the SEK 160 level, which has historically acted as a technical support level. Last week, stock markets experienced a brief period of concern about interest rates following the Fed’s announcement. However, optimism had returned by Monday 21 September, driven by signs of increased oil shipments through the Strait of Hormuz.
Case of the week: H&M shares are near support levels
On Thursday, 24 September, the Swedish clothing company H&M will kick off the third-quarter 2026 earnings season on the Stockholm Stock Exchange. For H&M, however, the upcoming quarterly results cover the period from 1 June to 31 August. While the company's first-quarter 2026 results exceeded market expectations by 6%, its second-quarter results fell short of analysts' forecasts by 7%.
The focus regarding H&M’s earnings is primarily on reducing administrative costs, specifically those below the cost of goods sold, with the aim of achieving an operating margin of 10%. With an operating margin of 8.5% for the trailing twelve months of 2025/26, H&M still has some way to go to reach its target.
In order to reach this target, it would be beneficial for the H&M Group to increase sales rather than relying solely on efficiency measures such as reducing administrative costs. However, this is unlikely to be reflected in H&M's quarterly report for this period, given that retail trading volume in the Eurozone fell by 0.6% in July 2026. Nevertheless, retail sales increased by 3.4% in the United Kingdom between June and August 2026.
A disadvantage for H&M is that the US dollar has recently strengthened, increasing the company's purchasing costs. However, the dollar’s appreciation is more pronounced against the Swedish krona (SEK) than against the euro. The H&M Group has an annual payment inflow. of around €40 billion and outflows of approximately $60 billion. The SEK is not even among the group's four most important currencies for cash flows, which is linked to the share of revenue generated in Sweden — just 5- 6% of the group's total.
With the share price standing at SEK 167.85 at the time of writing, H&M is currently trading at a P/E ratio of 22x — a figure which would fall to 18x were the company to reach its target operating margin of 10%. The strongest argument for investing in H&M stock is its annual dividend of SEK 7.10, yielding 4.2% at the current share price. Additionally, the company regularly launches share buyback programmes.
While the stock does not appear particularly strong from a technical standpoint, it has now fallen just above the MA100 level on the five-year share price chart.
H&M B (in SEK), one-year daily chart

H&M B (in SEK), five-year weekly chart

Macro comments
As expected, the Federal Reserve raised its benchmark interest rate for the first time in over three years on Wednesday, 16 September. Backed by all twelve voting members, the 0.25 percentage point increase brought the US benchmark rate into the 3.75–4.00 per cent range. Interest rate projections suggest a further increase this year and indicate the possibility of an additional rise in 2027. The market reaction was also hawkish, characterised by sharper rate increases at the short end of the curve compared to long maturities, and a stronger US dollar.
Global stock markets lost momentum in the wake of last week’s rate increase, but have since recovered. Despite the ongoing conflict in the Middle East, bulls were back in charge on Tuesday 21 September, as oil prices fell. The US announced that the volume of oil and cargo passing through the Strait of Hormuz was the highest it had been in six months. Trump indicated that he would be willing to hold further talks with Iran amid the UN General Assembly this week.
The one-month, year-to-date (YTD) and five-year performances of equity indices ranked by one-month performance

Calendar
On Wednesday, 23 September, the focus of the macroeconomic news agenda will be on the September Purchasing Managers' Indexes (PMIs) from India, France, Germany and the Eurozone. We are also expecting weekly oil inventory data from the US Department of Energy.
On Thursday, 24 September, H&M will release its quarterly report. ABB will be holding a presentation on data centre solutionsThe day will begin with the release of Japan’s Purchasing Managers' Index (PMI) for September. A few hours later, we will find out about French industrial expectations for September. Next is Germany’s Ifo Index, also for September. We are also awaiting interest rate decisions from three European central banks: Sweden, Norway and Switzerland. The day will conclude in the US with the release of the second-quarter current account balance, weekly jobless claims, new home sales for August, and the Kansas Fed Manufacturing Index for September.
Stock markets in mainland China will be closed on Friday, 25 September. Figures for Swedish household lending and the producer price index, both for August, will be released. Germany will publish the GfK consumer confidence index for October.. Spain's Q2 GDP will also be published. The US will publish data on durable goods orders for August and the Michigan consumer sentiment index for September.
DAX lagging. Is this something to look at for the contrarian?
The S&P 500 bounced back nicely from the MA100, while the MACD has turned positive. With the continued help of falling oil prices and yields, the index could therefore be on its way to testing previous highs.
Related Products
S&P500 (in USD), one-year daily chart

S&P500 (in USD), five-year weekly chart

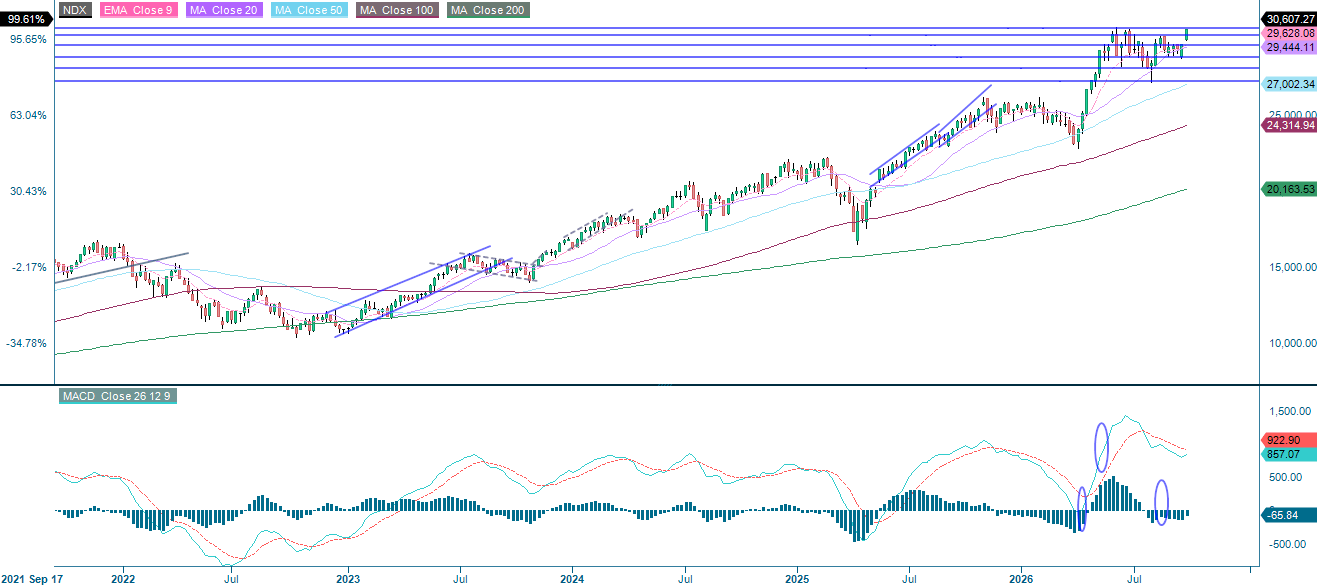
The same applies to the Nasdaq-100, which is even more sensitive to changes in interest rates, with an impact in both directions.
Related Products
Nasdaq 100 (in USD), one-year daily chart

Nasdaq 100 (in USD), five-year weekly chart
Meanwhile, in Sweden, the OMXS30 is currently approaching previous highs. The question is whether there is enough momentum in the market for the index to reach new highs. If not, the first level of support can be found at around 3,275.
OMX30 (in SEK), one-year daily chart

OMX30 (in SEK), five-year weekly chart

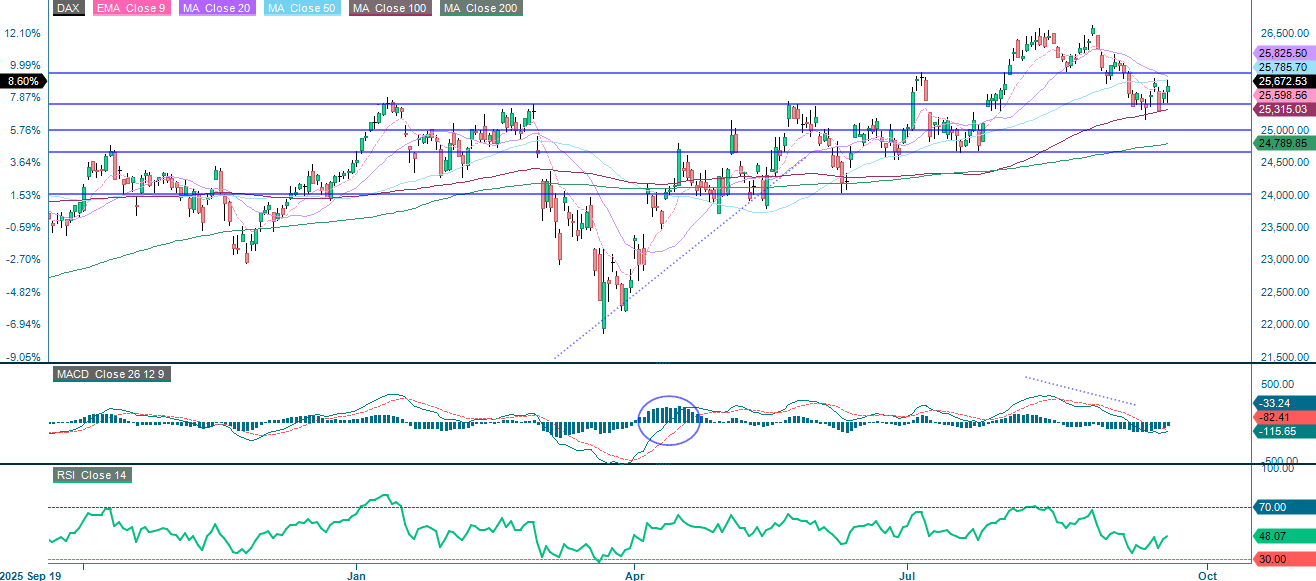
As the chart below shows, the German DAX is clearly lagging. Perhaps the long DAX, short OMXS spread could be of interest to the contrarian investor.
Related Products
DAX (in EUR), one-year daily chart
DAX (in EUR), five-year weekly chart

The full name for abbreviations used in the previous text:
EMA 9: 9-day exponential moving average
Fibonacci: There are several Fibonacci lines used in technical analysis. Fibonacci numbers are a sequence in which each successive number is the sum of the two previous numbers.
MA20: 20-day moving average
MA50: 50-day moving average
MA100: 100-day moving average
MA200: 200-day moving average
MACD: Moving average convergence divergence
Risks
Credit risk of the issuer:
Investors in the products are exposed to the risk that the Issuer or the Guarantor may not be able to meet its obligations under the products. A total loss of the invested capital is possible. The products are not subject to any deposit protection.
Currency risk:
If the product currency differs from the currency of the underlying asset, the value of a product will also depend on the exchange rate between the respective currencies. As a result, the value of a product can fluctuate significantly.
Market risk:
The value of the products can fall significantly below the purchase price due to changes in market factors, especially if the value of the underlying asset falls. The products are not capital-protected
Product costs:
Product and possible financing costs reduce the value of the products.
Risk with leverage products:
Due to the leverage effect, there is an increased risk of loss (risk of total loss) with leverage products, e.g. Bull & Bear Certificates, Warrants and Mini Futures.
External author:
This information is in the sole responsibility of the guest author and does not necessarily represent the opinion of Bank Vontobel Europe AG or any other company of the Vontobel Group. The further development of the index or a company as well as its share price depends on a large number of company-, group- and sector-specific as well as economic factors. When forming his investment decision, each investor must take into account the risk of price losses. Please note that investing in these products will not generate ongoing income.
The products are not capital protected, in the worst case a total loss of the invested capital is possible. In the event of insolvency of the issuer and the guarantor, the investor bears the risk of a total loss of his investment. In any case, investors should note that past performance and / or analysts' opinions are no adequate indicator of future performance. The performance of the underlyings depends on a variety of economic, entrepreneurial and political factors that should be taken into account in the formation of a market expectation.
Disclaimer:
This information is neither an investment advice nor an investment or investment strategy recommendation, but advertisement. The complete information on the products (securities) mentioned herein, in particular the structure and risks associated with an investment, are described in the base prospectus, together with any supplements, as well as the final terms relating to the securities. The base prospectus and final terms constitute the solely binding sales documents for the products mentioned herein. It is recommended that potential investors read these documents before making any investment decision. The documents and the key information document are published on the website of the issuer, Vontobel Financial Products GmbH, Bockenheimer Landstrasse 24, 60323 Frankfurt am Main, Germany, on https://prospectus.vontobel.com and are available from the issuer free of charge. The approval of the prospectus should not be understood as an endorsement of the securities. The securities are products that are not simple and may be difficult to understand. This information includes or relates to figures of past performance. Past performance is not a reliable indicator of future performance. This information may only be distributed or published in countries where such distribution or publication is permitted by applicable law. As stated in the relevant base prospectus, the distribution of the securities mentioned in this information is subject to restrictions in certain jurisdictions. This advertisement may not be reproduced or redistributed without prior permission by Vontobel.
© Bank Vontobel Europe AG and / or affiliated companies. All rights reserved.