Inflation matters to Warsh

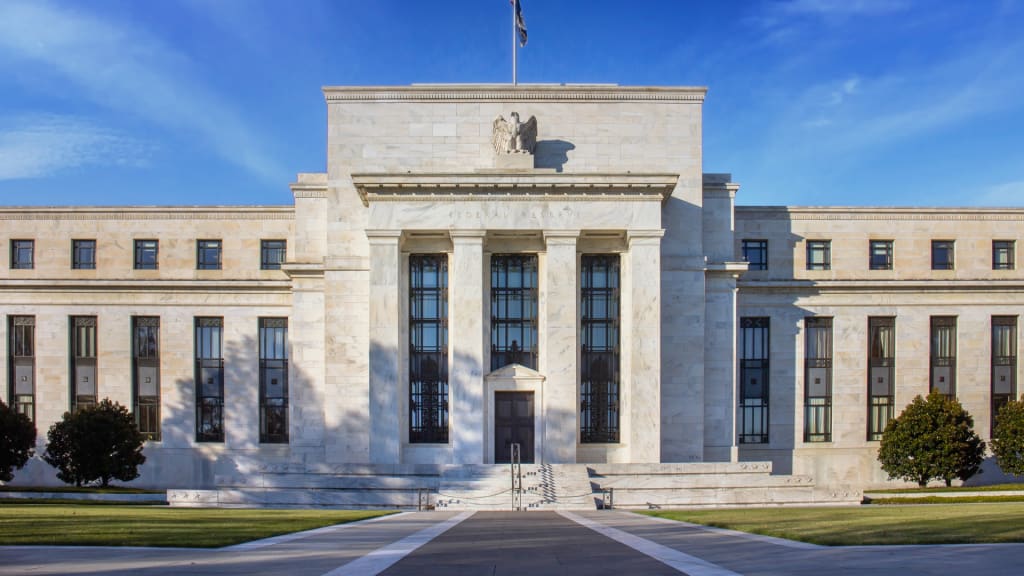
Despite the recent rebound, Bitcoin remains around 28% below its level a year ago and has fallen in value over the course of the year. The Bitcoin rally was supported by several catalysts linked to the US Treasury, President Trump and institutional demand. From a broader perspective, the stock market was buoyed by Nvidia's robust interim report last week, while Fed chairman Kevin Warsh delivered a more hawkish speech than anticipated at the Jackson Hole symposium.
Case of the week: A genuine turn for Bitcoin?
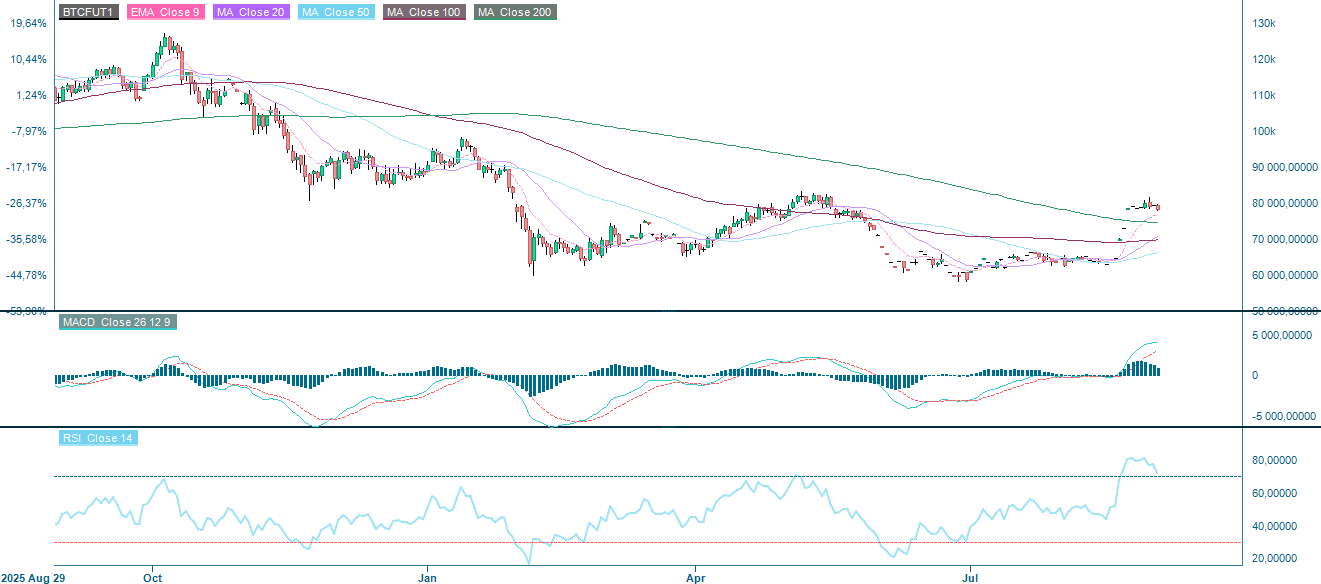
As of 1 September 2026, Bitcoin is trading at around USD 78,400 implying a market capitalisation of approximately USD 1.56 trillion. After falling to nearly USD 63,000 in July, it rallied by roughly 24% in August, its strongest monthly increase since the rally following the 2024 halving.
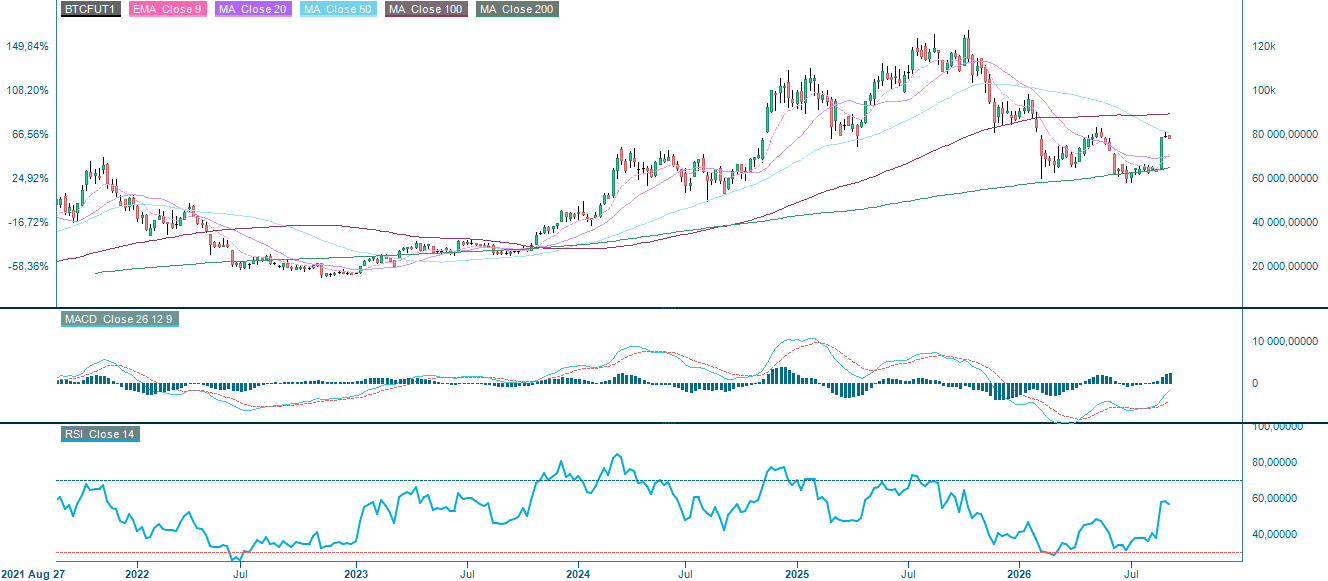
This recovery follows a sharp correction. Bitcoin reached an all-time high of USD 126,198 in October 2025, before losing over half of its value. Despite the recent rebound, it remains around 28% below its level a year ago and is still down year to date. The central question is whether August’s rally marks a genuine change in trend or is simply another liquidity-driven move.
Several catalysts helped support the rally. The US Treasury doubled its long-term bond buyback operations from USD 2 billion to USD 4 billion per session, a liquidity measure that some analysts have linked to Bitcoin’s advance. Political and regulatory developments also improved sentiment. For example, President Trump met with executives from Coinbase and Robinhood, urged Congress to pass the Clarity Act and pledged that the US would remain the “undisputed leader” in crypto.
Institutional demand also provided additional support. Spot Bitcoin ETFs recorded net inflows of approximately USD 3.3 billion of net inflows in August, while Strategy, (formerly known as MicroStrategy) purchased 4,603 BTC — more than the amount mined during the same period. This illustrates how corporate treasury demand can impact an asset with a limited supply.
The longer-term investment case is based on Bitcoin’s maximum supply of 21 million coins, the establishment of a US Strategic Bitcoin Reserve and the continued growth of corporate holdings. Supporters argue that these developments are helping Bitcoin mature into an institutional and macroeconomic asset.
However, not all of August’s gains necessarily reflect new long-term demand. Part of the increase was driven by short covering, and these mechanically driven rallies can fade quickly. In the near term, the outcome of the Federal Reserve’s 15–16 September FOMC meeting is likely to influence Bitcoin’s direction.
While the rally is supported by identifiable catalysts, but the broader debate remains unresolved. Sustained movement above the USD 80,000–83,000 resistance area would provide stronger evidence that the trend has genuinely turned. Until then, Bitcoin’s structural adoption story remains compelling, but should be considered alongside its continued sensitivity to liquidity, investor positioning and market sentiment.
Related Products
Bitcoin future (in USD), one-year daily chart
Bitcoin future (in USD), five-year weekly chart
Macro comments
On 26 August, Nvidia reported stronger-than-expected quarterly results. Sales amounted to $96.2 billion, which was 4%, above expectations and represented 105% growth. Adjusted earnings per share were $2.10, surpassing forecasts by 6%. The gross margin was 75%, in line with forecasts. The company is projecting revenue of between $106 billion and $110 billion for the current quarter, whereas analysts had expected $104.1 billion. The company stated that it expects 70% growth for the 2028 fiscal year (beginning January 2027), which is significantly higher than the market's 44% expectation.
In his first speech as chairman of the Federal Reserve at the Jackson Hole conference in the US state of Wyoming, Kevin Warsh reminded the market that he takes rising prices seriously. He highlighted '65 months of sustained, elevated inflation' and acknowledged that the progress made over the past two years in reducing price growth has been 'modest'. He then continued, “While this summer’s PCE and CPI readings were better than expected, they do not indicate a meaningful improvement in underlying trends.”. Following Warsh’s speech, bond yields rose as the likelihood of a rate increase in September increased. By late Friday afternoon on 28 August, the futures market was pricing in a 58% chance of a 0.25 percentage point increase at the Fed’s September meeting, up from 35% the previous day.
Calendar
On Wednesday, 2 September, an interim report from US companies Broadcom and FedEx are expected, while Volvo Cars will publish their sales figures for June to August. Turning to the macroeconomic agenda, the focus will be on the US, with the release of ADP private-sector employment data for August and July factory orders. as well as weekly oil inventory figures from the Department of Energy and the Federal Reserve’s Beige Book. The Bank of Canada will also announce its interest rate decision.
On Thursday 3 September, interim reports from the Swedish retailer Clas Ohlson and the US technology company Dell are expected. In terms of macroeconomics, the day will be dominated by the release of purchasing managers' data for the services sector in August from Japan, China, Sweden, Spain, Italy, France, Germany, the Eurozone, the UK and the US.The Eurozone's July producer price index figures are also expected. From the US, we will also see August layoff statistics from Challenger, the July trade balance and weekly jobless claims.
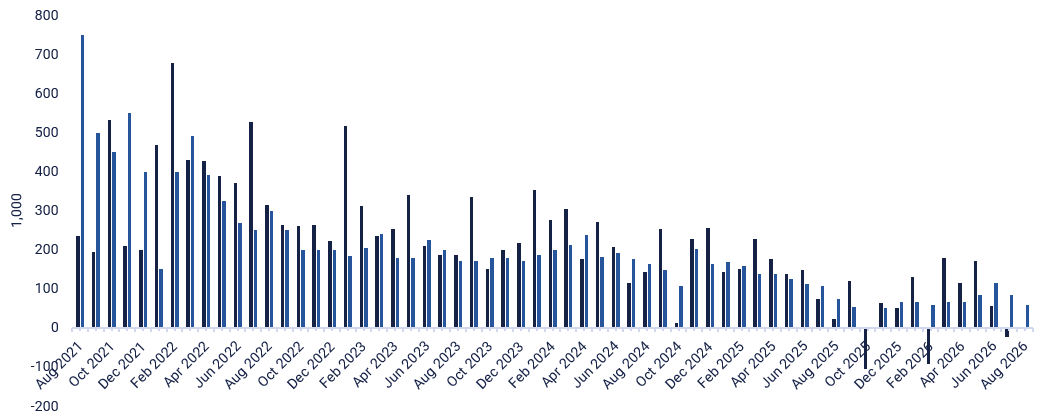
The Norwegian Air's traffic figures for August will be received on Friday 4 September. The release of macroeconomic data will begin with Japanese household consumption figures for July. Next, the current account balance for Sweden in the second quarter, as well as the retail sales figures for the Eurozone in July, will be published. The day will conclude with the US Non-Farm Payroll report for August (see the five-year monthly chart below), which could have implications for the Federal Reserve’s future interest rate decisions.
US non-farm payrolls (in thousands of new jobs), monthly five-year chart
The risk remains on the downside
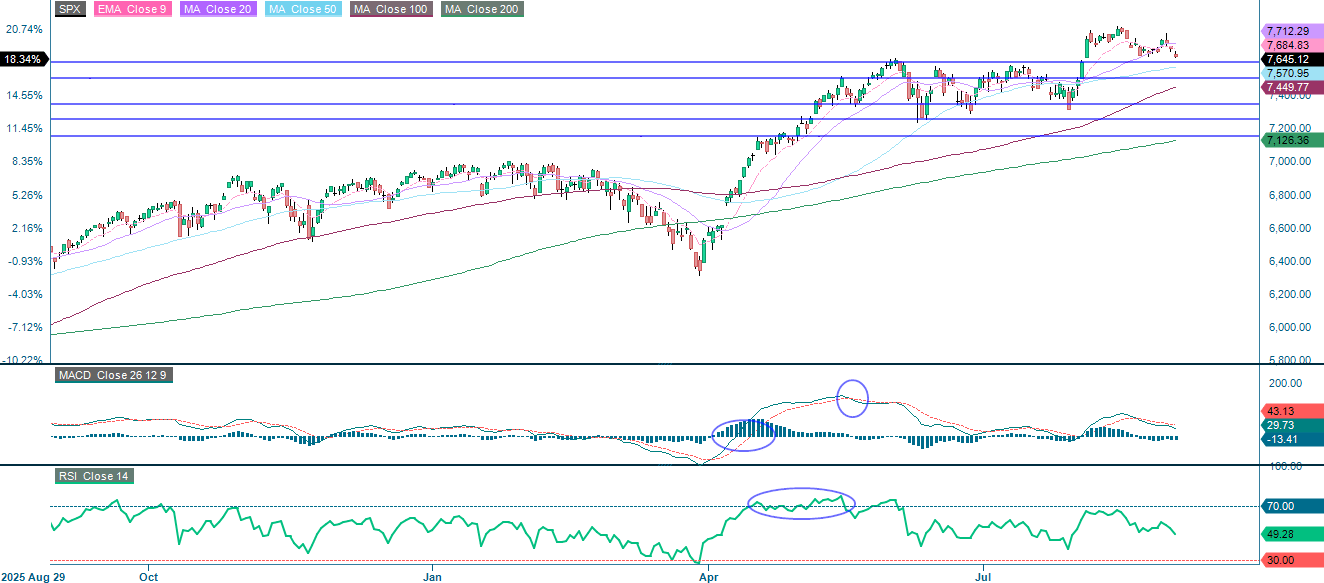
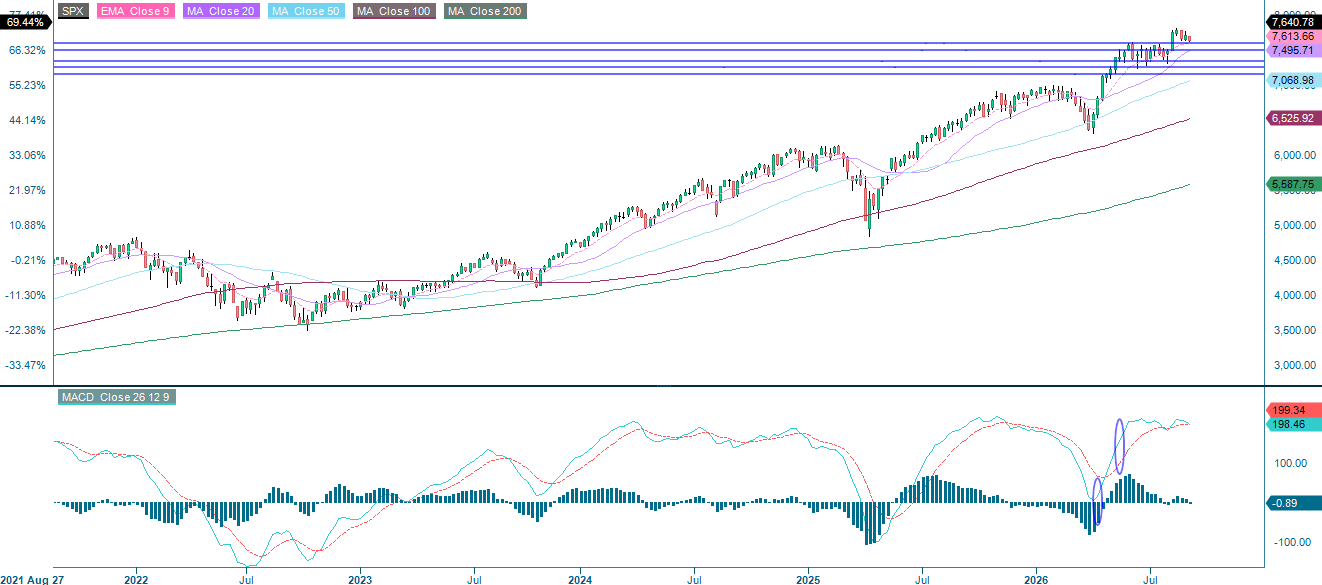
There is still downside risk for the S&P 500. As can be seen in the chart below, although momentum is still positive, it appears to be fading. The first level of support is at 7,600, followed by the MA50, which is currently at 7,571. Breaking below these levels could open the way towards 7,500. Oil prices remain an important factor to monitor. Easing oil prices could help to revive investor optimism. Conversely, MA20, currently at 7,712, represents the first level of resistance.
Related Products
S&P500 (in USD), one-year daily chart
S&P500 (in USD), five-year weekly chart
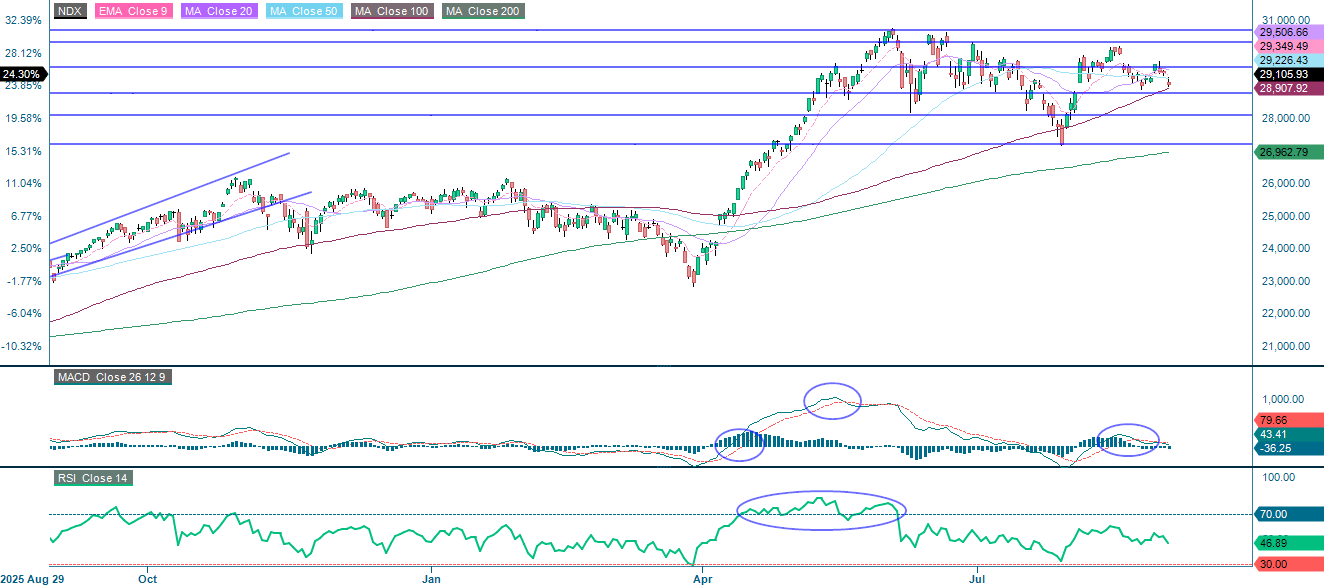
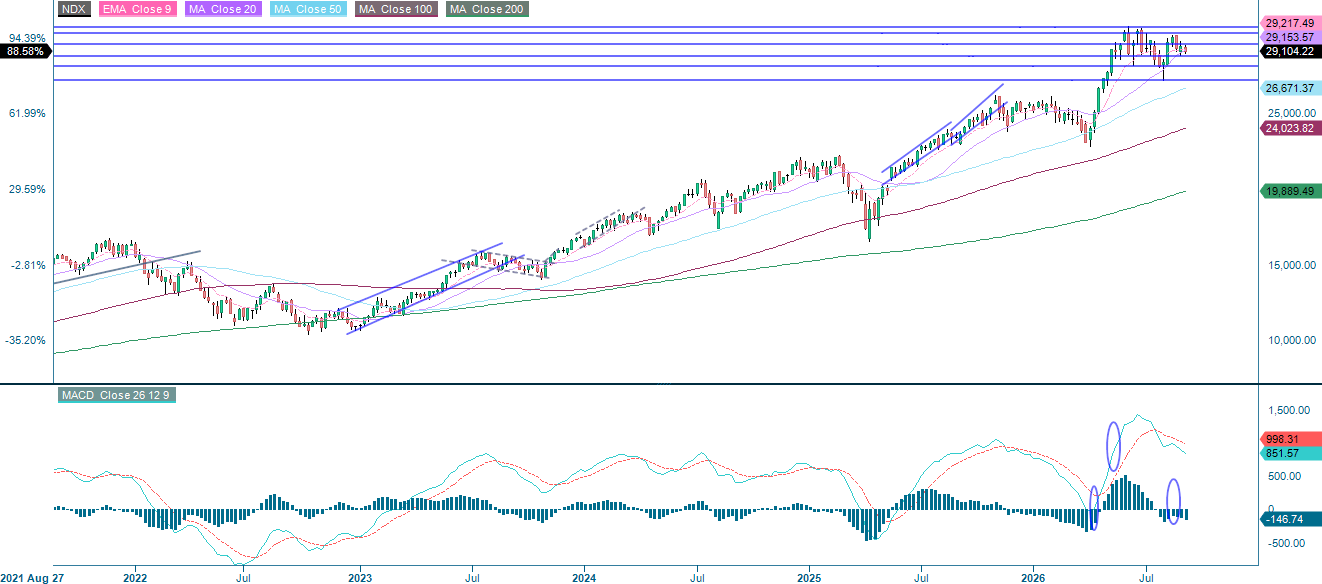
Rising oil prices and higher interest rates are putting further pressure on the technology-focused Nasdaq-100 index. As can be seen in the chart below, the index is currently testing its MA100 at 29,105. Breaking below this level could expose support at around 28,775, with a further decline potentially opening the way towards 28,100.
Related Products
Nasdaq 100 (in USD), one-year daily chart
Nasdaq 100 (in USD), five-year weekly chart
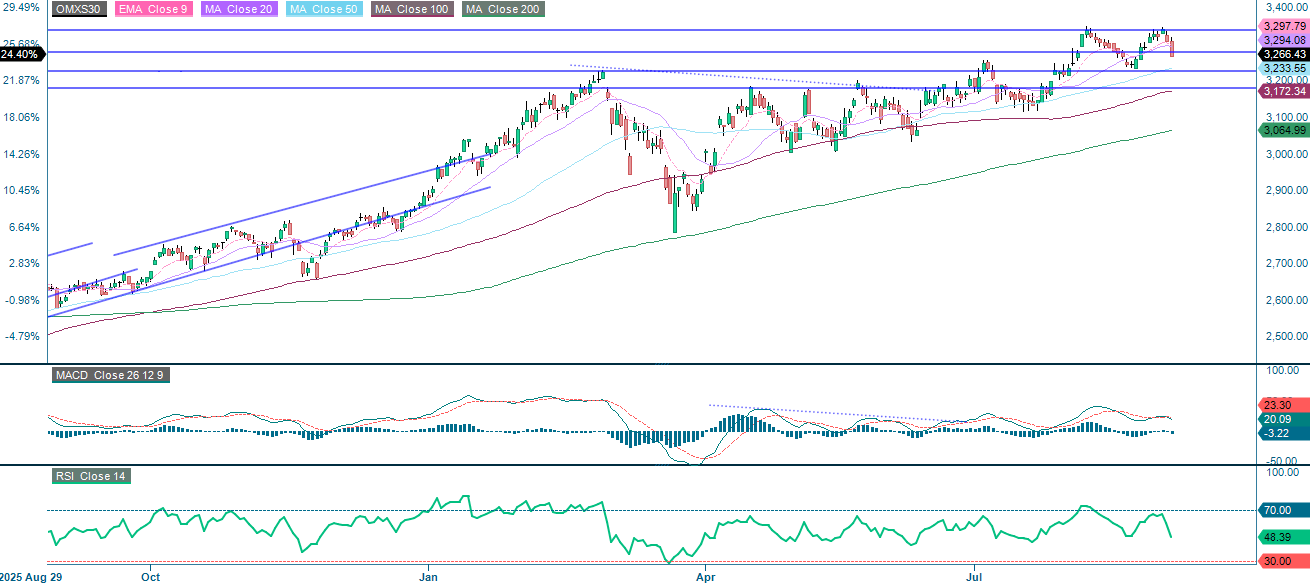
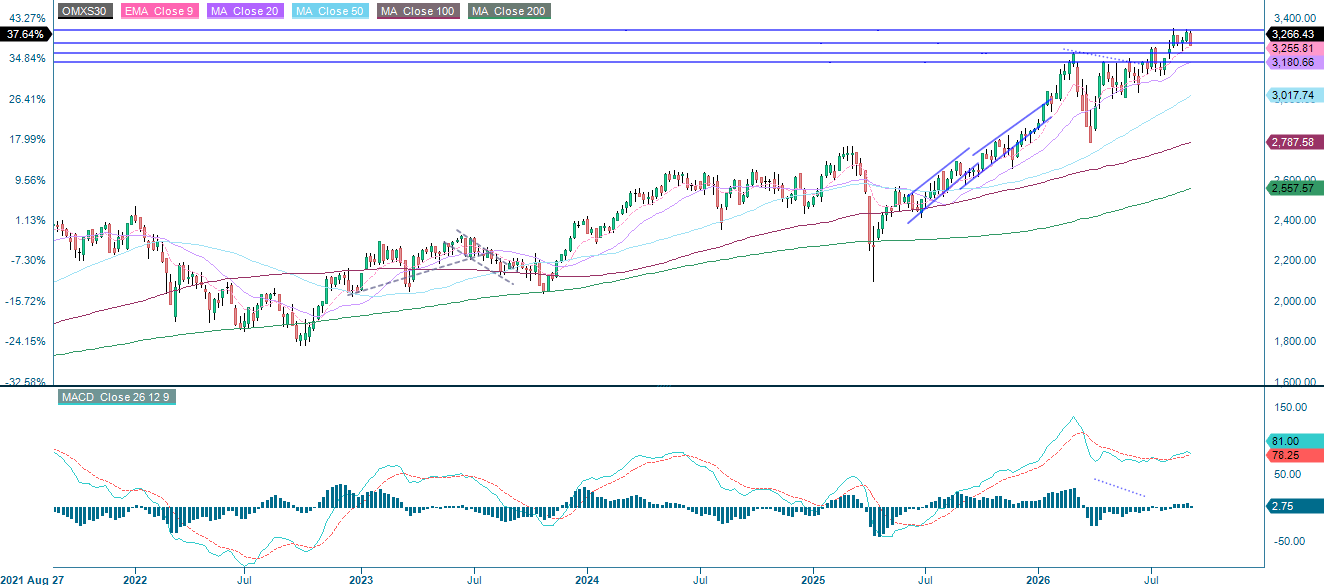
The OMXS30 in Sweden closed below the support level of around 3,275, and it is possible that it may be heading towards the MA50, which is currently at 3,233.
OMX30 (in SEK), one-year daily chart
OMX30 (in SEK), five-year weekly chart
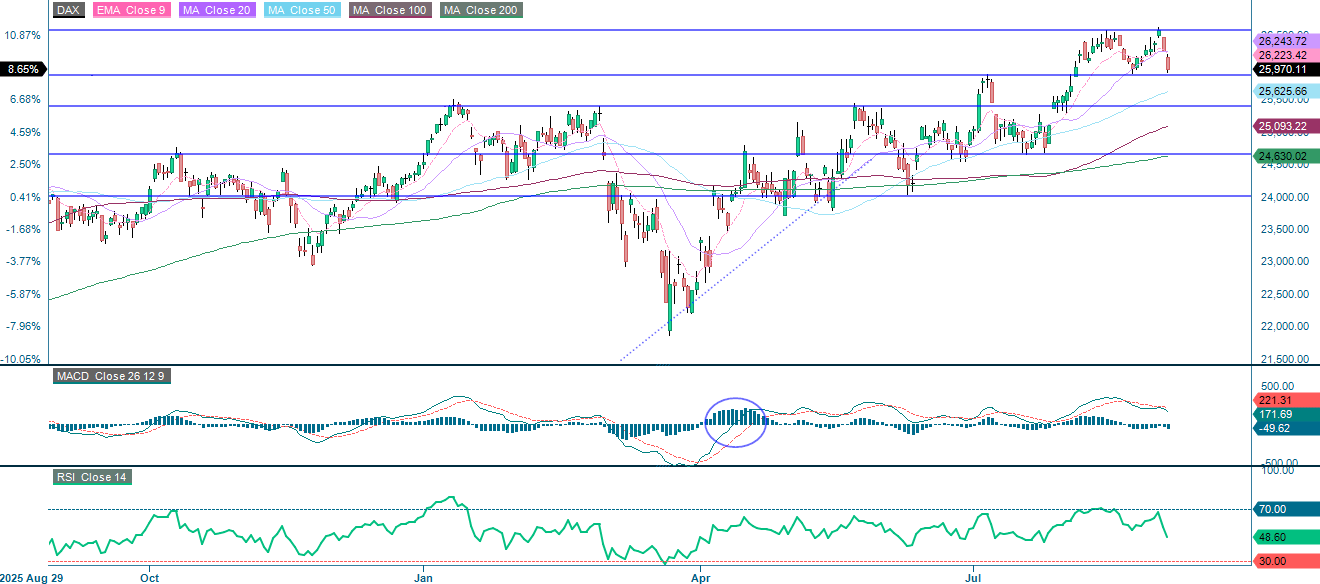
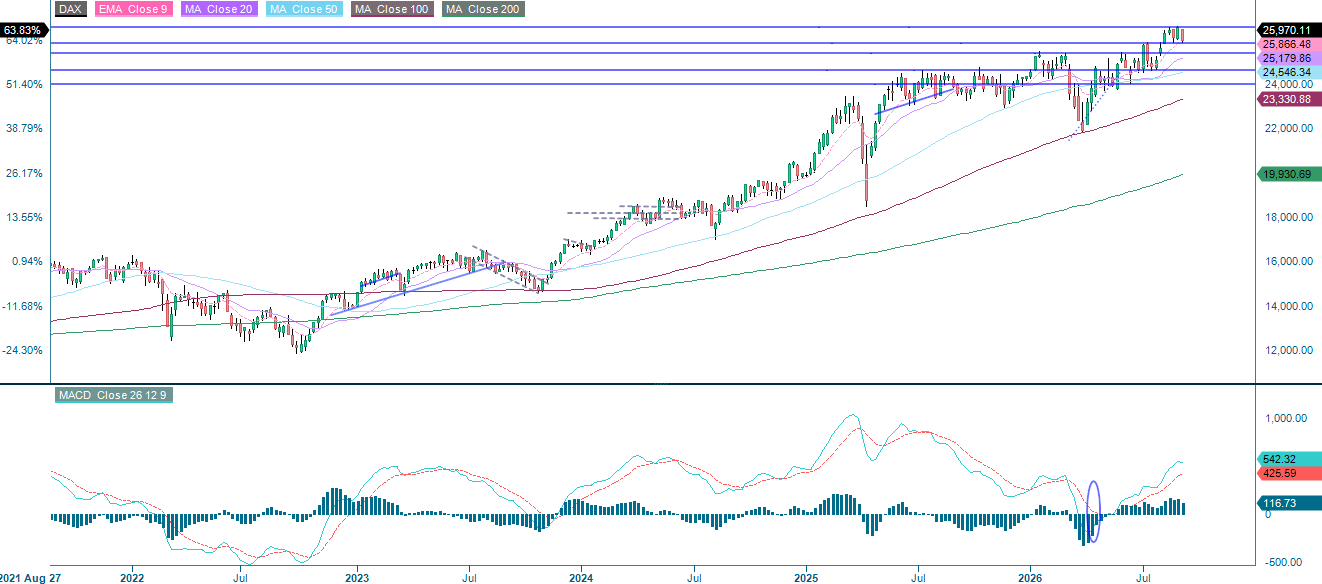
Yesterday, the DAX closed just above the support level of 25,820. The next level to watch on the downside is MA50, which is currently at 25,626.
Related Products
DAX (in EUR), one-year daily chart
DAX (in EUR), five-year weekly chart
The full name for abbreviations used in the previous text:
EMA 9: 9-day Exponential Moving Average
Fibonacci: There are several Fibonacci lines used in technical analysis. Fibonacci numbers are a sequence in which each successive number is the sum of the two previous numbers.
MA20: 20-Day Moving Average
MA50: 50-Day moving Average
MA100: 100-Day Moving Average
MA200: 200-Day Moving Average
MACD: Moving Average Convergence Divergence
Risks
Credit risk of the issuer:
Investors in the products are exposed to the risk that the Issuer or the Guarantor may not be able to meet its obligations under the products. A total loss of the invested capital is possible. The products are not subject to any deposit protection.
Currency risk:
If the product currency differs from the currency of the underlying asset, the value of a product will also depend on the exchange rate between the respective currencies. As a result, the value of a product can fluctuate significantly.
Market risk:
The value of the products can fall significantly below the purchase price due to changes in market factors, especially if the value of the underlying asset falls. The products are not capital-protected
Product costs:
Product and possible financing costs reduce the value of the products.
Risk with leverage products:
Due to the leverage effect, there is an increased risk of loss (risk of total loss) with leverage products, e.g. Bull & Bear Certificates, Warrants and Mini Futures.
External author:
This information is in the sole responsibility of the guest author and does not necessarily represent the opinion of Bank Vontobel Europe AG or any other company of the Vontobel Group. The further development of the index or a company as well as its share price depends on a large number of company-, group- and sector-specific as well as economic factors. When forming his investment decision, each investor must take into account the risk of price losses. Please note that investing in these products will not generate ongoing income.
The products are not capital protected, in the worst case a total loss of the invested capital is possible. In the event of insolvency of the issuer and the guarantor, the investor bears the risk of a total loss of his investment. In any case, investors should note that past performance and / or analysts' opinions are no adequate indicator of future performance. The performance of the underlyings depends on a variety of economic, entrepreneurial and political factors that should be taken into account in the formation of a market expectation.
Disclaimer:
This information is neither an investment advice nor an investment or investment strategy recommendation, but advertisement. The complete information on the products (securities) mentioned herein, in particular the structure and risks associated with an investment, are described in the base prospectus, together with any supplements, as well as the final terms relating to the securities. The base prospectus and final terms constitute the solely binding sales documents for the products mentioned herein. It is recommended that potential investors read these documents before making any investment decision. The documents and the key information document are published on the website of the issuer, Vontobel Financial Products GmbH, Bockenheimer Landstrasse 24, 60323 Frankfurt am Main, Germany, on https://prospectus.vontobel.com and are available from the issuer free of charge. The approval of the prospectus should not be understood as an endorsement of the securities. The securities are products that are not simple and may be difficult to understand. This information includes or relates to figures of past performance. Past performance is not a reliable indicator of future performance. This information may only be distributed or published in countries where such distribution or publication is permitted by applicable law. As stated in the relevant base prospectus, the distribution of the securities mentioned in this information is subject to restrictions in certain jurisdictions. This advertisement may not be reproduced or redistributed without prior permission by Vontobel.
© Bank Vontobel Europe AG and / or affiliated companies. All rights reserved.