AI-driven market surge


The market rise in the last three months can be explained in one word: AI.
In mid-February, I published this article on the subject of AI - Artificial Intelligence - here on Vontobel's blog. At the time, there was a lot of fuss about AI in the media after version 3 of Chat GPT had shown explosive growth from the end of 2022 into 2023. GPT is an abbreviation for Generative Pre-trained Transformer and the term is used for a type of extensive language- models powered by artificial intelligence (AI). ChatGPT uses plain text as input and gives answers reminiscent of talking to a human. Since February, GPT-4 has been released in mid-March, and Microsoft has integrated this into its "Edge" browser available on both web and mobile.
The big difference between GPT3 and GPT4 is the number of parameters the models are trained on, what they accept as input and what they give as output. Briefly simplified, you can say that GPT4 is a far more open model than 3. It accepts both text, images and graphics as input and can also provide this as well as programming code as output. The model's parameters are not known or limited in the same way as for 3 as it, with its open link to the internet's many sources, is able to constantly update and renew itself.
This has led to a huge innovation in tools connected to this AI model, and it is safe to say that we have only seen the beginning of this. Many work processes can be simplified and made more efficient by adopting this technology. I use it myself and include some examples in this article.
AI-effects in the stock market
AI is definitely the hottest topic in the stock market, and this is happening against a backdrop of the wider market climate being complicated. Interest rates around the world have risen sharply to curb inflation. This is usually negative for the stock market, and there is talk that several of the world's major economies will end up in recession (negative growth). The macro figures show clear signs of cooling, but at the same time we see a relatively robust American economy. Likewise, the Q1 figures from the companies have shown signs of weakness compared to last year, but are still better than expected. The rise in interest rates has led to some bank collapses in the USA, and there is also unrest about raising the debt ceiling. In sum, the direction is confusing, but somewhat better than many might have expected and thought. The broad market has gone sideways since mid-February, with the S&P 500 roughly unchanged in recent months.
At the same time, the NASDAQ 100 has risen 14% since I published the AI article in February and the element of technology stocks is also what makes the S&P 500 flat and not down during this period. So one would perhaps think that the rise in technology shares has been broad? It definitely hasn’t. You find a very mixed picture when you look at the individual shares. In general, it can be said that stocks with earnings linked to companies' investments or private individuals' consumption have largely shown a weak development.
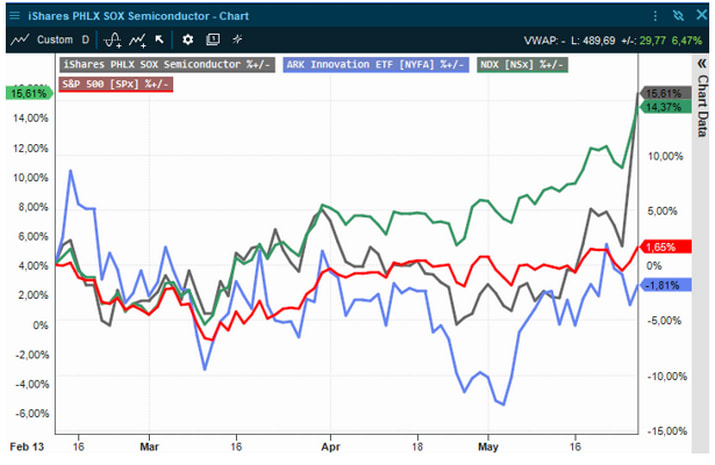
The clearest exception is stocks that can be related in one way or another to the topic of AI. The chart below illustrates this.
Performance of PHLX Semiconductor Index, 5 years weekly chart

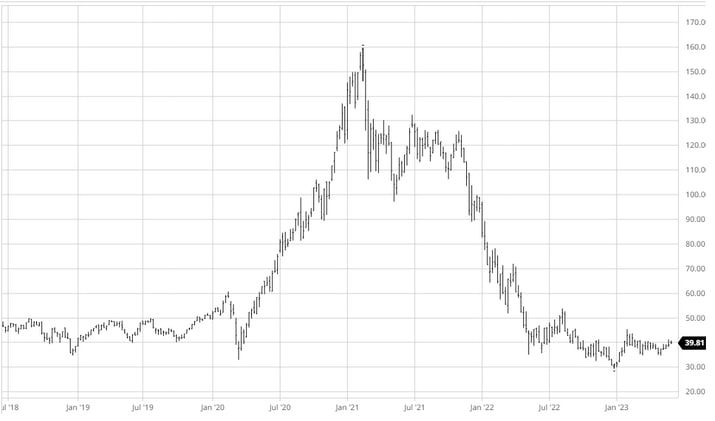
Performance of Ark Innovation ETF, 5 years weekly chart
Performance of Nasdaq 100, 5 years weekly chart

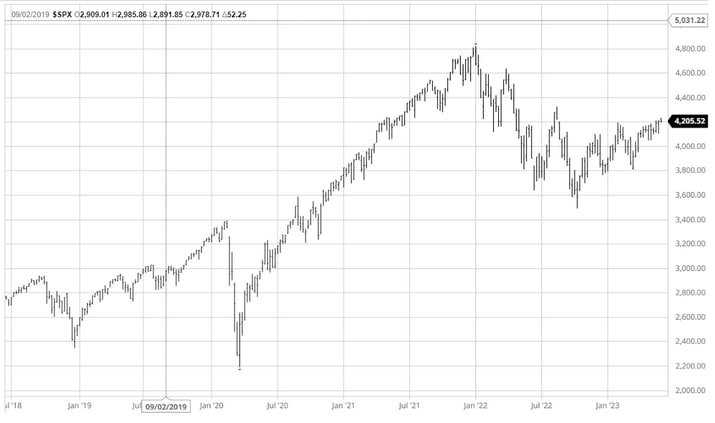
Performance of S&P 500 Index, 5 years weekly chart
The red line on the chart is the S&P 500, roughly flat since mid-February. Blue line is the well-known listed technology fund ARKK Innovation ETF. It holds a broad portfolio of what it considers to be innovative technology companies with particularly large long-term growth opportunities. ARKK is -1.8% in the same period. The green curve shows the NASDAQ 100, which rose somewhat in March, was flat in April, but has performed strongly in May. Finally, we have a black curve showing the SOXX index for semiconductor companies listed in the USA. It too was flat to slightly in the red until mid-May but has exploded higher in recent days and is at the time of writing up 15.6% since mid-February.
But just as the upswing in the market has been dominated by Tech, the upswing within the NASDAQ 100 has been surprisingly narrow, to the extent that it has become the "talk of the town" in the stock market. I asked AI-assisted Microsoft Bing to create a table of the stocks' weighted contribution to the NASDAQ-100's rise since February 13 (the time of publication of my previous article), and received this response:
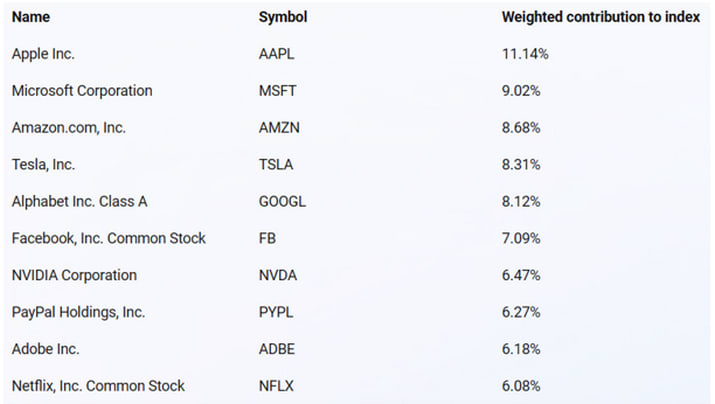
Overall, we see that close to 80% of the NASDAQ 100's rise was driven by these 10 stocks, and for many of them AI has been one of the most clearly identifiable factors behind the rise. Microsoft, through its stake in and close collaboration with Open AI, has a naturally strong position. Google is also considered to have great resources in the area, although the launch and rollout of their chat tool Bard has been somewhat hesitant so far. Tesla has several interesting initiatives in the field of AI, and it is this technology that enables their progression in self-driving cars. It is also the case that the large chat AI models depend on access to enormous data resources on the server and processor side. The former is positive for the leading cloud players Microsoft, Amazon, and Google. In processors, however, there is one company in particular that stands out, and deserves a separate section.
The giant Nvidia
In an article from last autumn, I described the landscape of players in microprocessors – the engine in tech. Among these, Nvidia stands out as the clear leader in graphics microchips, so-called GPUs. These are particularly applicable to processes that have to handle large amounts of data. Games, video editing and crypto mining are among the areas that have historically been the biggest users of such microchips. But also the AI topics machine learning, deep learning, and the large language models (ChatGPT) use such chips. NVDA is the leading supplier of GPUs followed by AMD and Intel.
Bing's AI was somewhat hesitant to provide an updated description of these players' market shares. Partly because of an incompletely updated data base, but also because it can be measured in several ways. Roughly speaking, however, it can be said that Intel is the leader in the PC market in terms of the number of GPUs delivered. However, Nvidia is clearly the largest in terms of turnover (price multiplied by number) and is considered to have more than 50% market share measured in this way.
The NVDA stock has been strong throughout the year, and there was therefore great excitement about the company's presentation of its 1Q results in the week behind us. The figures showed that the company is very profitable and has very robust finances. Total turnover was indeed 13% down from last year, and (non-GAAP) earnings per share was down 20%. Falls in these do not usually give grounds for a positive price reaction. But it was the composition of the figures, and especially the guidance going forward, that caused a stir. Microchips for data centers (including the aforementioned kind that power AIs) is Nvidia's biggest business, and it showed 14% growth year-over-year, and 18% growth from the previous quarter. Impressive.
However, it was the guiding forward that stole the show. Nvidia indicated an expected revenue of USD 11 billion in the current quarter. This was a whopping 52% higher than analysts' expectations of approx. 7.1 billion. The explanatory factor given by the company itself was increased demand for their data center products that could run AI services. The market was shocked, sending the stock up 24% the following day. An enormous increase in market value for an already large player, and this made NVDA the world's sixth largest company measured by market value. It was the jump in NVDA, as well as a sympathy rise for a number of other microprocessor manufacturers, that led to the sudden lift for the Philadelphia SOX Semiconductor index, and the associated move in the NASDAQ 100 as shown in the graph further up.
TANGMAN
The development in market value has also led to debate about the use of abbreviations for the largest and "hottest" shares. For a long time it was FAANG that was used (Facebook, Apple, Amazon, Netflix, and Google). With Facebook changing its name to Meta and the size of Tesla and now Nvidia having surpassed several of the others, a new acronym is being sought. Nothing has crystallized yet. I asked the Bing AI and it suggested this:
• TANGMAN: Tesla, Apple, Nvidia, Google, Microsoft, Amazon and Netflix. This acronym is similar to the word "tangman", which is an English slang word for a person who likes to party or have fun. It may reflect the entertaining and exciting nature of these companies' products and services.
A very good suggestion. Start using it.
Disclaimer: After more than 20 years in the brokerage industry I started my own business in 2021. I published the book "Paleo Trading: How to trade like a Hunter-Gatherer” and launched Paleo Capital that manages a hedge fund according to the principles described in the book. I emphasize that nothing written on this blog is to be regarded as personal advice or a concrete call to take positions. Everyone must be responsible for their own decisions and familiarize themselves with the products they use.
Risici
External author:
This information is in the sole responsibility of the guest author and does not necessarily represent the opinion of Bank Vontobel Europe AG or any other company of the Vontobel Group. The further development of the index or a company as well as its share price depends on a large number of company-, group- and sector-specific as well as economic factors. When forming his investment decision, each investor must take into account the risk of price losses. Please note that investing in these products will not generate ongoing income.
The products are not capital protected, in the worst case a total loss of the invested capital is possible. In the event of insolvency of the issuer and the guarantor, the investor bears the risk of a total loss of his investment. In any case, investors should note that past performance and / or analysts' opinions are no adequate indicator of future performance. The performance of the underlyings depends on a variety of economic, entrepreneurial and political factors that should be taken into account in the formation of a market expectation.
Disclaimer:
This information is neither an investment advice nor an investment or investment strategy recommendation, but advertisement. The complete information on the trading products (securities) mentioned herein, in particular the structure and risks associated with an investment, are described in the base prospectus, together with any supplements, as well as the final terms. The base prospectus and final terms constitute the solely binding sales documents for the securities and are available under the product links. It is recommended that potential investors read these documents before making any investment decision. The documents and the key information document are published on the website of the issuer, Vontobel Financial Products GmbH, Bockenheimer Landstrasse 24, 60323 Frankfurt am Main, Germany, on prospectus.vontobel.com and are available from the issuer free of charge. The approval of the prospectus should not be understood as an endorsement of the securities. The securities are products that are not simple and may be difficult to understand. This information includes or relates to figures of past performance. Past performance is not a reliable indicator of future performance.
© Bank Vontobel Europe AG and/or its affiliates. All rights reserved.