Bullish signs in the US but bears spotted in the Swedish forests


Despite a relatively high proportion of growth companies, the S&P500 has lagged behind the Nasdaq. There are technical signals that the S&P500 may be due for a rebound. The Swedish krona continues to weaken, favouring exporters such as Boliden, Ericsson and Volvo.
Case of the week: Summer rally or June jitters?
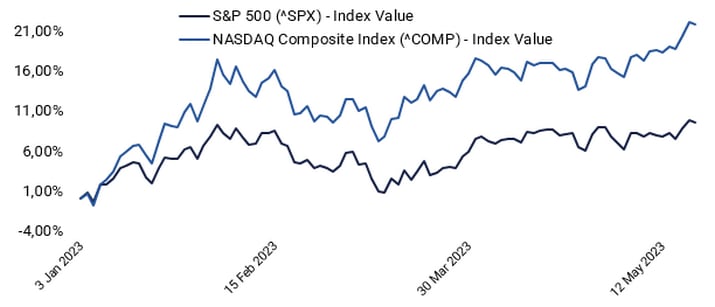
Despite generally positive equity markets, the S&P 500 has underperformed other large indices this year, such as major European stock markets and the Nasdaq. This is partly due to unfavourable exposure to US financials and Energy.
S&P500 v Nasdaq, YTD performance (%, USD)
Last week, there was a significant options expiration in the US. How the markets behave following expiration days could tell the market trend. Last week the S&P 500 possibly broke out of a neutral wedge pattern to the upside. If the move is confirmed this week, it could be a bullish signal. A short-term target is around 4,300, the top of a rising channel.
S&P500 price chart (in USD), one-year daily chart

Sell in May, the saying goes. As shown below, history indicates that going away already in May is often premature. Instead, the weakest period of stock market performance is August and September.
S&P500 monthly price change and positive percentage months (five-year average)

The US debt ceiling negotiations are a concern, with Secretary of Treasury Yellen saying early June represents a hard deadline to avoid defaulting on US debt. On the other hand, investors are becoming more confident that the Fed will pause the rate hike at the June meeting. This might cool off the recent rise in interest rates, which might otherwise spoil a stock market summer party.
S&P500 price chart (in USD), five-year weekly chart

Nasdaq 100 have broken up above resistance, and the next level on the upside is around 14,200-14,500. Adding to the bullish sentiment is MACD, which has broken the falling trend.
Nasdaq 100 (in USD), two-year daily chart

In the weekly chart below, one can see that a scary-looking doji appears. If this doji remains by Friday’s close, a bearish signal has been created.
Nasdaq 100 (in USD), weekly five-year chart

Bears spotted in the forests of Sweden
Trading in Sweden is less bullish than in the US.OMXS30 gapped up on Friday, the 19th of May, but the following trading is down. This increases the probability of the gap being closed, meaning that the index may return to levels around 2,250. But as long as this level can hold, the risk is on the upside.
OMXS30 (in SEK), one-year daily chart

OMXS30 (in SEK), weekly five-year chart

The German DAX approached the resistance but did not manage to break above. But the short-term trend is rising as long as MA20, currently at 15,939, can hold.
DAX (in EUR), one-year daily chart

DAX (in EUR), weekly five-year chart

SEK is losing ground
The SEK is losing ground against the euro as well as the USD. All else equal, that is positive news for Swedish exporting stocks, such as Boliden, Ericsson and Volvo. The chart below shows that the EUR/SEK is testing resistance. In case of a break to the upside, one must return to March of 2009 to find a place when the SEK was this weak against the euro.
EUR/SEK, one-year daily chart

The instruments below have the underlying SEK per 1 EUR.
EUR/SEK, weekly five-year chart

General market comments: The US debt ceiling continues to weigh on markets
US stock markets opened higher on Friday, 19 May, but turned lower during the evening as uncertainty over the debt ceiling increased. Powell signalled that rate hikes might be paused as the banking crisis leads to tighter credit conditions. The probability of a June rate hike fell from 40% to 25% in Friday's futures trading.
At the G7 meeting over the weekend, Mr Biden said that relations with China were expected to improve soon. This provided some support to the stock markets on Monday, 22nd May. Biden said that he was considering lifting sanctions on China's defence minister. Chinese authorities decided over the weekend to ban imports from US semiconductor company Micron saying its products posed a serious security threat.
Now that the Q1 reporting season is essentially over, the focus in equity markets will likely shift to macroeconomic statistics, whether central banks will continue to raise their policy rates and negotiations on the US debt ceiling. The latter is currently a significant drag on US equity markets, which, as usual, also affects most other equity markets worldwide.
Today, Wednesday, 24 May, the Fed’s latest meeting minutes will be published on 2-3 May. At this meeting, the Fed raised its key interest rate by 0.25% to 5-5.25%. At the same time, it removed the sentence that it expected further rate hikes.
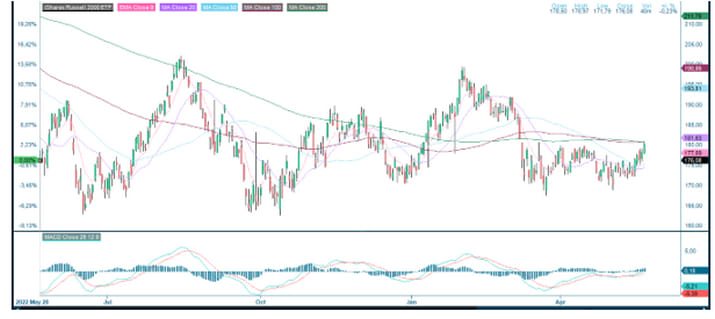
The Russell 2000 small caps index has underperformed the US equity market over the past few weeks, as shown in the following graph.
IShares Russell 2000 ETF (in USD), one-year daily chart
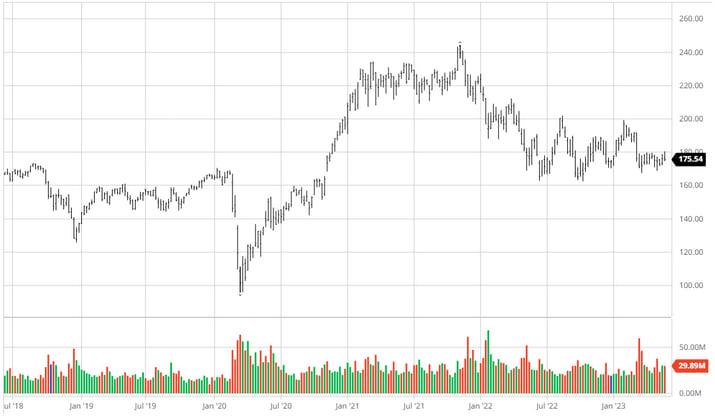
IShares Russell 2000 ETF (in USD), five-year weekly chart
On the contrary, the gold price has performed relatively strongly this year but has recently eased. Historically, gold has been seen as a hedge against inflation and financial instability.
Gold (USD per ounce), one-year daily chart

On Tuesday, 23rd May, the Purchasing Managers' Indices (PMIs) for France, Germany, the UK and the US were published. The previous trend of a more robust services PMI and a weaker manufacturing PMI in the Eurozone continues, as illustrated in the three-year graph below.
Eurozone Purchasing Managers' Index from January 2020 to May 2023

This week (22-26 May), 13 S&P500 companies are scheduled to report Q1 2023 results. Nvidia reports its Q1 2023 figures on Wednesday, 24th May, while Costco Wholesale and Medtronic report quarterly figures on Thursday, 25th May.
The average earnings per share surprise are 8.5%, and the median is 5.5% for the S&P500 companies reporting since 21 March. Share price movements following these quarterly reports have been small (0.0% on average and 0.1% on median).
The full name for abbreviations used in the previous text:
EMA 9: 9-day exponential moving average
Fibonacci: There are several Fibonacci lines used in technical analysis. Fibonacci numbers are a sequence of numbers in which each successive number is the sum of the two previous numbers.
MA20: 20-day moving average
MA50: 50-day moving average
MA100: 100-day moving average
MA200: 200-day moving average
MACD: Moving average convergence divergence
Risici
External author:
This information is in the sole responsibility of the guest author and does not necessarily represent the opinion of Bank Vontobel Europe AG or any other company of the Vontobel Group. The further development of the index or a company as well as its share price depends on a large number of company-, group- and sector-specific as well as economic factors. When forming his investment decision, each investor must take into account the risk of price losses. Please note that investing in these products will not generate ongoing income.
The products are not capital protected, in the worst case a total loss of the invested capital is possible. In the event of insolvency of the issuer and the guarantor, the investor bears the risk of a total loss of his investment. In any case, investors should note that past performance and / or analysts' opinions are no adequate indicator of future performance. The performance of the underlyings depends on a variety of economic, entrepreneurial and political factors that should be taken into account in the formation of a market expectation.
Disclaimer:
This information is neither an investment advice nor an investment or investment strategy recommendation, but advertisement. The complete information on the trading products (securities) mentioned herein, in particular the structure and risks associated with an investment, are described in the base prospectus, together with any supplements, as well as the final terms. The base prospectus and final terms constitute the solely binding sales documents for the securities and are available under the product links. It is recommended that potential investors read these documents before making any investment decision. The documents and the key information document are published on the website of the issuer, Vontobel Financial Products GmbH, Bockenheimer Landstrasse 24, 60323 Frankfurt am Main, Germany, on prospectus.vontobel.com and are available from the issuer free of charge. The approval of the prospectus should not be understood as an endorsement of the securities. The securities are products that are not simple and may be difficult to understand. This information includes or relates to figures of past performance. Past performance is not a reliable indicator of future performance.
© Bank Vontobel Europe AG and/or its affiliates. All rights reserved.