Looking at the NASDAQ 100


A rally in the last two trading days secured a positive April for the tech-heavy NASDAQ index. What is in store for May?
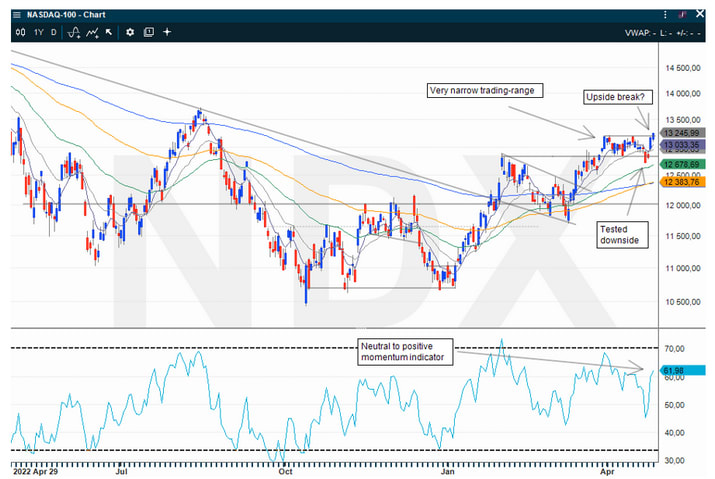
Throughout April, the technology-heavy US NASDAQ 100 index (NDX) moved sideways in a narrow band between approx. 12840 and 13180 points. Such a sideways movement is called a consolidation and can be seen as a state of balance between the supply (seller) and demand (buyer) side of the market. However, it is not often that you see such a long consolidation phase within a band with only a 2.65% distance between top and bottom for an index of shares which individually usually have larger daily fluctuations than this.
A widely used measure of daily average movements is the Average True Range, abbreviated ATR. The formula takes into account both the difference between the highest and lowest price throughout the day, as well as any jumps overnight in relation to yesterday's closing price. An average is then taken of this over e.g. 30 days, and you have a good measure of how big movements you can usually expect in a share or index. This size will naturally change over time, and throughout April we saw a drop in the ATR30 for the NASDAQ 100 from approx. 2.2% daily average movement down towards 1.8%. In comparison, the corresponding size for Norwegian OBX and Swedish OMXS30 is both about 1.4%.
As a sidenote, it can be mentioned that ATR is an interesting variable to use in intraday trading, as it gives a measure of what a "normal" price movement can be expected to be. This can help traders to not get a bad entry or exit of the stock. If a share looks strong but has already moved one ATR in relation to yesterday's opening and/or closing, it may be a bad risk/reward to buy it at this price and expect further upside. Likewise, there may be no point in selling a stock short for a possible intraday reversal before it has already moved an ATR. For those traders who use the Infront trading terminal, it is possible to retrieve values and signals for ATR in the stock tables. It is a model I developed together with my son, and which Infront incorporated into its system. I use it every day.
Back to the NASDAQ 100. The chart below shows that the narrow trading range throughout the month was first broken on the downside in the last week of the month, and then barely broken on the upside at the close on the last day of the month. Taken in isolation, this is bullish technical behavior that could indicate a further move upwards as we enter May. Last year's price peak from August of 13720 points out as a possible short-term price target, 3.6% above April's closing price.
Other considerations
Throughout April, the top and bottom levels of the narrow trading range were tested several times, and each time prices reversed back. Sometimes intraday, but often overnight. For traders, this is difficult market behavior, as there is low accuracy both in positioning for continuation of strength/weakness the next day, or betting on reversals. You also don't have to go back more than 2-3 days before it looked like the consolidation would break on the downside and not the upside. The earnings season continues in full force this week, and giants such as Apple might give input that will trigger a new direction. But in isolation, April ended with a buy signal.
In the fundamentals too, one can perhaps find some support for an optimistic view. Interest rates have risen a lot, but there is a well-founded consensus view that we are nearing the end of rate increases. Likewise, weak quarterly numbers and guidance from the companies in the reporting season have been feared, while what has come so far has been mixed and at least not uniformly bad. As the companies finish reporting, many will also restart their share buybacks, which in isolation is a positive driver for prices.
At the same time, it is not difficult to find a negative angle. It is a fact that interest rates are high, and the effects of this are slowly but surely eating into the companies' and investors' calculations. Those who look at seasonal fluctuations point out, with some support in the statistics, that May and June tend to be among the weaker months of the year, and the reason why the phrase "sell in May and stay away" has stuck in the minds of many investors.
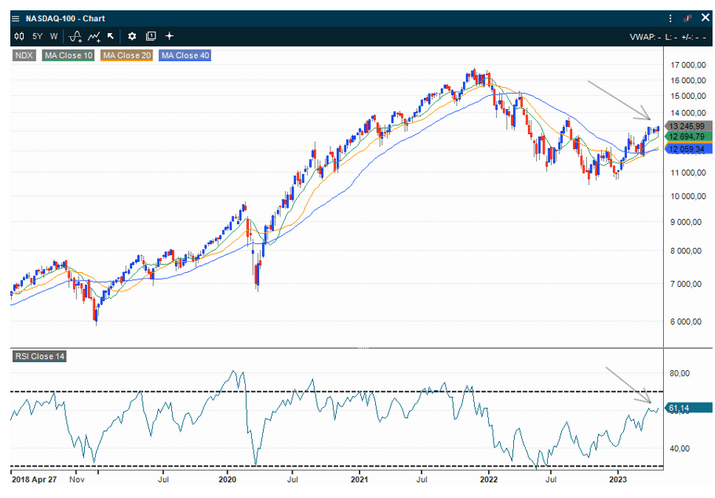
For a trader, it is important to follow which topics other players in the market are concerned with and assess whether the technical behavior paints a picture that supports this. At the same time, it is important not to overthink, and get too hung up on guesses about what you think "should" happen. Price trends are in force and show the direction until it changes. A look at the NASDAQ in a longer perspective with weekly candlesticks for the past 5 years gives a pretty clear picture at the end of April: The chart is bullish.
Disclaimer: After more than 20 years in the brokerage industry I started my own business in 2021. I published the book "Paleo Trading: How to trade like a Hunter-Gatherer” and launched Paleo Capital that manages a hedge fund according to the principles described in the book. I emphasize that nothing written on this blog is to be regarded as personal advice or a concrete call to take positions. Everyone must be responsible for their own decisions and familiarize themselves with the products they use.
Risici
External author:
This information is in the sole responsibility of the guest author and does not necessarily represent the opinion of Bank Vontobel Europe AG or any other company of the Vontobel Group. The further development of the index or a company as well as its share price depends on a large number of company-, group- and sector-specific as well as economic factors. When forming his investment decision, each investor must take into account the risk of price losses. Please note that investing in these products will not generate ongoing income.
The products are not capital protected, in the worst case a total loss of the invested capital is possible. In the event of insolvency of the issuer and the guarantor, the investor bears the risk of a total loss of his investment. In any case, investors should note that past performance and / or analysts' opinions are no adequate indicator of future performance. The performance of the underlyings depends on a variety of economic, entrepreneurial and political factors that should be taken into account in the formation of a market expectation.
Disclaimer:
This information is neither an investment advice nor an investment or investment strategy recommendation, but advertisement. The complete information on the trading products (securities) mentioned herein, in particular the structure and risks associated with an investment, are described in the base prospectus, together with any supplements, as well as the final terms. The base prospectus and final terms constitute the solely binding sales documents for the securities and are available under the product links. It is recommended that potential investors read these documents before making any investment decision. The documents and the key information document are published on the website of the issuer, Vontobel Financial Products GmbH, Bockenheimer Landstrasse 24, 60323 Frankfurt am Main, Germany, on prospectus.vontobel.com and are available from the issuer free of charge. The approval of the prospectus should not be understood as an endorsement of the securities. The securities are products that are not simple and may be difficult to understand. This information includes or relates to figures of past performance. Past performance is not a reliable indicator of future performance.
© Bank Vontobel Europe AG and/or its affiliates. All rights reserved.