Strong macro and quarterly results


Following relatively solid macroeconomic data, we have seen an upward trend in US interest rates. At the same time, Q1 2023 interim reports are coming in strong, most evidently from the US. This week we look at the palladium price, which could benefit from a rebound in the Chinese economy. However, its link to Russia makes developments uncertain.
Rise in short-term interest rates dampens US equity markets
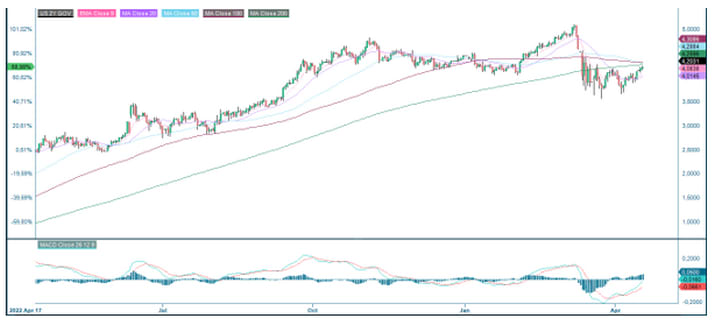
US stock markets fell by 0.2-0.4% on Friday, 14 April, as concerns about rising interest rates once again took over. The Nasdaq, the most interest rate-sensitive US stock index, fell more than the Dow Jones and the S&P 500. The two-year US government bond rose by 15 basis points on Friday, 14 April, to 4.08%. Slightly stronger-than-expected US retail sales in March primarily drove the rise in interest rates. For last week, however, the rise in the 2-year US Treasury yields was limited to 5 basis points, from 4.03% to 4.08%.
Stronger-than-expected US economic data contributed to a further rise in interest rates on Monday, 17th April. The NAHB- housing market index and Empire Manufacturing in the US surprised on the upside. The ten-year US Treasury yield rose nine basis points to 3.59%, and the two-year US Treasury yield had a similar movement, currently trading at 4.15%. After the data, the USD strengthened, but the gains pared back overnight on Tuesday 18th.
US 2-year Treasury Yield (%l) in a daily one-year chart
Strong Q1 2023 from three large US banks
For Q1 2023 (with around 30 companies reporting as of Friday, 14 April), 90% of S&P 500 companies have reported a positive EPS (earnings per share) surprise, while 63% have reported a positive revenue surprise.
The three large banks (Citigroup, JP Morgan and Wells Fargo) that reported on Friday 14th, April, all beat the market's earnings estimates. JP Morgan beat the market's consensus EPS estimate by 20%, while Citigroup and Wells Fargo beat 12% and 7%, respectively. US bank stocks rose 3.5% on Friday after three robust US bank reports, including a better-than-expected report from Blackrock.
The estimated earnings decline for the S&P 500 in Q1 2023 is now -6.5%. A 7.8% increase in the price of the S&P500 Index through 14 April 2023 has pushed the P/E ratio to 18.3x, below the 5-year average of 18.5x but above the 10-year average of 17.3x.
The trend is still upward for most major stock indices, as shown in the chart below. European equity markets have slightly outperformed US equity markets, although the differences are relatively small.
Intensive Quarterly Reporting Week
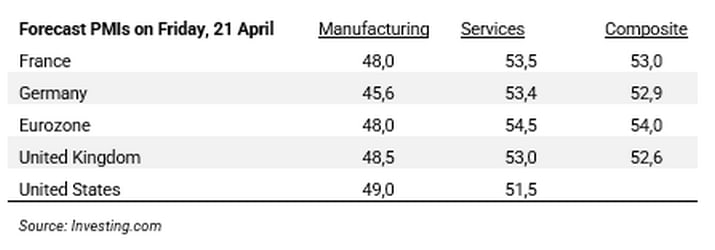
On Friday, 21 April, preliminary Purchasin Managers' Indices (PMI)s will be released to show where the economy is heading. In recent surveys, the manufacturing sector has deteriorated. In contrast, the situation in the service sector has improved in recent months.
This week, 60 S&P 500 companies will report their Q1 2023 results. US companies reporting include Morgan Stanley and Tesla on Wednesday, 19 April, AT&T, American Express and Philip Morris on Thursday, 20 April and Procter & Gamble on Friday, 21 April.
The reporting season may give energy to the stock indices
The quarterly reporting season will likely stay in focus, especially for the remainder of this week, as the macro agenda is limited. Netflix released its quarterly report after closing, and today after closing, Tesla will release its interim report. It won’t be much of a surprise if reports keep beating expectations. What’s essential in the short term is guidance from management.
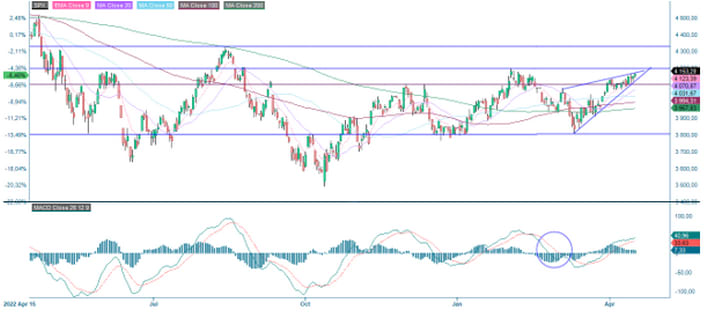
So far this week, S&P 500 is trading up with a solid start to the reporting season. The chart below shows that S&P 500 is approaching 4,200 as the first resistance level. That is followed by 4,330. However, there is a little warning signal in the shape of a rising wedge. These tend to break off on the downside. In such a scenario, the formation indicates a drop to MA200, currently at 3,958.
S&P 500 (in USD), one-year daily chart
S&P 500 (in USD), weekly five-year chart

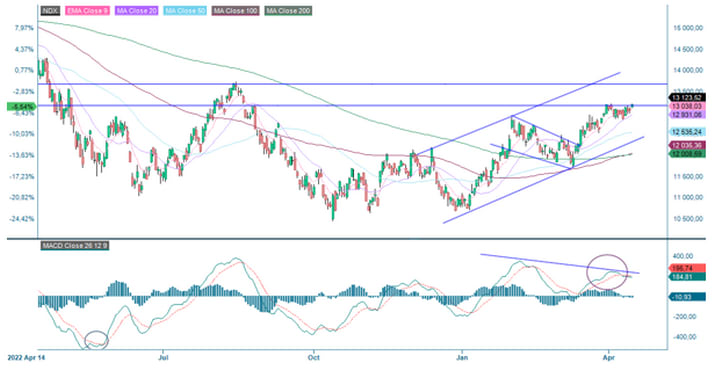
Nasdaq is currently trading close to resistance. In case of a break, the next resistance level is close to 13,685. If the market turns south, the floor of the rising trend channel could serve as a magnet and support.
Nasdaq 100 (in USD), one-year daily chart
Nasdaq 100 (in USD), weekly five-year chart

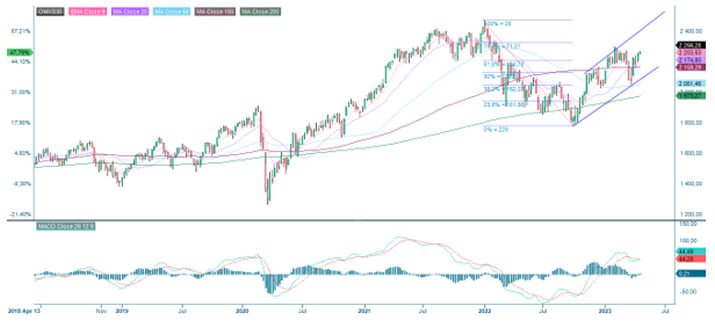
The quarterly reporting season is also in focus in Europe. Ericsson reported profits above expectations but is guiding for an uncertain future. Despite the drop in the Ericsson share, OMXS30 managed to close just on the positive side. With good reports (and guidance), OMXS30 may be able to test the local high from February at around 2,295.
OMXS30 (in SEK), one-year daily chart

OMXS30 (in SEK), weekly five-year chart
The German DAX closed yesterday at a year high. Interestingly, the falling trend in MACD has been broken.
DAX (in EUR), one-year daily chart

We’ll have to look at the weekly chart to find the next level of resistance. As shown, the 16,000 level is relatively close.
DAX (in EUR), weekly five-year chart

Rally in Bitcoin. Does the crypto have more to give?
Year-to-date, bitcoin has outperformed equities. It is trading above its moving averages, but momentum seems to be fading. MACD illustrates that. There may be an opportunity to buy into the dips. Are levels around 28,500 interesting levels to enter a long trade with a TP just above 35,000?
Bitcoin, two-year daily chart

Bitcoin, weekly five-year chart

Case of the week: Palladium might sail on positive China figures
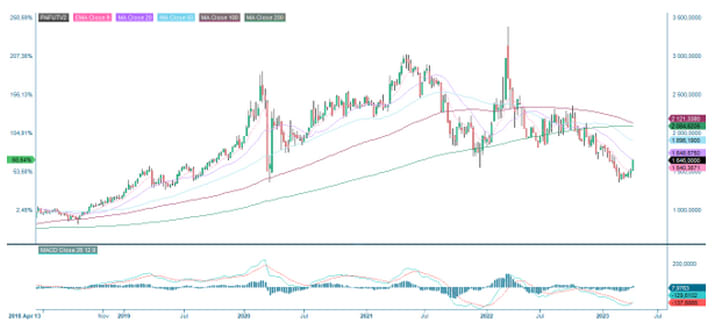
Before the Covid19 outbreak and the invasion of Ukraine by Russia, the price of palladium had risen to its all-time high in February 2020, reaching a peak of $2,677 per ounce, marking a fourfold increase from its 2016 levels. Since its ATH in early 2022, the price movement of palladium has been nothing short of a rollercoaster ride, with the supply uncertainties surrounding Russia (the world’s largest Palladium exporter) and concerns for a global recession having driven demand expectations down.
The growing demand for the soft silver-white metal is primarily due to the global efforts to shift towards replacing fossil fuel-powered vehicles. Palladium is, to a large extent, used in producing catalytic converters for petrol cars, amongst other usage areas. Leading up to the Covid19-outbreak, the Chinese automotive market has been a vital demand driver for the metal. Since the country’s economic activity halted, the palladium price has taken a significant hit.
However, as Palladium price levels have continued to be suppressed and now trade at $1 634 per ounce, below its 2019 levels, China's economy seems to be recovering. For the first quarter of 2023, China recorded a higher-than-anticipated growth rate of 4.5%, surpassing the predicted rate of 4.0%. In quarterly terms, the growth rate increased from the upwardly revised 0.6% in the previous period to 2.2%.

What speaks for Palladium?
· A faster recovery of the Chinese economy than expected.
What speaks against Palladium?
· Since Russia invaded Ukraine, automakers have been trying to reduce their dependence on palladium and shifting towards platinum. Concerns over the supply of palladium from Russia drive this move.
Palladium, one-year daily price chart (USD per ounce)

Palladium, five-year weekly price chart (USD per ounce)
The full name for abbreviations used in the previous text:
EMA 9: 9-day exponential moving average
Fibonacci: There are several Fibonacci lines used in technical analysis. Fibonacci numbers are a sequence of numbers in which each successive number is the sum of the two previous numbers.
MA20: 20-day moving average
MA50: 50-day moving average
MA100: 100-day moving average
MA200: 200-day moving average
MACD: Moving average convergence divergence
Risici
External author:
This information is in the sole responsibility of the guest author and does not necessarily represent the opinion of Bank Vontobel Europe AG or any other company of the Vontobel Group. The further development of the index or a company as well as its share price depends on a large number of company-, group- and sector-specific as well as economic factors. When forming his investment decision, each investor must take into account the risk of price losses. Please note that investing in these products will not generate ongoing income.
The products are not capital protected, in the worst case a total loss of the invested capital is possible. In the event of insolvency of the issuer and the guarantor, the investor bears the risk of a total loss of his investment. In any case, investors should note that past performance and / or analysts' opinions are no adequate indicator of future performance. The performance of the underlyings depends on a variety of economic, entrepreneurial and political factors that should be taken into account in the formation of a market expectation.
Disclaimer:
This information is neither an investment advice nor an investment or investment strategy recommendation, but advertisement. The complete information on the trading products (securities) mentioned herein, in particular the structure and risks associated with an investment, are described in the base prospectus, together with any supplements, as well as the final terms. The base prospectus and final terms constitute the solely binding sales documents for the securities and are available under the product links. It is recommended that potential investors read these documents before making any investment decision. The documents and the key information document are published on the website of the issuer, Vontobel Financial Products GmbH, Bockenheimer Landstrasse 24, 60323 Frankfurt am Main, Germany, on prospectus.vontobel.com and are available from the issuer free of charge. The approval of the prospectus should not be understood as an endorsement of the securities. The securities are products that are not simple and may be difficult to understand. This information includes or relates to figures of past performance. Past performance is not a reliable indicator of future performance.
© Bank Vontobel Europe AG and/or its affiliates. All rights reserved.