A focus on Gas

Natural Gas is one of the worlds most traded commodities
2022 was a year in which the gas price received a lot of attention both in the news and among investors. The outbreak of the war in Ukraine marked the annual peak for European gas prices at the beginning of March, but this level was also tested in September in connection with the explosions of the Nord Stream gas pipelines in the Baltic Sea. Such extremes in prices often occur when an unexpected event creates great uncertainty about the future balance between supply and demand in a market, but it can also come as the culmination of a trend that has already been in play for a while. For the gas price in 2022, it can undoubtedly be said that both factors were present. The two specific events marked news-driven peaks in price. But European gas prices had trended upwards since the Covid-bottom in the summer of 2020. We see much of the same picture in US natural gas. Because of increased gas trade between the continents, it is now greater connection between US and European gas prices than it used to be.
Natural gas is the second most important energy commodity after oil, and both are at the top of the list of the world's most traded commodities. However, there are some obvious differences between the two. Oil is relatively easy to transport. It can be consumed directly through combustion to obtain energy but is to a greater extent refined for a number of purposes. Asphalt, petrol, diesel, jet fuel and plastic are among the products made from crude oil.
Gas also has many areas of application. As an example, we can use figures from the American energy agency EIA for the distribution of American natural gas in 2021. 37% went to electricity production, 33% to industry, 15% to households, 11% to various commercial purposes and 4% to transport. Altogether, according to the EIA, the US used 30.66 Tcf (trillion cubic feet) of natural gas in 2021, corresponding to 31.7 quadrillion of the European unit of measurement BTU. Natural gas accounted for 32% of the US's total energy production.
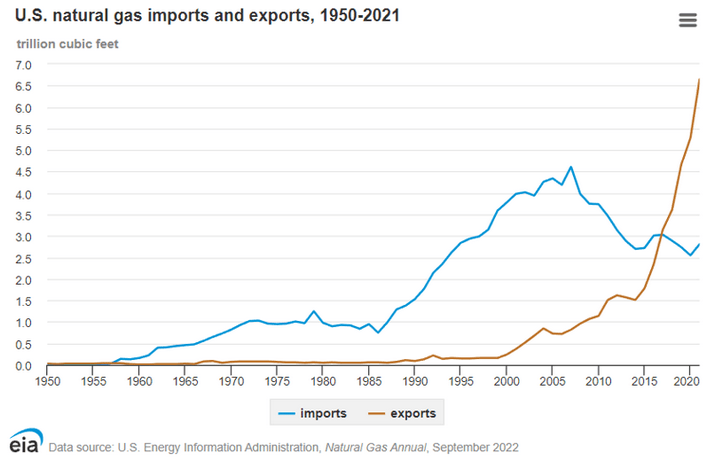
The US both imports and exports natural gas. Most imports come from Canada via pipelines. The volume reached a peak of 4.6 Tcf in 2007, and by 2021 had fallen back to approximately 2.81 Tcf. At the same time, exports have really picked up speed from very low levels prior to 1999. In 2017, exports surpassed imports around approx. 3 Tcf, and in 2021 the US exported 6.61 Tcf. Incidentally, this is a fun piece of industrial history. After the turn of the millennium, it was thought that the USA would lack natural gas and the construction of terminals for importing gas by sea from producers elsewhere in the world was started. By the time the terminals were finished, the US had a surplus of gas as a result of the revolution in shale oil. These oil fields also produce a lot of gas, and the planned import terminals are now largely used for export. The US is actually the world's largest exporter of liquefied natural gas (LNG). Several Norwegian companies are active in this market, with shares traded on the Oslo Stock Exchange.
The Henry Hub reference price
Those who trade oil are used to there being a reference price for North Sea oil (Brent) and another for American oil WTI. This is also the case for natural gas. A gas future is traded in the Netherlands, and another in the UK for the European market. The reference price in the USA is the so-called Henry Hub Natural Gas Price, named after a distribution center in the pipeline network in Louisiana. The futures contracts for Henry Hub Natural Gas are traded on the New York Mercantile Exchange (NYMEX) in the same way as the futures for oil. In Vontobel's product range, you will find a number of trading products with Henry Hub as the underlying, which make it possible to take positions both ways on the price of gas.
Gas prices have been falling heavily for the last month
Henry Hub Natural Gas reached its preliminary price peak of $10.028 this summer. After that, the trend has largely been downward, and the pace of the trend has increased significantly the last few weeks. From the previous local peak around USD 7 on December 13, Henry Hub gas reached a preliminary intraday low of USD 3.384 on January 13.
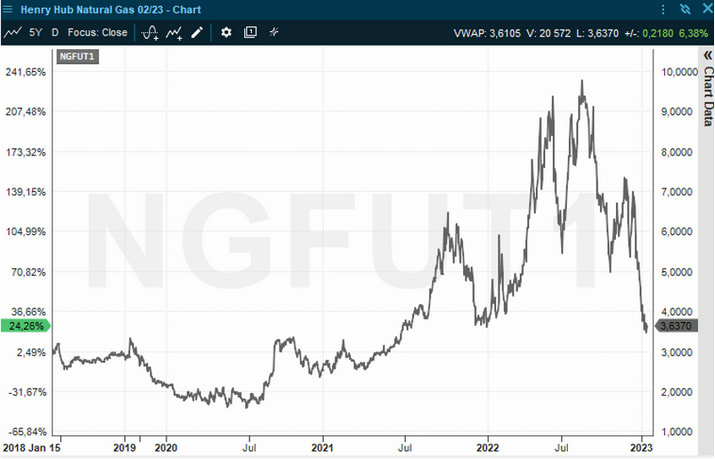
The price drop is so large and the decline so continuous that it paints a startling technical picture that is getting attention from many traders. Why this sudden price drop? The reasons are, as usual, complex. Increasing production, a milder winter than expected in both Europe and the USA as well as long-term Covid shutdowns in China are among the factors most often mentioned. The drop in gas prices has also led to downward adjustments of estimates and price targets for Norwegian oil and gas producers such as Equinor and Vår Energi.
Sophisticated traders are increasingly turning their eyes to trading the gas price, in the same way that many do in oil. Large price fluctuations in liquid commodities are always interesting, and as mentioned, Vontobel offers a number of products that can provide exposure to both up and down movements. However, as always, you must familiarize yourself with what you are trading, and have control over risk-taking. Most people are aware that the price of oil fluctuates significantly from day to day, but the price fluctuations in the gas market are often much greater. This makes the effect of hitting the price fluctuations great, but also the risk. Trade carefully.
Disclaimer: After many years in the brokerage industry I started my own business in 2021. I published the book "Paleo Trading: How to trade like a Hunter-Gatherer” and launched Paleo Capital that manages a hedge fund according to the principles described in the book. I emphasize that nothing written on this blog is to be regarded as personal advice or a concrete call to take positions. Everyone must be responsible for their own decisions and familiarize themselves with the products they use.
Risici
External author:
This information is in the sole responsibility of the guest author and does not necessarily represent the opinion of Bank Vontobel Europe AG or any other company of the Vontobel Group. The further development of the index or a company as well as its share price depends on a large number of company-, group- and sector-specific as well as economic factors. When forming his investment decision, each investor must take into account the risk of price losses. Please note that investing in these products will not generate ongoing income.
The products are not capital protected, in the worst case a total loss of the invested capital is possible. In the event of insolvency of the issuer and the guarantor, the investor bears the risk of a total loss of his investment. In any case, investors should note that past performance and / or analysts' opinions are no adequate indicator of future performance. The performance of the underlyings depends on a variety of economic, entrepreneurial and political factors that should be taken into account in the formation of a market expectation.
Disclaimer:
This information is neither an investment advice nor an investment or investment strategy recommendation, but advertisement. The complete information on the trading products (securities) mentioned herein, in particular the structure and risks associated with an investment, are described in the base prospectus, together with any supplements, as well as the final terms. The base prospectus and final terms constitute the solely binding sales documents for the securities and are available under the product links. It is recommended that potential investors read these documents before making any investment decision. The documents and the key information document are published on the website of the issuer, Vontobel Financial Products GmbH, Bockenheimer Landstrasse 24, 60323 Frankfurt am Main, Germany, on prospectus.vontobel.com and are available from the issuer free of charge. The approval of the prospectus should not be understood as an endorsement of the securities. The securities are products that are not simple and may be difficult to understand. This information includes or relates to figures of past performance. Past performance is not a reliable indicator of future performance.
© Bank Vontobel Europe AG and/or its affiliates. All rights reserved.