Yet another dead cat bounce?


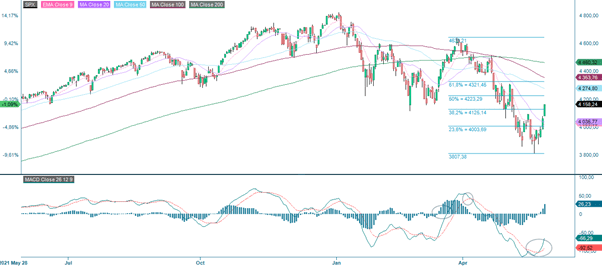
The Fed minutes released on Thursday, 25 May, initiated a strong rebound on the US stock exchanges. The market interpreted the minutes as if the central bank’s stiff stance on rate hikes had softened, meaning that rate hikes could be paused during the second half of the current year if needed. Last week, the S&P 500 closed up by 6.6 per cent.
The Fed minutes released on Thursday, 25 May, initiated a strong rebound on the US stock exchanges. The market interpreted the minutes as if the central bank’s stiff stance on rate hikes had softened, meaning that rate hikes could be paused during the second half of the current year if needed. Last week, the S&P 500 closed up by 6.6 per cent.

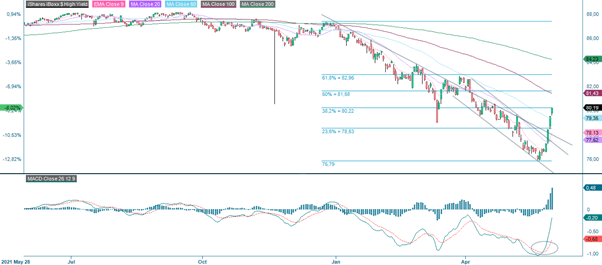
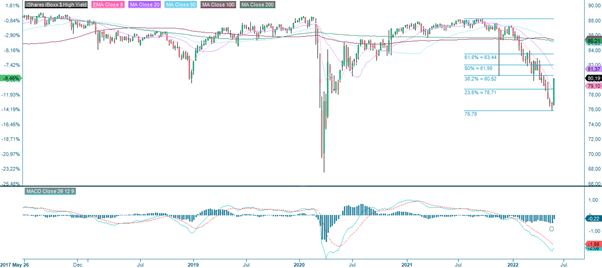
A good measurement of investors risk appetite is HYG, an ETF for junk bonds. HYG is quite far out on the risk scale in the bond-sphere and can be viewed as an indicator of risk. HYG was leading the rally in the US, which is a good sign. A break above Fib 50 and falling MA100 would imply that the rebound on the stock exchange is not another “dead cat bounce”.
However, the 10-year yield has not broken down through the support level of around 2.75 per cent, which is somewhat discomforting. If the 10-year yield does not break below the support, the chances of last week’s rally being a “dead cat bounce” still linger.

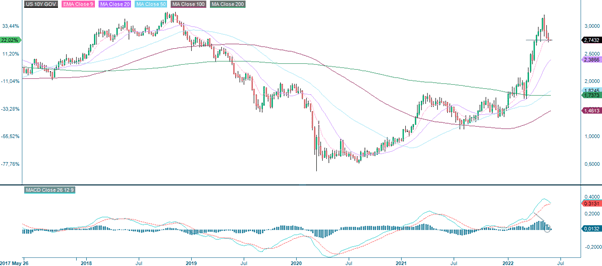
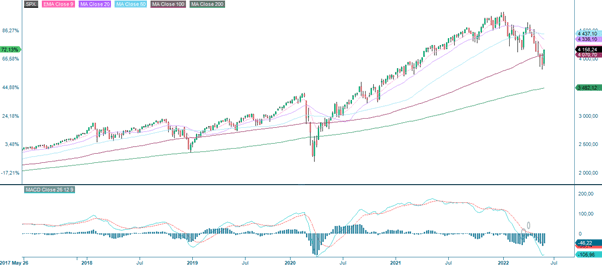
Due to memorial day, the US markets were closed yesterday, Monday, 30 May. However, today, Tuesday 31 May, markets are open for trading as usual. Is there enough energy left for the index to test Fib 50 around 4 245? The chances would most definitely improve if the US 10 year yield broke on the downside.
The full name for abbreviations used in the previous text:
EMA 9: 9-day exponential moving average
Fibonacci: There are several Fibonacci lines used in technical analysis. Fibonacci numbers are a sequence of numbers in which each successive number is the sum of the two previous numbers.
MA20: 20-day moving average
MA50: 50-day moving average
MA100: 100-day moving average
MA200: 200-day moving average
MACD: Moving average convergence divergence