A short- or long-term bounce in US equities?


Natural gas has outperformed crude oil throughout 2024. Since mid-March 2025, we have seen a slight pullback in the price of natural gas. Looking ahead to the rest of 2025, we see more bullish than bearish pressure on natural gas prices. However, the Republic of Congo is expected to double its production by 2027, which will obviously dampen the natural gas price curve in the long term. When it comes to technical analysis, the new question this week is the rebound in the S&P500 and Nasdaq and whether or not it will be permanent.
Case of the week: Natural gas, blowing in the right direction
Natural gas has been a solid performer throughout 2024, especially when compared to other energy sector commodities such as crude oil and Brent. Since the start of 2025, the outperformance has continued, with natural gas significantly outperforming both peers and previous May contracts. However, since peaking in mid-March, prices have begun to retreat.
Natural Gas compared to different oils (Indexed in USD at 2024-01-02)
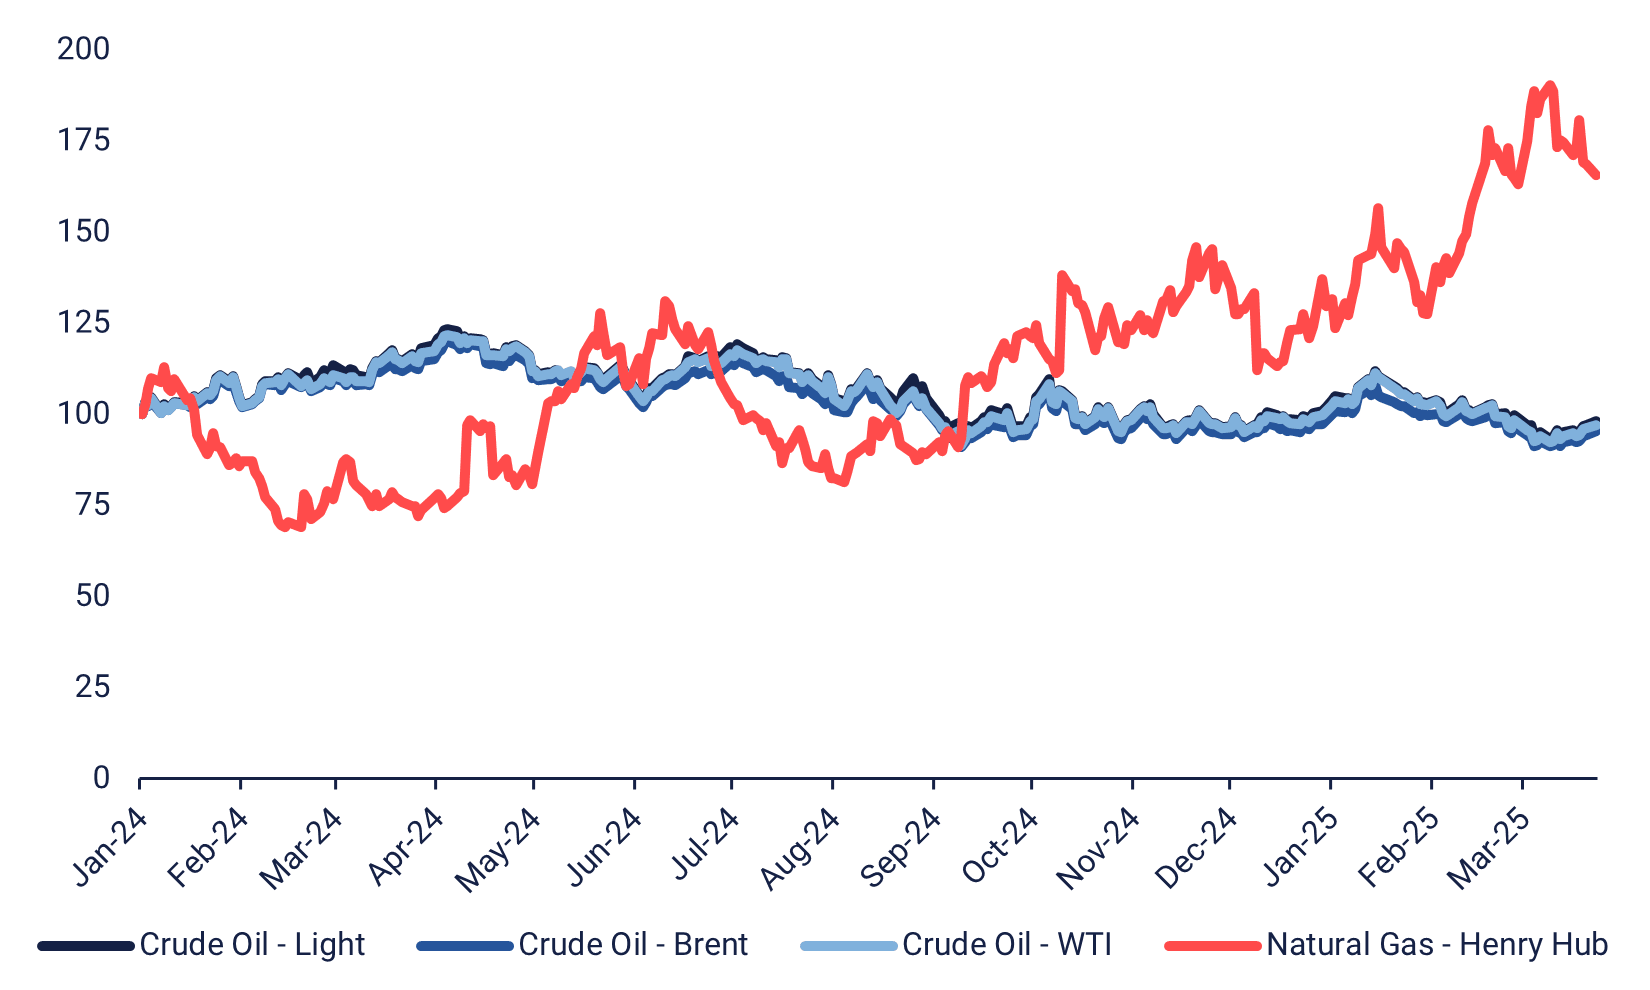
Natural gas is highly dependent on current weather and temperature expectations, and at this point of time, the outlook for spring is warmer than previously expected. This reduces the need for heating with natural gas, which in turn leads to lower expected prices. This has countered earlier bullish pressure from BloombergNEF, which forecast that US gas storage would be 10% below the five-year average during the summer. In addition,in the EU, regulators have relaxed the requirement for gas storage to be filled in 2025. This was done to counter the risk of price spikes, as natural gas has been notoriously volatile in previous winters, especially in 2022. However, prices have since become more moderate, with price movements closer to their seasonal averages.
Natural gas seasonal pattern (USD) 2010-2025 YTD

Europe is still largely dependent on Russian natural gas exports, but more production is planned in other geographical areas. For example, production in the Republic of Congo is expected to double by 2027. The increase in production will be driven by China's Wing Wah's Banga Kayo and Italy's Eni. The former is targeting a cumulative production estimated at nearly 30 billion cubic meters of gas over a 25-year period, while the latter's project aims to produce 2.4 million tons in 2025, rising to 4.5 billion cubic meters per year by 2026. The increase in production, although more likely to be felt in the coming years than in 2025, should help to keep a lid on prices through competition. In the short term, however, supply pressures outweigh potential increases. U.S. tariffs on products from other countries, such as Venezuelan oil, could lead to short-term price spikes. In addition, while Australia currently exports most of the LNG (Liqeufied Natural Gas) it produces, there are growing calls for more to be kept at home rather than exported. Peace talks between Russia and Ukraine could cause a dip in the coming weeks, but looking out to the rest of 2025, there seems to be more bullish pressure than bearish.
Natural Gas May ‘25 (USD), one-year daily chart

Natural Gas May ‘25 (USD), five year weekly chart

Macro comments
The weaker economic outlook for the US is now starting to show up in the form of lowered earnings estimates for S&P500 companies, as shown in the chart below. However, Wall Street analysts are still forecasting good earnings growth for the S&P500 companies in 2025.
S&P500 earnings growth expectations lowered since 3 January 2025

On Wednesday, March 26th, we start with the British CPI (Consumer Price Index) and PPI (Producer Price Index) for February. This will be followed by Sweden's NIER (National Insitiute of Economic Research), which will release its economic barometer for March and an economic forecast. We also get Spain's Q4 GDP (Gross Domestic Product). The U.S. will contribute with durable goods orders for February as well as oil inventories (Department of Energy), a weekly statistic.
On Thursday, March 27, H&M will release its Q1 2024/2025 results (December 1, 2024 to February 28, 2025). The macroeconomic agenda starts with Chinese industrial profits for February. This is followed by Swedish household credit for February and an interest rate announcement from Norges Bank. From the U.S., we get Q4 GDP, February wholesale inventories, February jobless claims, February pending home sales and the March Kansas City Fed index.
On Friday, March 28th, the Bank of Japan will release the summary of its March 19th meeting. In Europe, we'll see UK Retail Sales for February and Q4 GDP. This is followed by the German Gesellschaft für Konsumforschung (GfK) consumer confidence for April. Then we get CPI from France and Spain and unemployment from Germany, all for March. The Eurozone's economic barometer for March will conclude the European news session. Then we move on to Canada's GDP for February, and from the U.S., personal consumption and inflation (PCE) for February and the Michigan index for March.
Is the U.S. bounce a dead cat bounce or for real?
The S&P 500 has bounced sharply from support and is currently testing its 200-day moving average (MA200). Notably, the MACD has given a preliminary buy signal. A break above the MA200 and the 5,840 level may follow.
Assuming this bounce is real and not a dead-cat bounce, i.e. the index successfully recovers the MA200 and 5,840, investors can feel more confident about the continuation of the long-term uptrend.
S&P 500 (in USD), one-year daily chart

S&P 500 (in USD), weekly five-year chart

The Nasdaq 100 has also bounced convincingly from support at the 19,000 level and is currently testing its 200-day moving average (MA200). The MACD has given a preliminary buy signal. A break above the MA200 and the 20,300 level could be next, followed by a potential move towards 20,940.
Nasdaq 100 (in USD), one-year daily chart

Nasdaq 100 (in USD), weekly five-year chart

In Sweden, the OMXS30 has underperformed despite the improved sentiment in the United States. As shown in the chart below, the index is approaching the MA100, currently at 2,607, which serves as the first level of support. Note that the MACD has generated a sell signal. If the selling pressure continues and the OMXS30 makes a decisive break below the 200-day moving average (MA200), currently at 2,548, the index could be exposed to further downside towards the 2,540 and 2,500 support levels.
OMXS30 (in SEK), one-year daily chart

OMXS30 (in SEK), weekly five-year chart

The German DAX is showing resilience. However, the price action has flattened out into a sideways consolidation forming a potential rectangle pattern just below the all-time high of 23,034. This may indicate market indecision or a pause before a potential breakout or pullback. Support appears at 22,212 while resistance is clearly marked at 23,034. A break above resistance could trigger further bullish momentum, while a break below 22,212 could lead to a deeper correction.
DAX (in EUR), one-year daily chart

DAX (in EUR), weekly five-year chart

The full name for abbreviations used in the previous text:
EMA 9: 9-day exponential moving average
Fibonacci: There are several Fibonacci lines used in technical analysis. Fibonacci numbers are a sequence in which each successive number is the sum of the two previous numbers.
MA20: 20-day moving average
MA50: 50-day moving average
MA100: 100-day moving average
MA200: 200-day moving average
MACD: Moving average convergence divergence
Risks
Credit risk of the issuer:
Investors in the products are exposed to the risk that the Issuer or the Guarantor may not be able to meet its obligations under the products. A total loss of the invested capital is possible. The products are not subject to any deposit protection.
Currency risk:
If the product currency differs from the currency of the underlying asset, the value of a product will also depend on the exchange rate between the respective currencies. As a result, the value of a product can fluctuate significantly.
External author:
This information is in the sole responsibility of the guest author and does not necessarily represent the opinion of Bank Vontobel Europe AG or any other company of the Vontobel Group. This information is sponsored by Bank Vontobel Europe AG, which may be a counterparty to transactions involving the financial instruments discussed in this information. The further development of the index or a company as well as its share price depends on a large number of company-, group- and sector-specific as well as economic factors. When forming his investment decision, each investor must take into account the risk of price losses. Please note that investing in these products will not generate ongoing income.
The products are not capital protected, in the worst case a total loss of the invested capital is possible. In the event of insolvency of the issuer and the guarantor, the investor bears the risk of a total loss of his investment. In any case, investors should note that past performance and / or analysts' opinions are no adequate indicator of future performance. The performance of the underlyings depends on a variety of economic, entrepreneurial and political factors that should be taken into account in the formation of a market expectation.
Market risk:
The value of the products can fall significantly below the purchase price due to changes in market factors, especially if the value of the underlying asset falls. The products are not capital-protected
Product costs:
Product and possible financing costs reduce the value of the products.
Risk with leverage products:
Due to the leverage effect, there is an increased risk of loss (risk of total loss) with leverage products, e.g. Bull & Bear Certificates, Warrants and Mini Futures.