Could the Q3 reporting season add energy to the stock market?


This week's case is about silver, which has had several drivers, one of which has been the correlation with a strong gold price on the back of a weaker US dollar (USD). But demand for silver is also being driven by the greentech industry. At the end of last week, silver prices rose to a new high for the year. If the breakout in the silver price is confirmed, this could lead to increased interest in the white metal and give the price a further boost. US equity indices are consolidating, awaiting a potential trigger such as Tesla's interim results.
Case of the week: Silver’s time to shine?
Precious metals have been much favoured by investors this year. Gold has received most of the attention, but has actually been outperformed by silver, which has risen by over 30%.
One of the drivers of this year's rally is likely to be the close correlation with gold. Gold has seen increased interest from central banks, partly for policy reasons to diversify away from USD assets. The gold price has also been supported by flows from investor groups such as family offices, possibly due to concerns about the ballooning US government debt. Lower yields, as central banks have embarked on a cycle of monetary easing, have also increased gold's relative attractiveness. All in all, the silver price tends to follow gold, but with greater volatility.
Silver Spot Price (USD/oz) vs Gold Price (USD/oz), five-year daily chart
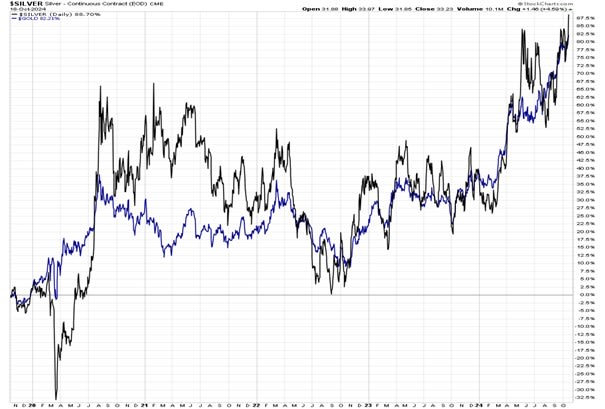
Silver will likely not achieve the same status as gold in the eyes of central banks. However, demand from greentech industries is a significant driver, and photovoltaics. For example the production of solar energy represent some 20 percent of demand, according to the Silver Institute. At the same time, mine production has been declining in recent years, according to the same source.
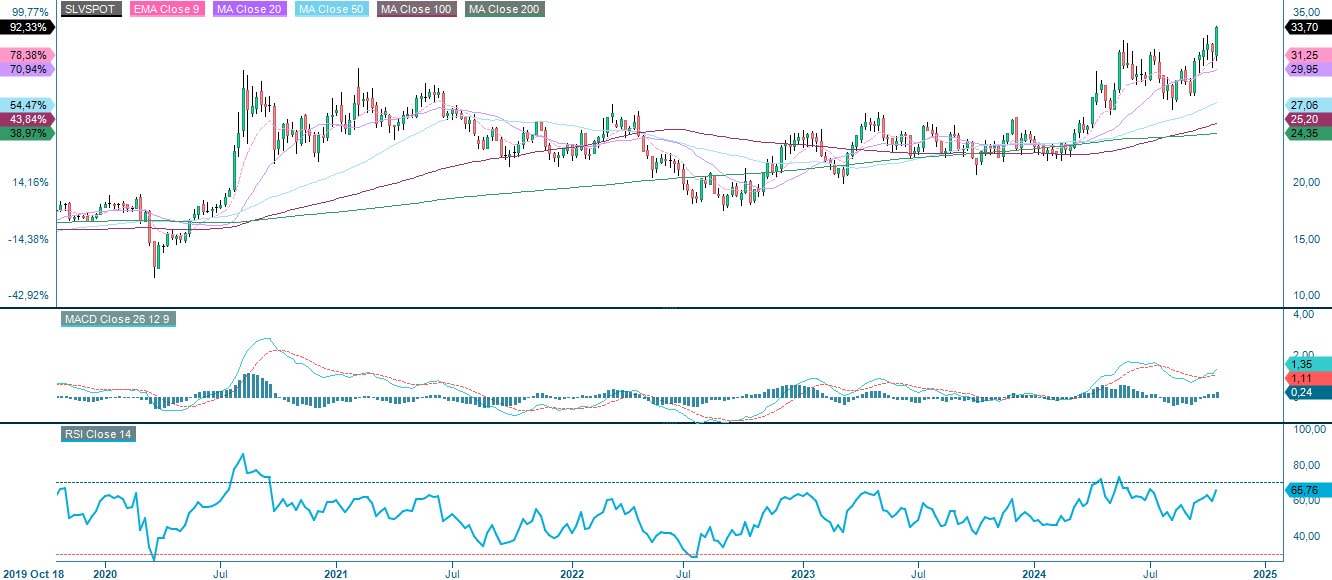
At the end of last week, silver prices rose to a new high for the year. This took the price above the previous high of $32.75 per ounce in May 2024, a level that is closely watched by traders. However, unlike gold, silver is still trading well below its all-time high. Silver reached around $50 per ounce in 2011. The gold/silver ratio, currently at 82, is in line with last year's average and has fluctuated between around 73 and 92 in 2024.
If the breakout in the silver price is confirmed, it could spur increased interest in the white metal and give the price another boost. It is not uncommon for a strong price rally to be “checked” at some point, i.e. the previous resistance being tested again, but now from above for support. If so, it could provide a timely buying opportunity.
Silver Spot Price (USD/oz), one-year daily chart

Silver Spot Price (USD/oz), five-year weekly chart
Macro comments
With around 70 S&P 500 companies reporting their Q3 2024 results, 79% of companies have reported a positive earnings surprise, while 64% have reported a positive revenue surprise. Expected earnings growth for Q3 2024 has fallen from 4.3% on 30 September 2024 to 3.4% on 18 October 2024, according to Earnings Insight. At the same time, this is the fifth consecutive quarter of year-over-year earnings growth for the S&P500.
Looking at the S&P500 sectors, three of them (Communication Services, Information Technology and Real Estate) have 100% of their Q3 2024 reports above expectations. They are followed by Financials and Consumer Staples with an 89% beat rate. For the fourth quarter of 2024, Wall Street analysts are forecasting earnings growth of 14.0% and revenue growth of 5.0% for S&P500 companies.
Today, Wednesday 23 October, we get a report on the Eurozone household confidence indicator for October. From the US, we get September existing home sales, oil inventories from the Department of Energy’s (DOE), weekly statistics and the Federal Reserve’s (Fed) Beige Book. The Bank of Canada makes an interest rate announcement. There are also interim reports from Tesla, Coca-Cola, Roche, T-Mobile US, Thermo Fisher Scientific, IBM, ServiceNow, NextEra Energy, AT&T, Boston Scientific, Boeing, General Dynamics, Deutsche Bank, Assa Abloy, SSAB, Atlas Copco, Handelsbanken, Husqvarna, Swedbank, Volvo Cars, Storebrand and DSV.
On Thursday, 24 October, we will receive the October industrial Purchase Managers’ Index (PMI) from Japan, India, France, Germany, the Eurozone, the UK and the US. In addition, French industrial expectations and UK Confederation of British Industry (CBI) industrial trends will be released, both for October. The US will contribute the Chicago Fed's national activity index as well as new home sales for September, initial jobless claims and the Kansas City Fed index for October. Q3 reports continue to roll in on Thursday with results from Honeywell, Unilever, Union Pacific, UPS, Whirlpool, Alfa Laval, SEB, Stora Enso, Telia, Equinor, Kone, Neste and Norsk Hydro.
US, Eurozone and UK manufacturing PMIs, October 2022 to October 2024 (Forecast)

Friday, 25th October begins with the Swedish Household Lending and Producer Price Index (PPI) for September. This is followed by the French Household Confidence Indicator and the German Business Climate Index (IFO), both for October. From the US, we get September durable goods orders and the October Michigan index. Friday will also see the release of several interim reports, including those from Sanofi, HCA, ENI, Colgate-Palmolive, Natwest Group, Mercedes Benz, Vale, Centene, Indutrade, Lagercrantz, Balder, Castellum, Electrolux, Epiroc, Hexagon, SCA, Konecranes, Kemira, Yara and Schibsted.
The Tesla report a potential trigger
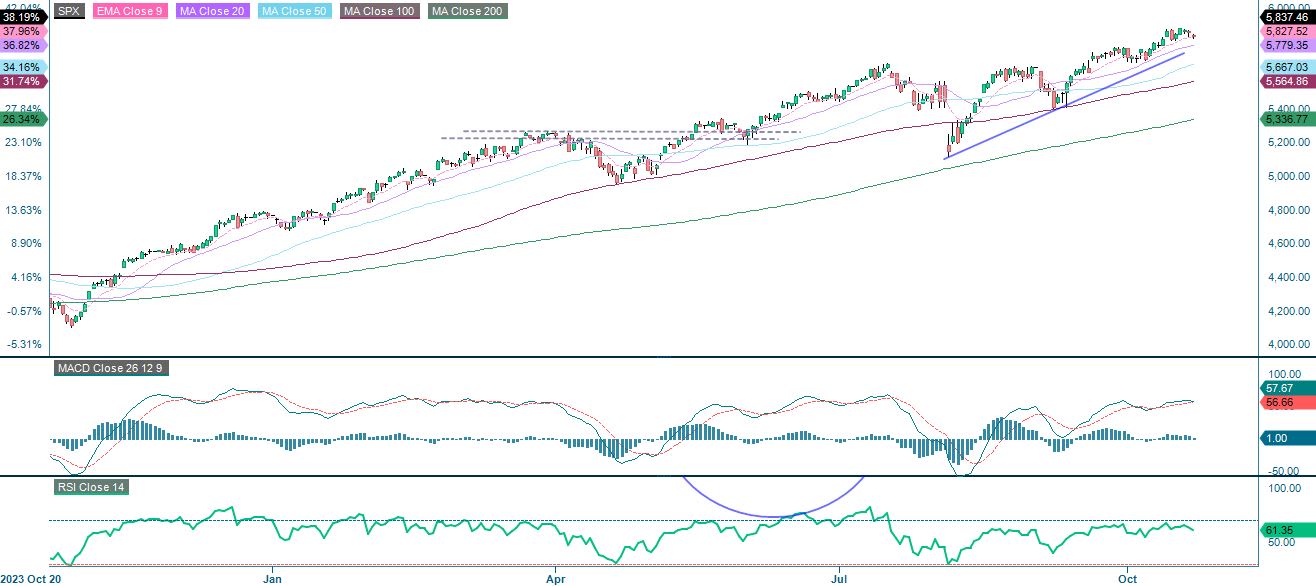
S&P 500 is trading sideways ahead of the reporting season. Momentum is positive but fading. Reporting season can definitely be the trigger sending the index to new highs. Today, Tesla will report today after US closing and is likely to affect the sentiment.
S&P 500 (in USD), one-year daily chart
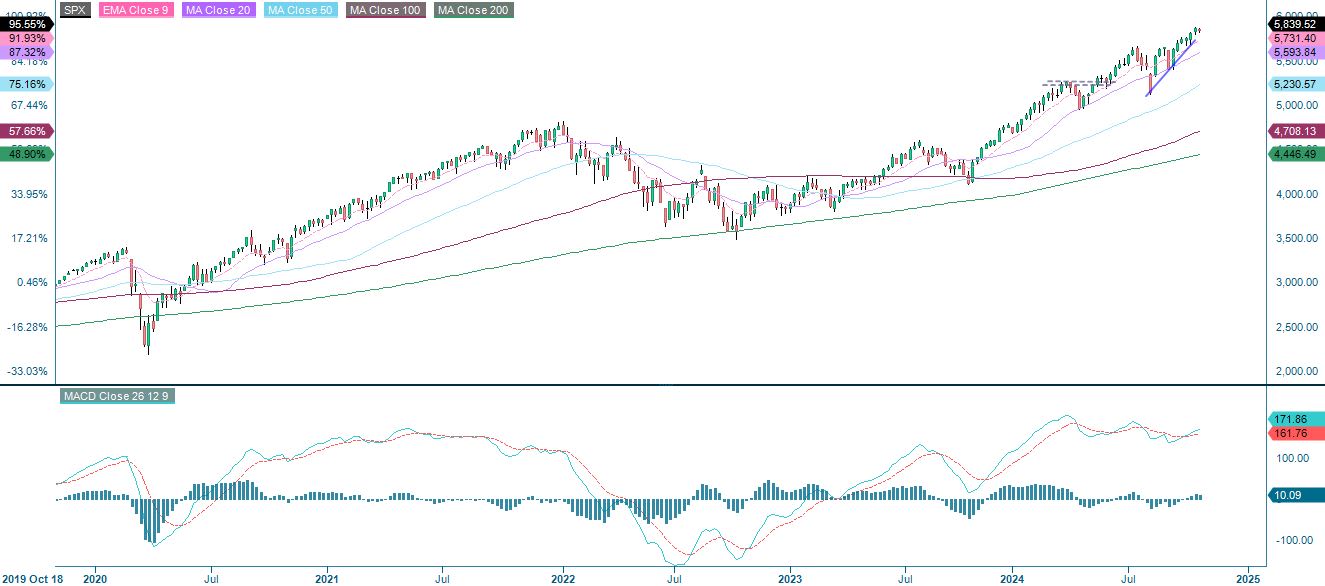
S&P 500 (in USD), weekly five-year chart
The Nasdaq 100 is also consoldating at the moment.
Nasdaq 100 (in USD), one-year daily chart
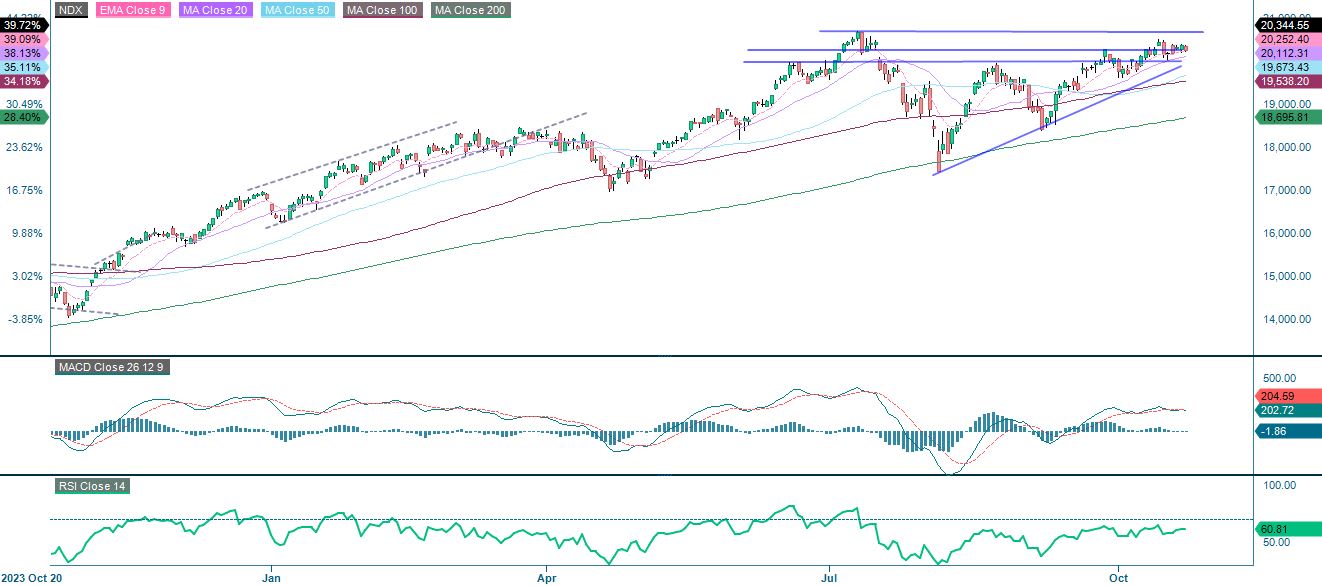
Nasdaq 100 (in USD), weekly five-year chart

The German DAX is trading below the EMA9 but above the MA20. A break below MA20 and the short term trend can be considered broken. Levels around 19,000 could be next.
DAX (in EUR), one-year daily chart

DAX (in EUR), weekly five-year chart

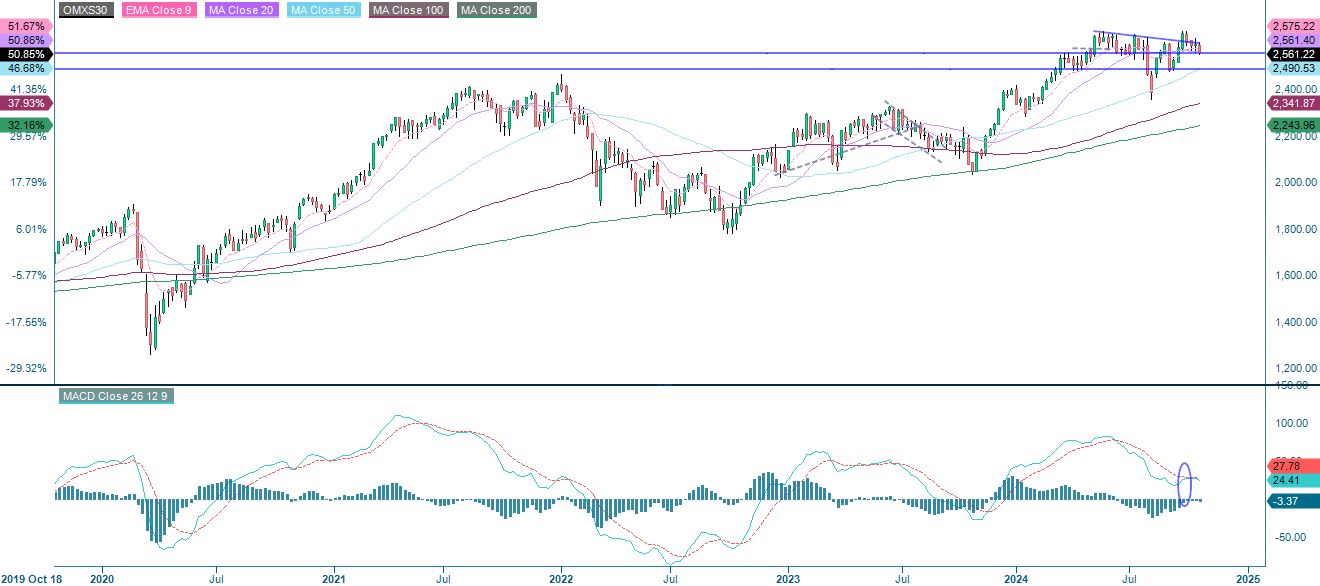
The OMXS30 is back at the support formed by the MA100, with downward momentum as indicated by the MACD. Note also that the MACD is close to generating a sell signal. A break below the MA100 and 2,550 and the MA200, currently at 2,520, could be next.
OMXS30 (in SEK), one-year daily chart

OMXS30 (in SEK), weekly five-year chart
The full name for abbreviations used in the previous text:
EMA 9: 9-day exponential moving average
Fibonacci: There are several Fibonacci lines used in technical analysis. Fibonacci numbers are a sequence in which each successive number is the sum of the two previous numbers.
MA20: 20-day moving average
MA50: 50-day moving average
MA100: 100-day moving average
MA200: 200-day moving average
MACD: Moving average convergence divergence
Risks
Credit risk of the issuer:
Investors in the products are exposed to the risk that the Issuer or the Guarantor may not be able to meet its obligations under the products. A total loss of the invested capital is possible. The products are not subject to any deposit protection.
Currency risk:
If the product currency differs from the currency of the underlying asset, the value of a product will also depend on the exchange rate between the respective currencies. As a result, the value of a product can fluctuate significantly.
External author:
This information is in the sole responsibility of the guest author and does not necessarily represent the opinion of Bank Vontobel Europe AG or any other company of the Vontobel Group. This information is sponsored by Bank Vontobel Europe AG, which may be a counterparty to transactions involving the financial instruments discussed in this information. The further development of the index or a company as well as its share price depends on a large number of company-, group- and sector-specific as well as economic factors. When forming his investment decision, each investor must take into account the risk of price losses. Please note that investing in these products will not generate ongoing income.
The products are not capital protected, in the worst case a total loss of the invested capital is possible. In the event of insolvency of the issuer and the guarantor, the investor bears the risk of a total loss of his investment. In any case, investors should note that past performance and / or analysts' opinions are no adequate indicator of future performance. The performance of the underlyings depends on a variety of economic, entrepreneurial and political factors that should be taken into account in the formation of a market expectation.
Market risk:
The value of the products can fall significantly below the purchase price due to changes in market factors, especially if the value of the underlying asset falls. The products are not capital-protected
Product costs:
Product and possible financing costs reduce the value of the products.
Risk with leverage products:
Due to the leverage effect, there is an increased risk of loss (risk of total loss) with leverage products, e.g. Bull & Bear Certificates, Warrants and Mini Futures.
Disclaimer:
This information is neither an investment advice nor an investment or investment strategy recommendation, but advertisement. The complete information on the products (securities) mentioned herein, in particular the structure and risks associated with an investment, are described in the base prospectus, together with any supplements, as well as the final terms relating to the securities. The base prospectus and final terms constitute the solely binding sales documents for the products mentioned herein. It is recommended that potential investors read these documents before making any investment decision. The documents and the key information document are published on the website of the issuer, Vontobel Financial Products GmbH, Bockenheimer Landstrasse 24, 60323 Frankfurt am Main, Germany, on https://prospectus.vontobel.com and are available from the issuer free of charge. The approval of the prospectus should not be understood as an endorsement of the securities. The securities are products that are not simple and may be difficult to understand. This information includes or relates to figures of past performance. Past performance is not a reliable indicator of future performance. This information may only be distributed or published in countries where such distribution or publication is permitted by applicable law. As stated in the relevant base prospectus, the distribution of the securities mentioned in this information is subject to restrictions in certain jurisdictions. This advertisement may not be reproduced or redistributed without prior permission by Vontobel.
© Bank Vontobel Europe AG and / or affiliated companies. All rights reserved.