Volvo shares to close gap on Cat?


This week's case is a comparison between Volvo and Caterpillar, with the Caterpillar share outperforming recently. There are signs of cyclical momentum as commodities and interest rates rise again. In terms of valuation, Volvo's shares trade at low multiples. Volvo's significant exposure to markets outside Europe makes this even more evident.
Case of the week: Valuation of Volvo vs Caterpillar
Industrial stocks on the OMX Stockholm 30 have largely traded sideways since April and May. At the same time, US industrials such as Caterpillar have performed much better. One explanation could be that Swedish engineering companies are more exposed to Europe, while Caterpillar sells relatively more in North America, where growth is stronger than in Europe. At the same time, Swedish industrial companies such as Volvo have significant sales exposure to emerging markets such as South America and Asia, similar to Caterpillar. In fisical year 2023 (FY), 44% of Volvo Group sales were generated in Europe, 28% in North America, 12-13% in Asia, 8-9% in South America and 7% in Africa and Oceania. The strong presence in North America is partly due to previous acquisitions such as Mack.
By comparison, 54% of Caterpillar's FY2023 revenue came from countries other than the United States. The North American market for trucks or construction equipment has not been particularly strong so far in 2024. For trucks, this is more the case in South America, for example. Caterpillar's latest guidance, following its Q2 2024 report, is that group sales in FY2024 should be slightly lower than in 2023.
Volvo Group, Geographical distribution of sales FY 2023 (in SEK)

Trucks accounted for 72% of the Volvo Group's sales in the last twelve months (Q3 2023 to Q2 2024), Construction equipment for 19%, Buses for 5% and Volvo Penta (marine engines) for 4%.
Volvo currently trades at a modest price-to-earnings ratio (P/E) multiple of 11x and the enterprise value to earnings before interest and taxes (EV/EBIT) multiple for the next 12 months from 30 June is also around 11x. The price to book value (P/BV) valuation is also low at around 3.5x. At the same time, Caterpillar's valuation has risen to 16.1x P/E and 14.9x EV/EBIT, while P/BV is 9.4x.
In terms of profitability, Volvo Group achieved an operating margin of 14% in the first half of 2024. Caterpillar had a higher profitability in H1 2024, with an operating margin of just over 21%. Higher profitability for Caterpillar could justify some of its premium valuation. However, the gap between Caterpillar and Volvo has widened significantly so far in 2024 and the profitability deviation between the two companies is not so new.
Another explanation to the valuation gap (some 20 to 25% of it) is that the USD has weakened by approximately 5% against the SEK since April-May 2024.
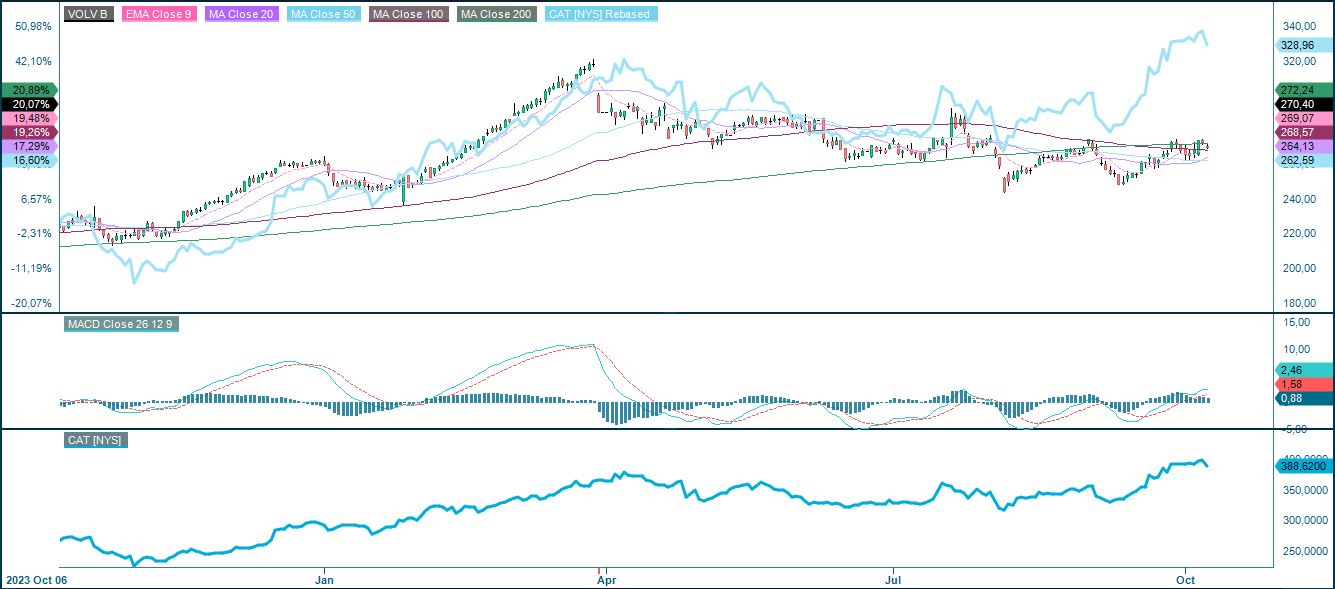
There are some signs of underlying cyclical momentum, such as a rise in copper futures prices since September. The valuation gap between Caterpillar and Volvo is partly explained by Caterpillar's higher profitability and a weaker USD against the SEK. However, Volvo has global sales exposure with a particularly strong presence in North America. It seems as if the valuation gap could be narrowing.
Volvo B (in SEK) vs Caterpillar (in USD), one-year daily comparative chart
Volvo B (in SEK) vs Caterpillar (in USD), five-year weekly comparative chart

Volvo will report its Q3 results next Friday, 18 October, while Caterpillar is scheduled to report its next interim results on Thursday 24 October.
Macro comments
US non-farm payrolls and hourly earnings came in better and higher than expected on Friday 4 October. The S&P 500 closed up 0.9%, the Nasdaq up 1.2% and the Russell 2000 up 1.5% on Friday 4 October. US market interest rates were significantly higher, with the 10-year US Treasury yield at 3.96% (+12bps) and the 2-year US Treasury yield at 3.92% (+21bps). Base metals traded higher and
oil prices rose slightly. In addition to a still fairly strong US economy, the escalation of the war in the Middle East has pushed oil prices higher.
US 2-year Treasury yield, weekly five-year chart

Today, Wednesday 9th October, we get the German Trade Balance for August. From the US, the wholesale inventories, oil inventories from department of energy (DOE) and the Federal reserve (Fed) minutes from the September 18th meeting will be released.
On Thursday 10 October, Statistics Sweden will publish the Gross Domestic Product (GDP) indicator and industrial orders for August. From the US, initial jobless claims and the Consumer Price Index (CPI) for September are due. On Thursday we will also receive an interim report from the Japanese retail company Fast Retailing and Delta Airlines and the Progressive from the United States.
On Friday, 11th October, we start with UK GDP and Industrial Production for August.
We continue with German CPI for September. After lunch, the focus shifts to North America with the release of Canada's September employment figures, as well as the September producer price index (PPI) and October Michigan index from the US. On Friday, the Q3 reporting season begins in earnest in the US with interim results from JP Morgan and Wells Fargo.
Is risk back on the downside?
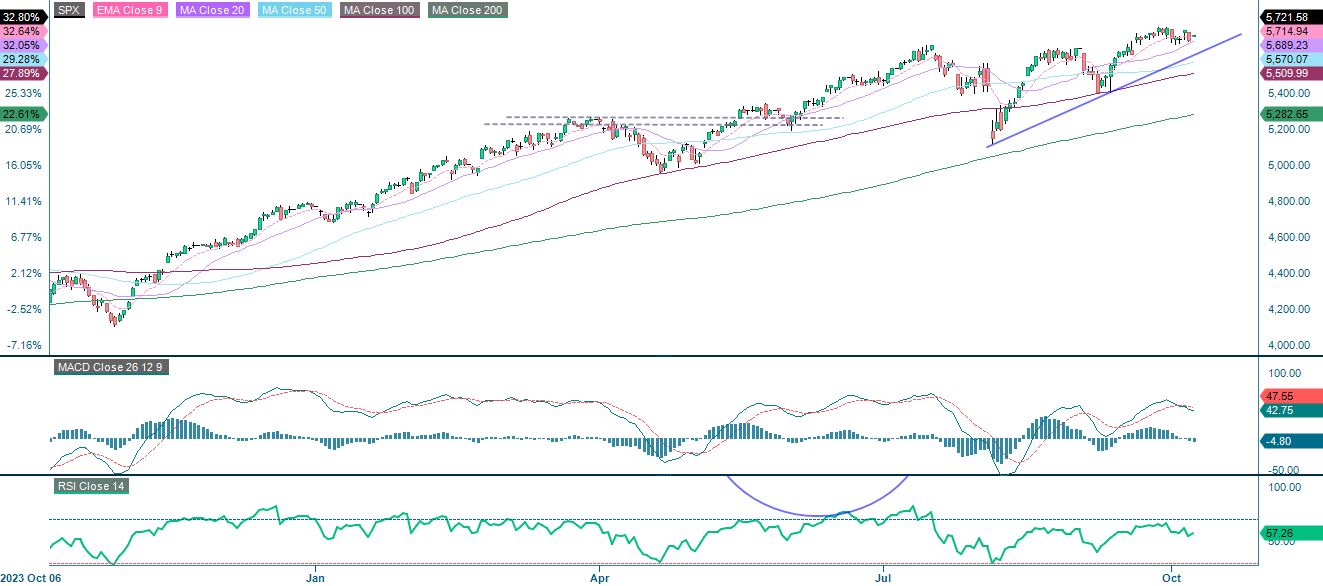
Despite strong US employment data and a rapid rise in yields, equities have held up well. The broader S&P 500 is consolidating above MA20 which acts as a first level of support. Note the MACD which has generated a soft sell signal.
S&P 500 (in USD), one-year daily chart
S&P 500 (in USD), weekly five-year chart

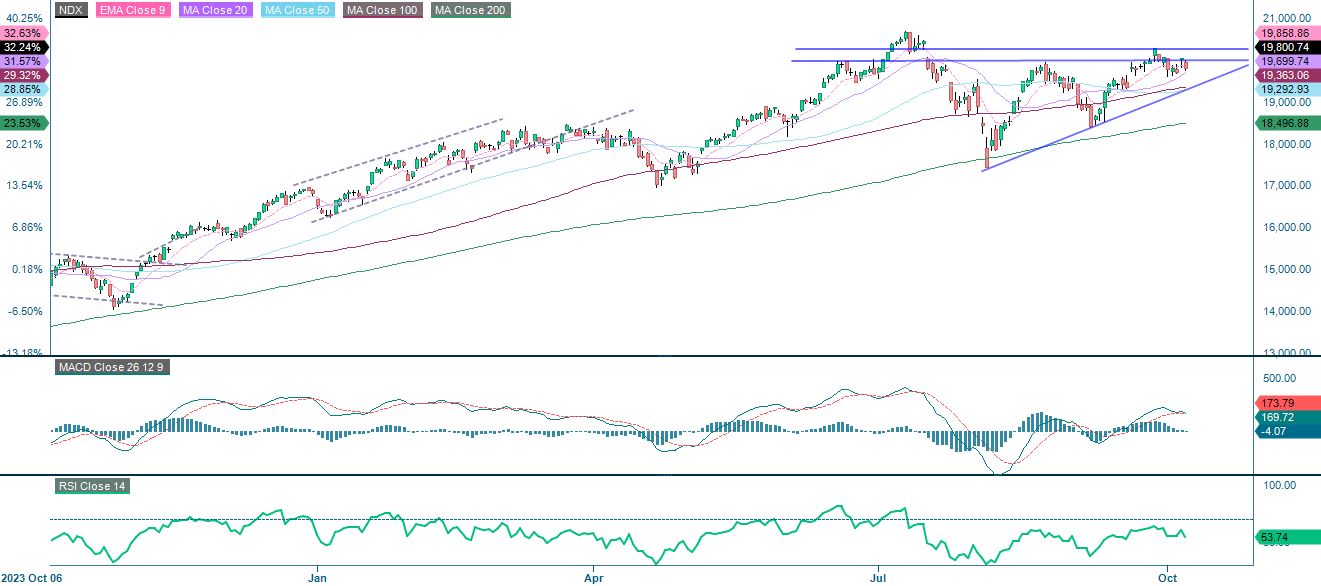
The Nasdaq 100 has not really been hit as hard by the sharp rise in yields as one might have expected. The index has been trading sideways just above the MA20, which serves as the first level of support on the downside. This is followed by the MA100, currently at 19,363. Should the index break above the first level of resistance at 20,115 and the previous high from July could be tested.
Nasdaq 100 (in USD), one-year daily chart
Nasdaq 100 (in USD), weekly five-year chart

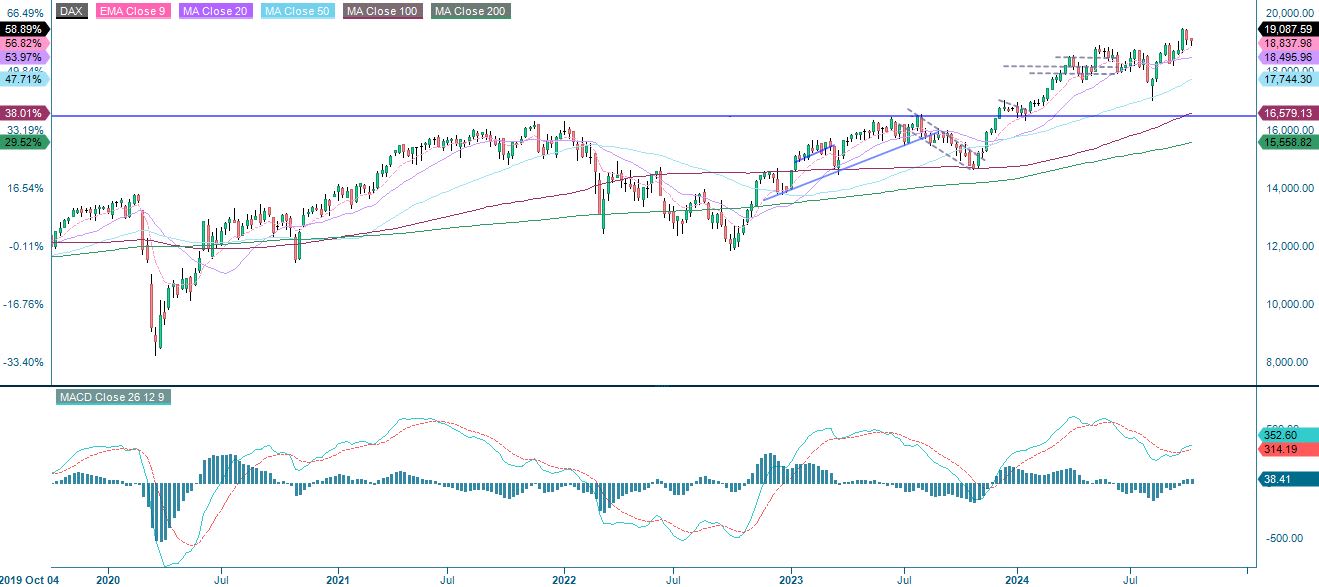
The DAX is testing a steep upward channel. The short-term risk is to the downside as the MACD has generated a soft sell signal. A break below the MA20, currently at 18,941, and levels around 18,500 could be next.
DAX (in EUR), one-year daily chart

DAX (in EUR), weekly five-year chart
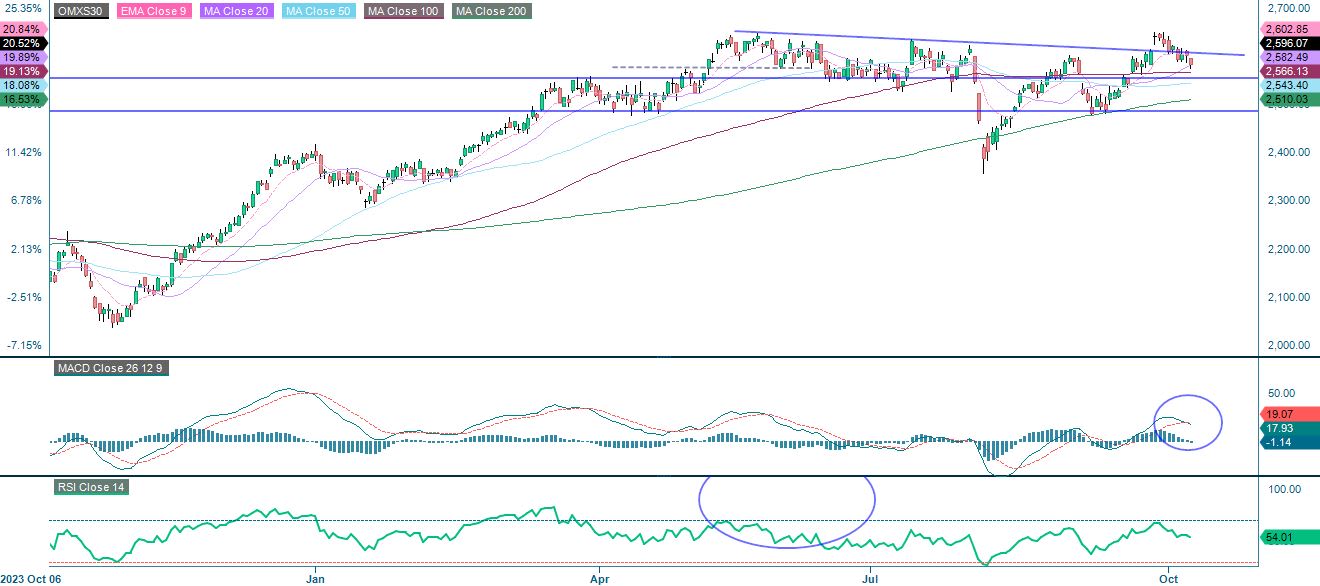
The Swedish OMXS30 continues to struggle. As shown in the chart below, the index is currently trading at a MA20 which must hold for the short-term trend to remain positive. Note how the MACD has generated a soft sell signal. In case of a bearish break, the next level is between 2,543 and 2,566. This is followed by 2,509.
OMXS30 (in SEK), one-year daily chart
OMXS30 (in SEK), weekly five-year chart

The full name for abbreviations used in the previous text:
EMA 9: 9-day exponential moving average
Fibonacci: There are several Fibonacci lines used in technical analysis. Fibonacci numbers are a sequence in which each successive number is the sum of the two previous numbers.
MA20: 20-day moving average
MA50: 50-day moving average
MA100: 100-day moving average
MA200: 200-day moving average
MACD: Moving average convergence divergence
Risks
Credit risk of the issuer:
Investors in the products are exposed to the risk that the Issuer or the Guarantor may not be able to meet its obligations under the products. A total loss of the invested capital is possible. The products are not subject to any deposit protection.
Currency risk:
If the product currency differs from the currency of the underlying asset, the value of a product will also depend on the exchange rate between the respective currencies. As a result, the value of a product can fluctuate significantly.
External author:
This information is in the sole responsibility of the guest author and does not necessarily represent the opinion of Bank Vontobel Europe AG or any other company of the Vontobel Group. This information is sponsored by Bank Vontobel Europe AG, which may be a counterparty to transactions involving the financial instruments discussed in this information. The further development of the index or a company as well as its share price depends on a large number of company-, group- and sector-specific as well as economic factors. When forming his investment decision, each investor must take into account the risk of price losses. Please note that investing in these products will not generate ongoing income.
The products are not capital protected, in the worst case a total loss of the invested capital is possible. In the event of insolvency of the issuer and the guarantor, the investor bears the risk of a total loss of his investment. In any case, investors should note that past performance and / or analysts' opinions are no adequate indicator of future performance. The performance of the underlyings depends on a variety of economic, entrepreneurial and political factors that should be taken into account in the formation of a market expectation.
Market risk:
The value of the products can fall significantly below the purchase price due to changes in market factors, especially if the value of the underlying asset falls. The products are not capital-protected
Product costs:
Product and possible financing costs reduce the value of the products.
Risk with leverage products:
Due to the leverage effect, there is an increased risk of loss (risk of total loss) with leverage products, e.g. Bull & Bear Certificates, Warrants and Mini Futures.
Disclaimer:
This information is neither an investment advice nor an investment or investment strategy recommendation, but advertisement. The complete information on the products (securities) mentioned herein, in particular the structure and risks associated with an investment, are described in the base prospectus, together with any supplements, as well as the final terms relating to the securities. The base prospectus and final terms constitute the solely binding sales documents for the products mentioned herein. It is recommended that potential investors read these documents before making any investment decision. The documents and the key information document are published on the website of the issuer, Vontobel Financial Products GmbH, Bockenheimer Landstrasse 24, 60323 Frankfurt am Main, Germany, on https://prospectus.vontobel.com and are available from the issuer free of charge. The approval of the prospectus should not be understood as an endorsement of the securities. The securities are products that are not simple and may be difficult to understand. This information includes or relates to figures of past performance. Past performance is not a reliable indicator of future performance. This information may only be distributed or published in countries where such distribution or publication is permitted by applicable law. As stated in the relevant base prospectus, the distribution of the securities mentioned in this information is subject to restrictions in certain jurisdictions. This advertisement may not be reproduced or redistributed without prior permission by Vontobel.
© Bank Vontobel Europe AG and / or affiliated companies. All rights reserved.