Rising expectations for Fed cuts


This week's case is corn, where prices have been falling since 2022. However, flooding in central Europe and drought in the US Corn Belt could give corn prices a chance to rise again in the autumn of 2024. The Federal Reserve (Fed) is expected to start cutting rates on Wednesday and continue to do so throughout 2024. The odds of a 50 bp rate cut have increased.
Case of the week: The corn comeback story
Corn futures peaked in the summer of 2022 and have been trending lower since then. The U.S. department of agriculture (USDA) estimates that corn will reach 183.1 bushels per acre, with ending stocks in the USA expected to be 46.02 million metric tons (MMT). On the demand side, China, a large importer of corn, has fallen short of expectations. Although corn futures prices have rallied somewhat as the September contract rolled off, corn may have more to give as we move into the autumn of 2024 and harvesting picks up.
Corn is the most produced grain worldwide due to its versatility as a staple food for both people and livestock. The USA is by far the largest producing country. The typical crop season for corn in the US begins with planting in April and May, followed by harvesting from September to November. For the 2023/24 season, the US is estimated to have produced 389.69 MMT of corn. This compares to 346.74 MMT for the 2022/23 season, an increase of 12.4%. Of the 389.69 MMT, only ~15% is estimated to have gone for export, with around 38% used for domestic feed. As for the crops currently being harvested in the 2024/25 season, the USDA is forecasting US production of 385.73 MMT. This compares with the August WASDE estimate of 384.74 MMT, a marginal increase. In terms of other big producers, China, Brazil and the European Union (EU) are amongst the world’s top producers and importers. Ukraine in particular stands out as as a producer in Europe, accounting for almost half of production. For the 2024/25 season, the USDA forecasts that China will produce 292 MMT, Brazil 127 MMT and the EU 59 MMT. Of these estimates, only the EU was revised down in the September edition of the World Agricultural Supply and Demand Estimates (WASDE) report. On the import side, China is expected to import 21 MMT, down from 23 MMT in August. Brazil and the EU are expected to import 1.5 MMT and 19 MMT respectively.
As mentioned previously, corn has been on a negative price trend for most of the last two years. While the war in Ukraine has stoked uncertainty, as can be seen by the spike in volatility and skew in February 2022, both metrics have spent the majority of 2024 without much movement. Notably, skewness has stayed above 0 and has started to pick up pace in recent days, suggesting budding optimism for higher prices. This would make sense as corn has been out of groove compared to historical seasonality.
Corn CVOL index and Skew (%), three-year daily chart

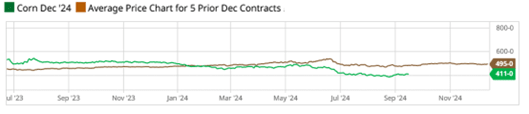
As can be seen in the seasonal chart below, the December corn contract has traded below the average price of the five previous December contracts for most of the year. Furthermore, although not readily apparent from the chart, corn tends to see a bump in futures prices during the harvest season. With yields for the 2024/25 crop expected to be good and demand from China muted, the downward pressure that has persisted so far in 2024 has been justified. However, it should not take many setbacks for corn prices to snap back. With heavy precipitation and flooding of the lower Danube, crop yields in some EU producing countries have been damaged. Furthermore, with drought development likely to develop in part of the US Corn Belt, there is a risk that unharvested crops could suffer from overly dry and warm conditions. In summary, expectations for both 2024/25 production and demand for corn are diametrically opposed, with bullish expectations for production and bearish sentiment for demand. This is an opportunity for the devil’s advocate, as many factors could prevent corn from falling further.
Seasonal Chart, Corn December 2024 compared to previous contracts (USD/BU)
U.S. Seasonal Drought

Corn Dec 2024 future (USD/Bushel Contract for Difference (CFD)), one-year daily chart

Corn Dec 2024 future (USD/Bushel Contract for Difference (CFD)), five-year weekly chart

Macro comments
The key macro event this week is the Fed's interest rate decision, which will be announced today (Wednesday, September 18). According to Zacks Investment Research, the odds of a 50 basis point cut versus a 25 basis point cut have now shifted to 63/37%. For the remainder of 2024 (18 September, 7 November and 18 December), investors are pricing in a total of 120bp of rate cuts by the Fed. Wednesday will also see the release of August consumer price index (CPI) for the Eurozone. From the US, we have August Housing Starts and weekly Oil Inventories from the department of energy. An interim report from General Mills is also due on Wednesday.
On Thursday, 19th September, the Euro-Zone Current Account Balance for July and the Bank of England's Interest Rate Statement will be published. From the US, we will get the Q2 current account balance, the Philadelphia Fed index for September, weekly jobless claims as well as existing home sales and leading indicators, both for August. Also on Thursday, FedEx and Lennar are expected to report interim results.
On Friday the 20th, we will get the German Producer Price Index for September, the French Industrial Expectations and the Eurozone Household Consumer Confidence, both later for August.
Price movements in global equity markets have been relatively small over the past month, as they have been over the past six months. The chart below shows the indices in order of best to worst performance over the past month. In the long term, the Nasdaq and the S&P500 remain the leading indices. Shanghai stands out for its weak performance in both the short and long term.
One-month, year-to-date and five-year performance of major equity indices

Is the 50-point rate cut the trigger?
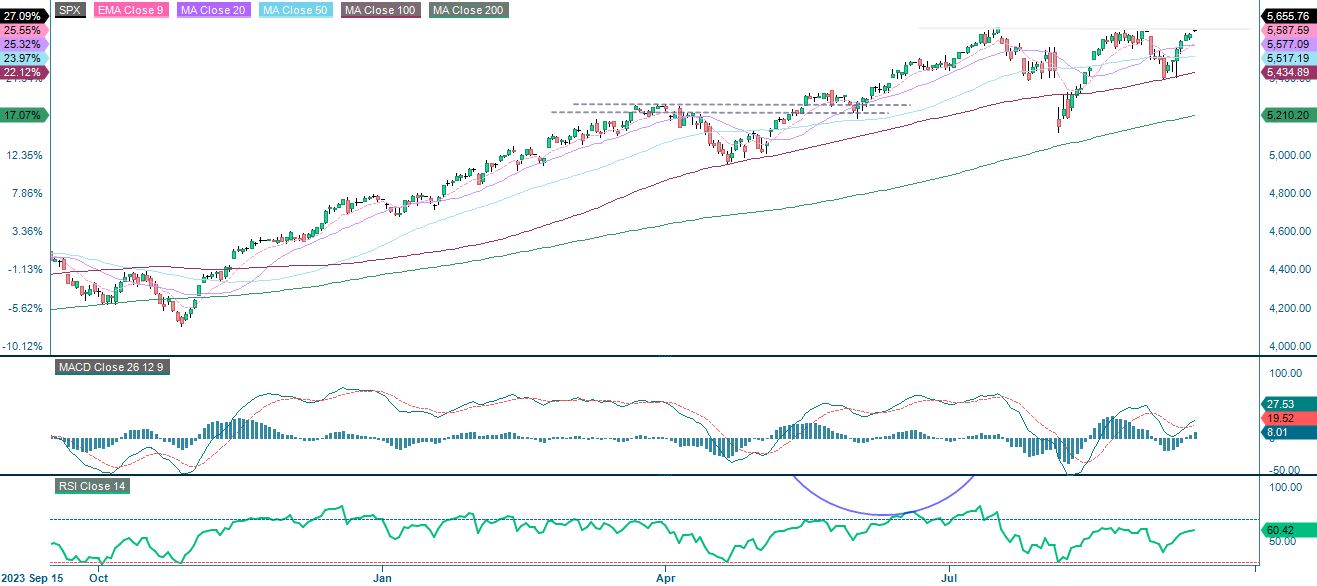
The S&P 500 is currently trading at resistance formed by the previous two peaks. Interest rates are under pressure as the market is pricing in increasing odds of a 50-point rate cut from the Fed today. Is this the trigger that can take the S&P 500 to new highs?
S&P 500 (in USD), one-year daily chart
S&P 500 (in USD), weekly five-year chart

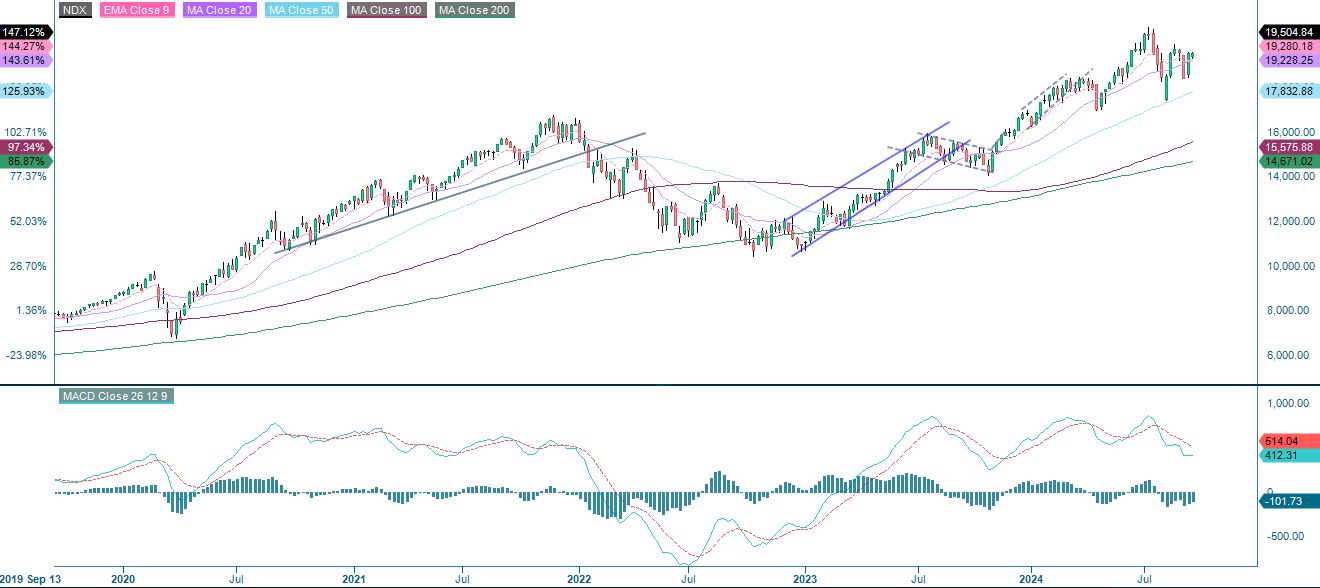
Meanwhile, the Nasdaq 100 remains in a consolidation phase in what can be seen as a large neutral wedge formation - calling for a big move in the direction of the break. Perhaps the Fed will decide in which direction.
Nasdaq 100 (in USD), one-year daily chart

Nasdaq 100 (in USD), weekly five-year chart
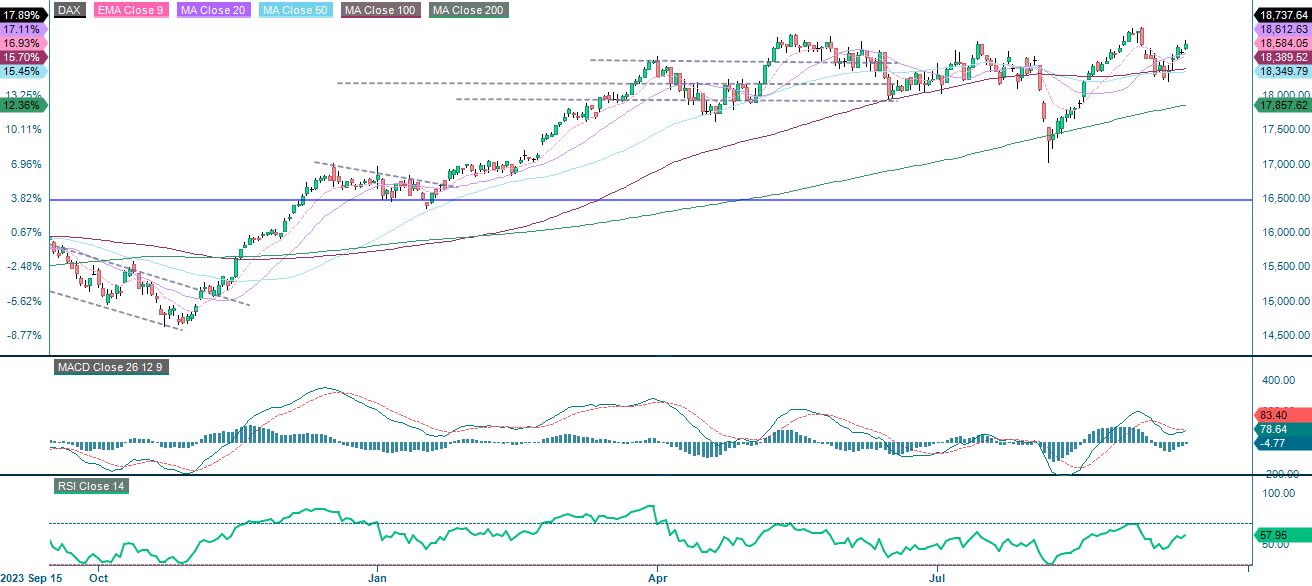
The German DAX is also trading close to the previous high, waiting for a new positive trigger to ring in new highs (or to fail to break up).
DAX (in EUR), one-year daily chart
DAX (in EUR), weekly five-year chart

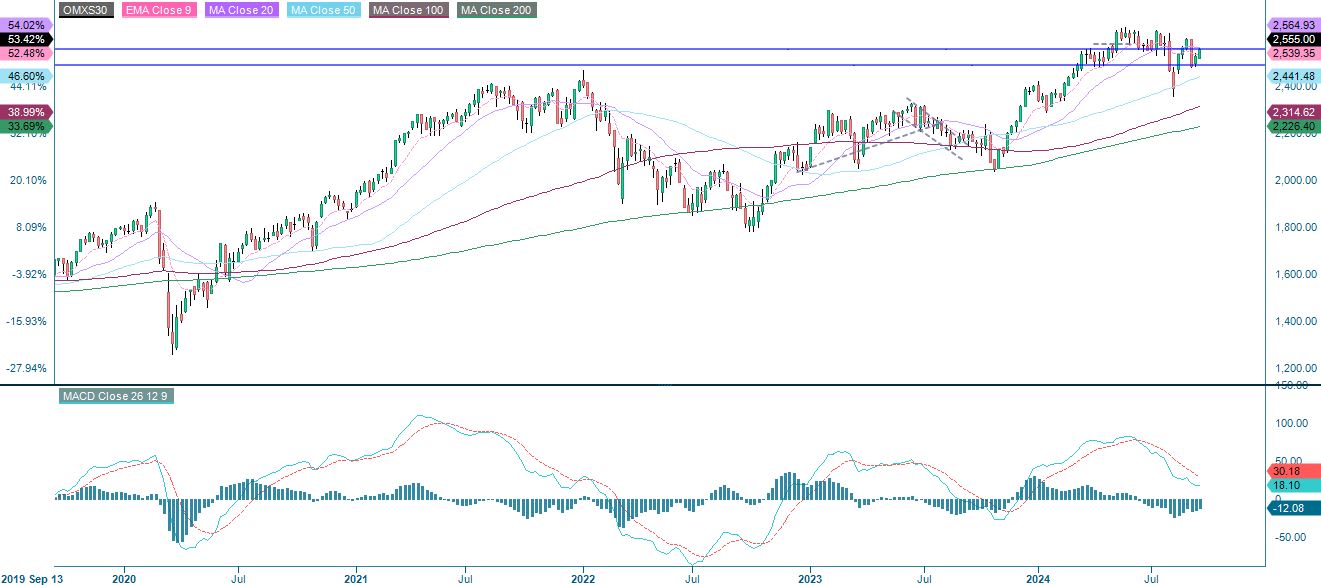
The OMXS30 is stuck at the MA100. A positive market reaction to the Fed could also trigger the OMXS30.
OMXS30 (in SEK), one-year daily chart

OMXS30 (in SEK), weekly five-year chart
The full name for abbreviations used in the previous text:
EMA 9: 9-day exponential moving average
Fibonacci: There are several Fibonacci lines used in technical analysis. Fibonacci numbers are a sequence in which each successive number is the sum of the two previous numbers.
MA20: 20-day moving average
MA50: 50-day moving average
MA100: 100-day moving average
MA200: 200-day moving average
MACD: Moving average convergence divergence
Risks
External author:
This information is in the sole responsibility of the guest author and does not necessarily represent the opinion of Bank Vontobel Europe AG or any other company of the Vontobel Group. This information is sponsored by Bank Vontobel Europe AG, which may be a counterparty to transactions involving the financial instruments discussed in this information. The further development of the index or a company as well as its share price depends on a large number of company-, group- and sector-specific as well as economic factors. When forming his investment decision, each investor must take into account the risk of price losses. Please note that investing in these products will not generate ongoing income.
The products are not capital protected, in the worst case a total loss of the invested capital is possible. In the event of insolvency of the issuer and the guarantor, the investor bears the risk of a total loss of his investment. In any case, investors should note that past performance and / or analysts' opinions are no adequate indicator of future performance. The performance of the underlyings depends on a variety of economic, entrepreneurial and political factors that should be taken into account in the formation of a market expectation.
Currency risk:
If the product currency differs from the currency of the underlying asset, the value of a product will also depend on the exchange rate between the respective currencies. As a result, the value of a product can fluctuate significantly.
Credit risk of the issuer:
Investors in the products are exposed to the risk that the Issuer or the Guarantor may not be able to meet its obligations under the products. A total loss of the invested capital is possible. The products are not subject to any deposit protection.
Market risk:
The value of the products can fall significantly below the purchase price due to changes in market factors, especially if the value of the underlying asset falls. The products are not capital-protected
Product costs:
Product and possible financing costs reduce the value of the products.
Risk with leverage products:
Due to the leverage effect, there is an increased risk of loss (risk of total loss) with leverage products, e.g. Bull & Bear Certificates, Warrants and Mini Futures.