Market will focus on Nvidia and inflation


This week's case is to go long platinum and short gold. Markets will focus on Nvidia's interim report later today, Wednesday the 28th, and the US PCE price index on Friday the 30th. This could influence the Fed's interest rate decisions, not immediately but with some delay.
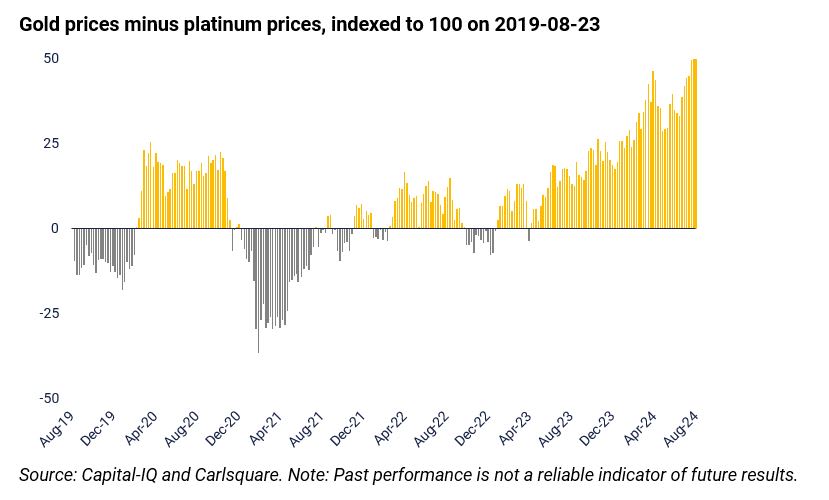
Case of the week: Platinum vs. Gold, long vs short
The gold bulls have been on a rampage since February this year, with gold trading at ATH. The catalyst for this rally has been favourable macroeconomic data, with Fed Chairman Jerome Powell hinting that the Fed is ready to adjust policy. With 100bps of rate cuts priced in for the rest of 2024, markets are clearly pricing in a macroeconomic sunshine scenario. However, one precious metal, platinum, seems to have been left in the shadows. We see an opportunity for a long-short play, with "overbought" gold easing towards "underbought" platinum.
For non-interest-bearing assets such as gold, consumption figures, employment rates and wage growth are all factors that contribute to futures prices. More specifically, inflation and expectations of future inflation are negatively correlated with these prices. With inflation comes higher interest rates, raising the alternative cost of investments such as gold. The annual inflation CPI-rate in the US slowed for the fourth consecutive month to 2.9% in July, below the expected 3.0%. Notable components that eased included prices for both new and used cars and trucks. The corresponding inflation figure for August will be released on 11th September. Expectations remain upbeat, with a University of Michigan survey suggesting that inflation will remain at 2.9%. This contrasts with the typical seasonal pattern of August, being slightly hotter than July.
It is clear why gold and other metals such as copper and silver have rallied since February this year. Looking at the RSI for all three, they are overbought on a 1-year basis, even after the volatility spike in early August. While silver and copper have seen some profit-taking, gold has been steady. There are several macroeconomic triggers in the coming weeks that will test this trend. Focusing on the US: GDP Growth on Thursday the 29th, Core PCE and Personal Income & Spending on Friday the 30th, Non-Farm Payrolls and Unemployment Rate on Friday the 6th and Inflation on Wednesday the 11th. Given the overwhelmingly positive sentiment, a poor reading could potentially scare off less confident gold investors and cause a short-term rout in prices.
Platinum futures, on the other hand, have not enjoyed the same bullish sentiment. Mainly used in automobiles, along with the metal palladium, in catalytic converters, and platinum is also used in other industries such as jewelry. On the demand side, platinum is stable, with consumption of the metal expected to fall by just 1.3% in 2024. By comparison, primary supply is expected to decline by 2.0% over the same period. This ratio was established after the post-covid inflation spike, when carmakers were uncertain about future prices. As a result, they bought more platinum, palladium and rhodium than they needed to stockpile and hedge against expected price increases. As it turned out, the price rise never materialized. Instead, production failed to meet demand and platinum stocks fell by 598,000 ounces.
All in all, the gold bull run has been intense and partly fueled by increasing confidence that the Fed will start to take the brakes off. Platinum, on the other hand, has been suppressed as car sales, both electric and diesel, have remained flat to negative. With gold looking overbought and at risk of a short-term pullback should macroeconomic data go the wrong way, platinum looks a relatively attractive investment.

Gold (USD/t-ounce), five-year weekly chart

Platinum (USD/t-ounce), five-year weekly chart

Macro comments
The major US stock indexes ended last week with gains on Friday 23 August after Fed chief Jerome Powell defied expectations with strong hints of interest rate cuts. All sectors within the S&P500 rose, led by the interest-sensitive real estate sector, consumer discretionary and information technology. Investors again added Tesla and Nvidia to their favourites, with both stocks up 4.6%.
On the macroeconomic calendar today (Wednesday 28 August), the German GfK consumer confidence for September and the French household confidence indicator for August will be released in the morning. Later in the day, we get weekly oil inventories (DOE) from the US. Interim reports from Nvidia and Salesforce are also due.
On Thursday, 29th August, we will get the August CPI from Spain and Germany as well as the August Euro-zone barometer indicator. From the U.S., Q2 GDP, the goods trade balance and housing starts for July, as well as initial jobless claims will be released.
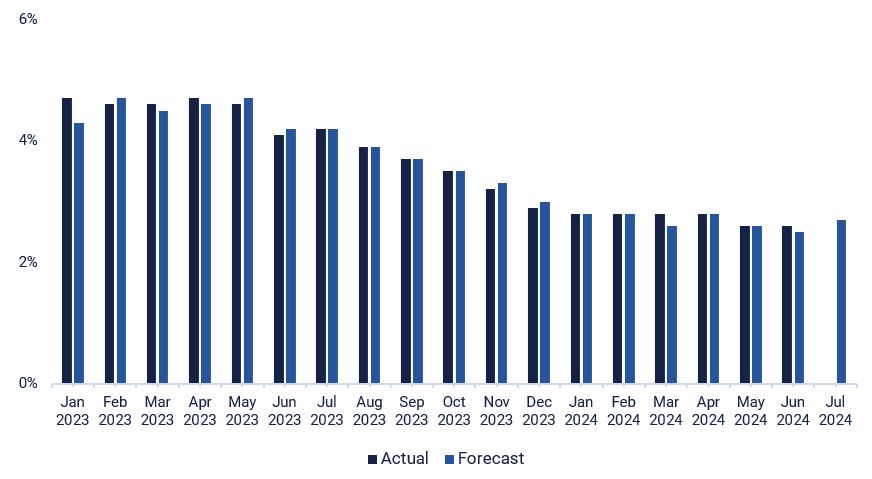
On Friday 30th August the August CPI for the Eurozone will be published. We will also get US inflation in the form of the so-called PCE deflator, which is expected to come in at 2.7%, slightly higher than in June. The Fed has clearly signalled that it is time to cut rates. However, inflation outcomes will continue to play a large role in the pace of future rate cuts.
US PCE price index from January 2023 to July 2024 (forecast)
At a crossroads, waiting for the next trigger
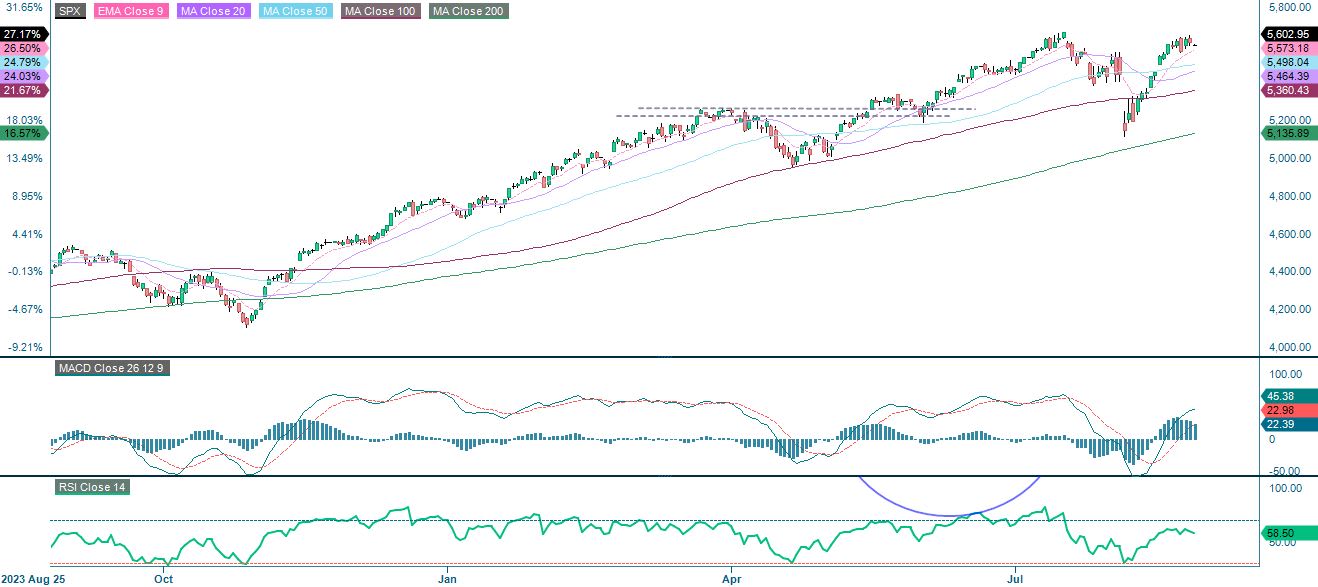
The S&P 500 is consolidating around its previous high of mid-July 2024. The market seems to be waiting for a trigger to push the index higher or lower. Nvidia's Q4 report on Wednesday, US initial jobless claims on Thursday and the US PCE price index on Friday could all act as such triggers.
S&P 500 (in USD), one-year daily chart
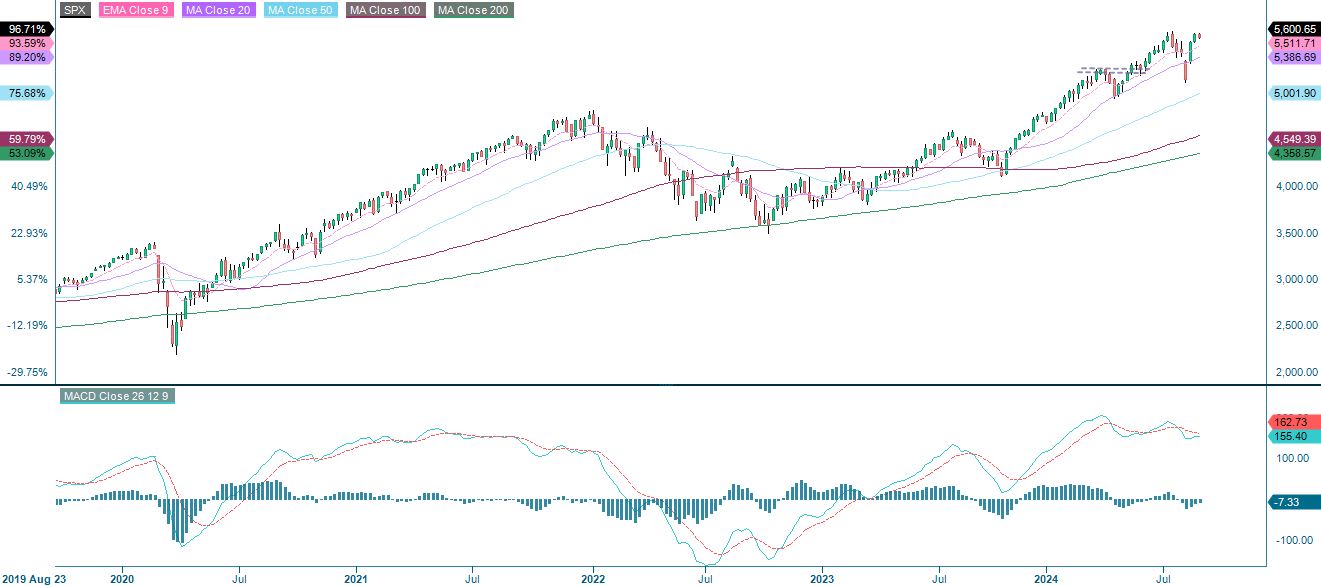
S&P 500 (in USD), weekly five-year chart
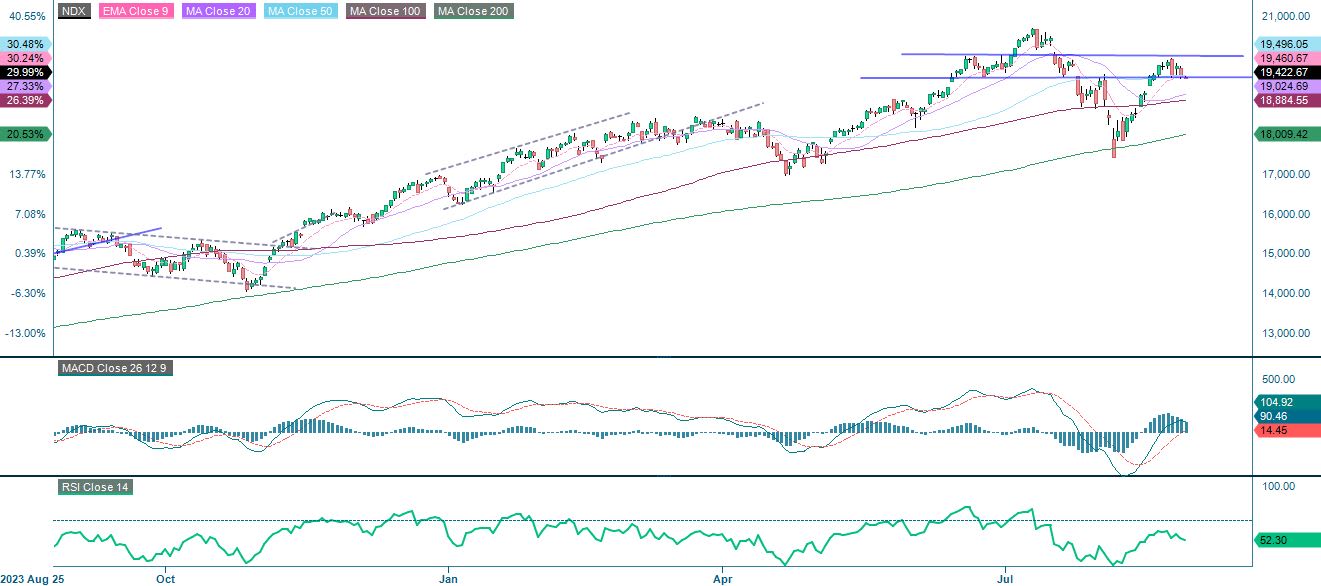
Meanwhile, the Nasdaq 100 is under pressure and is currently trading at support. The next level on the downside is between 18,865 and 19,024. The first level of resistance is around 20,000.
Nasdaq 100 (in USD), one-year daily chart
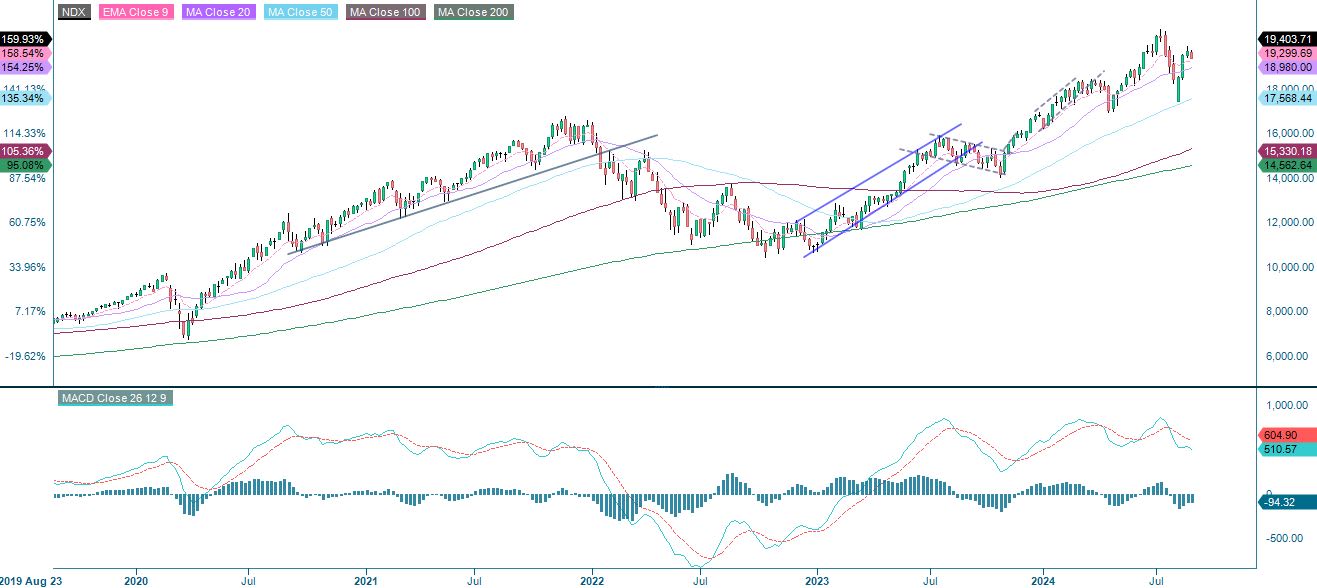
Nasdaq 100 (in USD), weekly five-year chart
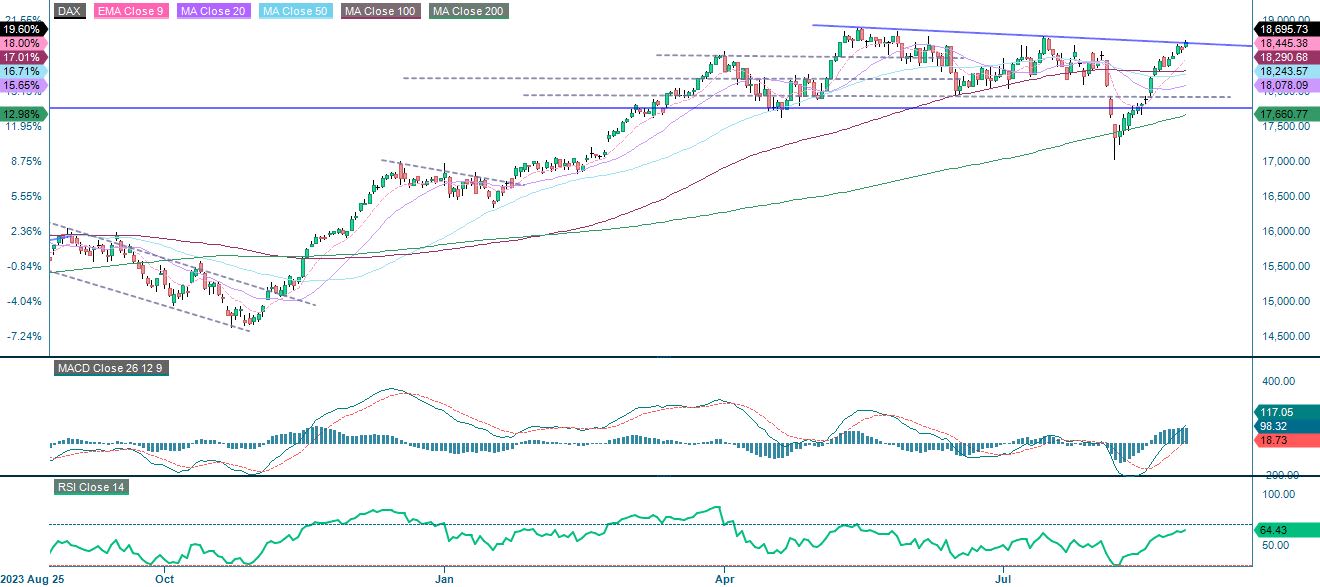
The German DAX is also trading at a crossroads. Triggers from the US could also act as triggers for the European indices.
DAX (in EUR), one-year daily chart
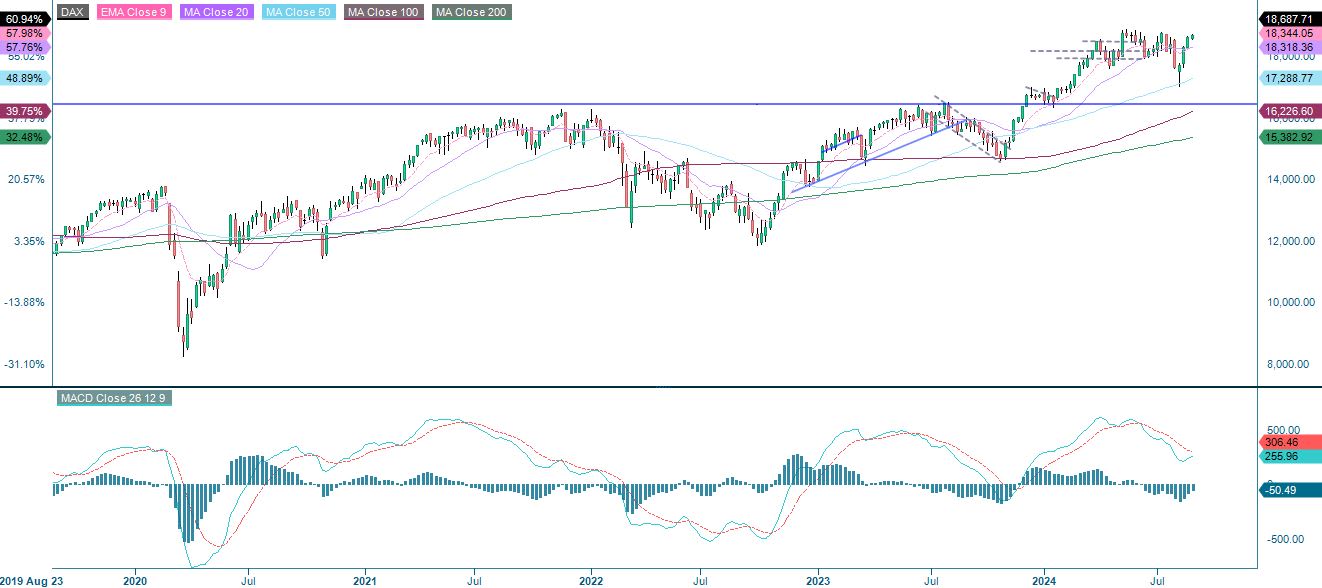
DAX (in EUR), one-year daily chart
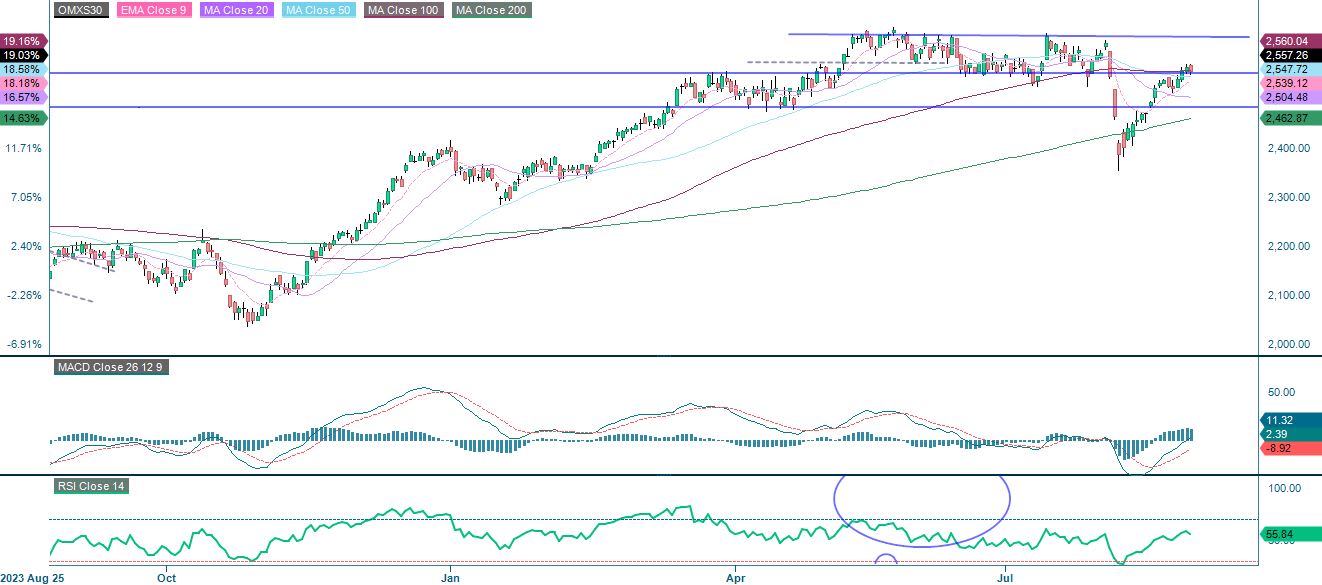
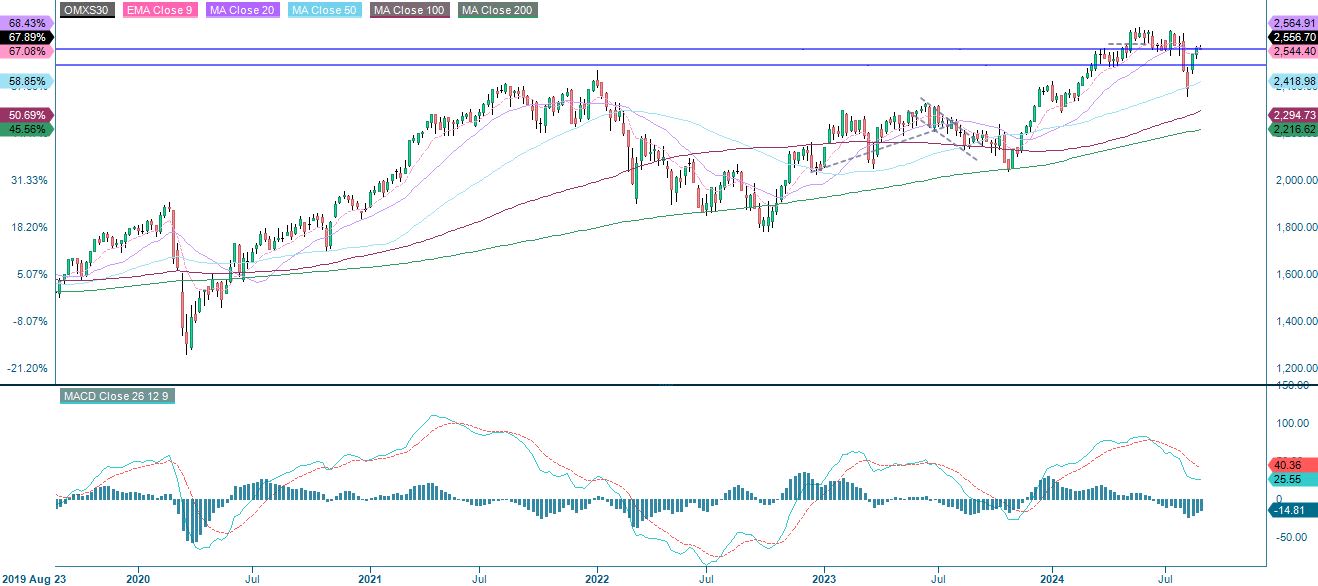
The same is true for the Swedish OMXS30. The next level on the upside is found around 2,630. On the downside, the next level is found around 2,500.
OMXS30 (in SEK), one-year daily chart
OMXS30 (in SEK), weekly five-year chart
The full name for abbreviations used in the previous text:
EMA 9: 9-day exponential moving average
Fibonacci: There are several Fibonacci lines used in technical analysis. Fibonacci numbers are a sequence in which each successive number is the sum of the two previous numbers.
MA20: 20-day moving average
MA50: 50-day moving average
MA100: 100-day moving average
MA200: 200-day moving average
MACD: Moving average convergence divergence
Risks
External author:
This information is in the sole responsibility of the guest author and does not necessarily represent the opinion of Bank Vontobel Europe AG or any other company of the Vontobel Group. This information is sponsored by Bank Vontobel Europe AG, which may be a counterparty to transactions involving the financial instruments discussed in this information. The further development of the index or a company as well as its share price depends on a large number of company-, group- and sector-specific as well as economic factors. When forming his investment decision, each investor must take into account the risk of price losses. Please note that investing in these products will not generate ongoing income.
The products are not capital protected, in the worst case a total loss of the invested capital is possible. In the event of insolvency of the issuer and the guarantor, the investor bears the risk of a total loss of his investment. In any case, investors should note that past performance and / or analysts' opinions are no adequate indicator of future performance. The performance of the underlyings depends on a variety of economic, entrepreneurial and political factors that should be taken into account in the formation of a market expectation.
Disclaimer:
This information is neither an investment advice nor an investment or investment strategy recommendation, but advertisement. The complete information on the products (securities) mentioned herein, in particular the structure and risks associated with an investment, are described in the base prospectus, together with any supplements, as well as the final terms relating to the securities. The base prospectus and final terms constitute the solely binding sales documents for the products mentioned herein. It is recommended that potential investors read these documents before making any investment decision. The documents and the key information document are published on the website of the issuer, Vontobel Financial Products GmbH, Bockenheimer Landstrasse 24, 60323 Frankfurt am Main, Germany, on https://prospectus.vontobel.com and are available from the issuer free of charge. The approval of the prospectus should not be understood as an endorsement of the securities. The securities are products that are not simple and may be difficult to understand. This information includes or relates to figures of past performance. Past performance is not a reliable indicator of future performance. This information may only be distributed or published in countries where such distribution or publication is permitted by applicable law. As stated in the relevant base prospectus, the distribution of the securities mentioned in this information is subject to restrictions in certain jurisdictions. This advertisement may not be reproduced or redistributed without prior permission by Vontobel.
© Bank Vontobel Europe AG and / or affiliated companies. All rights reserved.
Credit risk of the issuer:
Investors in the products are exposed to the risk that the Issuer or the Guarantor may not be able to meet its obligations under the products. A total loss of the invested capital is possible. The products are not subject to any deposit protection.
Market risk:
The value of the products can fall significantly below the purchase price due to changes in market factors, especially if the value of the underlying asset falls. The products are not capital-protected
Risk with leverage products:
Due to the leverage effect, there is an increased risk of loss (risk of total loss) with leverage products, e.g. Bull & Bear Certificates, Warrants and Mini Futures.
Product costs:
Product and possible financing costs reduce the value of the products.
Currency risk:
If the product currency differs from the currency of the underlying asset, the value of a product will also depend on the exchange rate between the respective currencies. As a result, the value of a product can fluctuate significantly.