Focus on inflation figures
The AMD share price has dropped by around 30% since March 2024. AMD still has rapid revenue growth prospects in the growing AI hardware market. Hence, the recent share price decline might be exaggerated. On the macro agenda, US and European inflation in July will be important because of its link to falling interest rates.
Case of the week: Advanced Micro Devices (AMD): Turning tides for AMD?
Back in March this year, we predicted that the high valuation of Advanced Micro Devices (AMD), combined with external risks, could lead to a decline in its share price over the coming months. Since then, the stock has fallen from $194.50 to $136.7 (as of 13 August), a decline of 29.8%. Since the beginning of the year, the share price has fallen by around 9%.
Recently, AMD reported strong Q2 results, beating revenue and earnings expectations with a 9% year-over-year increase in revenue and an 18% rise in operating income. The focus was on GPU revenues and the full-year data center GPU guidance. AMD generated over $1 billion in Q2 alone from its AI GPU (Graphics Processing Unit), the MI300X. Despite concerns about Microsoft reducing orders, AMD confirmed that Microsoft has expanded its use of the MI300X to power GPT-4 Turbo and several other services like Microsoft 365 Chat, Word, and Teams. Following this, AMD raised its GPU revenue guidance from around $4 billion to over $4.5 billion.
AMD’s MI300 revenues grew significantly, from over $400 million in Q4 2023 to over $600 million in Q1 2024, and then to over $1 billion in Q2 2024. This represents 50% growth from Q4 to Q1 and 66% growth from Q1 to Q2. While Nvidia’s overall numbers are larger, AMD's growth rate is much faster, indicating that AMD is quickly gaining revenue share against Nvidia. Given this rapid growth, the market may be underestimating the impact of AMD's MI300 ramp-up.
Despite strong GPU sales, AMD has faced challenges in the enterprise market due to a lagging software ecosystem. However, the company has taken steps to address this by acquiring Silo AI, Mipsology, and Nod.ai, and investing over $125 million in a dozen AI companies over the past year. AMD's management also highlighted that Hugging Face was among the first to use new Azure instances, enabling enterprise and AI customers to deploy hundreds of thousands of models on MI300X GPUs with just one click. As AMD's software matures, the company is beginning to secure more design wins, with enterprise vendors like Dell, HP, and Lenovo adopting the MI300. The enterprise ramp is expected to gain momentum in the second half of the year.
AMD is gaining data center GPU market share much faster than most realize—over four times quicker than it gained server CPU share against Intel. Forecasts suggesting AMD will only reach 10% market share by the end of 2025 might be too conservative. With the current adoption rate and more companies planning to use the MI300, AMD could easily surpass that 10% target. However, increasing investor skepticism about the AI hype and the risks we mentioned in March could still limit potential share price growth. That said, the rapid market share gains, the fast-growing AI hardware market, and the recent decline in share price could push AMD's share price higher as we head into the fall.
AMD (USD), one-year daily chart

AMD (USD), five-year weekly chart

Related Products
Macro comments
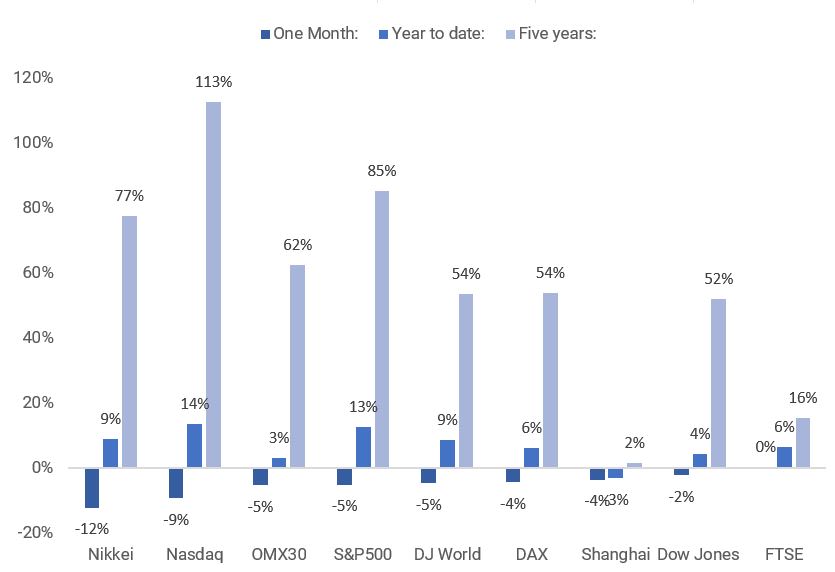
US equity markets rebounded somewhat at the end of last week, following sharp falls in the first week of August. As can be seen from the chart below, the Japanese stock market (Nikkei) suffered the most over the past month, falling 12%. The Nasdaq was the second worst performer, down 9%, while the Stockholm Stock Exchange was the third worst performer, down 5%.
One-month, year-to-date and five-year performance of major equity indices
As of Friday 9 August 2024, approximately 455 S&P 500 companies (91% of all companies) have reported their Q2 2024 results. 78% have reported positive earnings surprises, while 59% reported positive revenue surprises.
The best performing S&P50 sectors in terms of Q2 2024 earnings have been Health Care and Real Estate with 84% of their Q2 reports beating expectations, followed by Industrials with 81% ahead of estimates. Meanwhile, Communication Services, Consumer Staples and Consumer Discretionary are the worst performers, with only 73%, 71% and 70% of Q2 2024 earnings surpassing expectations.
The average earnings growth rate for S&P500 companies in Q2 2024 has decreased from 11.5% a week ago to 10.8% on 9 August. This is still better than the analyst’s estimates of 8.9% on 30 June 2024. The three best sectors in terms of Q2 2024 earnings growth are Utilities with 20.4% earnings growth, followed by Information Technology and Financials with 18.7% and 17.6% earnings growth respectively. The three worst performing sectors in terms of earnings growth are Consumer Staples, Industrials and Materials with 1.5%, minus 0.9% and minus 8.8% respectively.
Today, Wednesday 14 August, there will be interim reports from Cisco Systems and the Taiwaneese company Foxconn. Tomorrow, Thursday 15 August, quarterly reports from Applied Materials, Deere, Walmart and Alibaba are expected. On the macro agenda, there will be CPI figures in July from the UK, France and the US on Wednesday. China will release a bloc of statistics on Thursday morning with industrial production and investments in July being the most important. The same day industrial production in July in the US is due.
Can the short-term trend turn positive despite falling US yields?
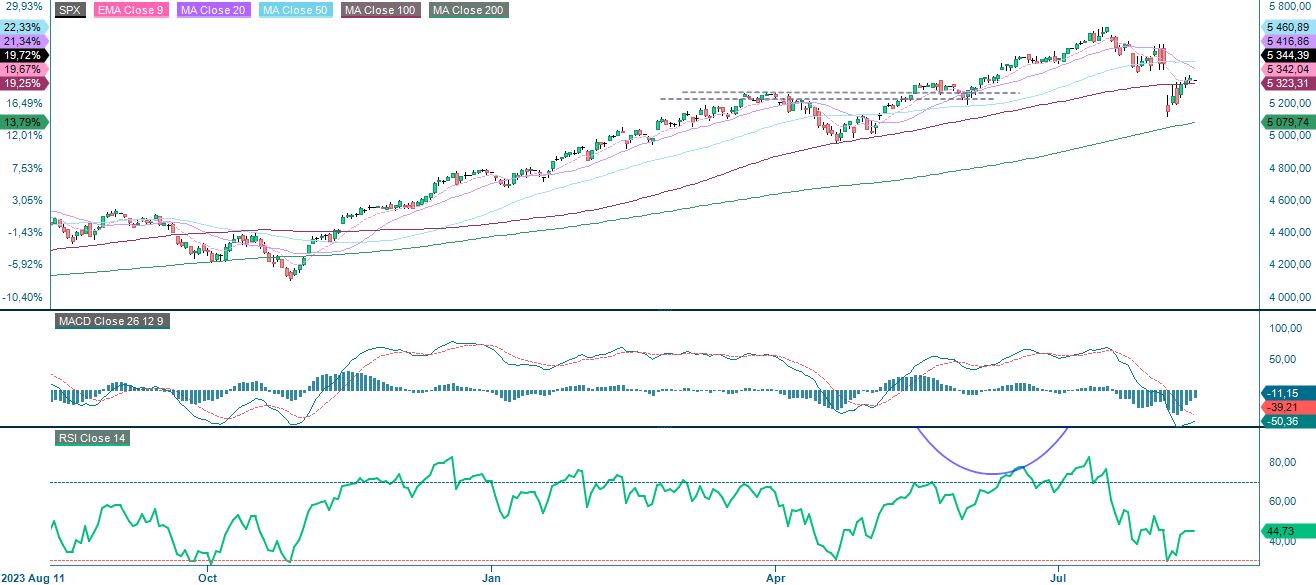
S&P 500 is currently trading up above MA100 and the next level on the upside is made up by MA20 at 5,417. A break above MA20 and the short-term trend can be seen as rising. However, well worth notiving are the yields. The 2-year US yield as well as the 10-year US yield has come down. This is somewhat worrysome in the short-term, Given that the decline in equities was triggered by increased fears of recession. Also, tomorrow’s inflation figures are not to be forgiven.
S&P 500 (in USD), one-year daily chart
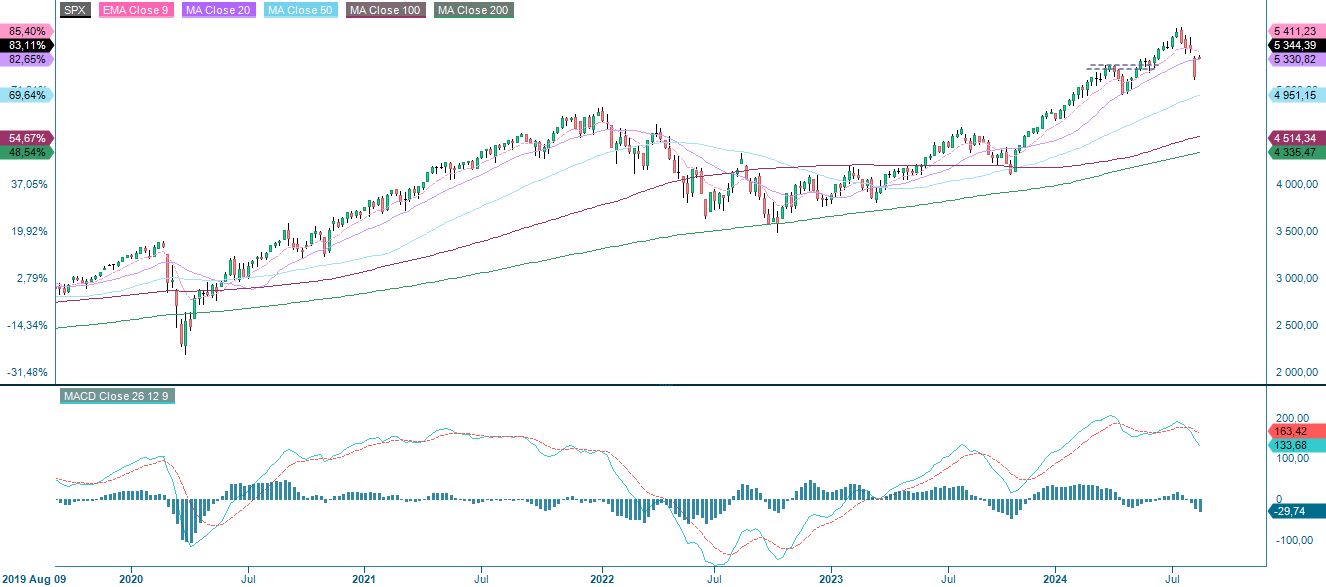
On the weekly chart, the S&P 500 is trading just above the MA20 at 5,330.
S&P 500 (in USD), weekly five-year chart
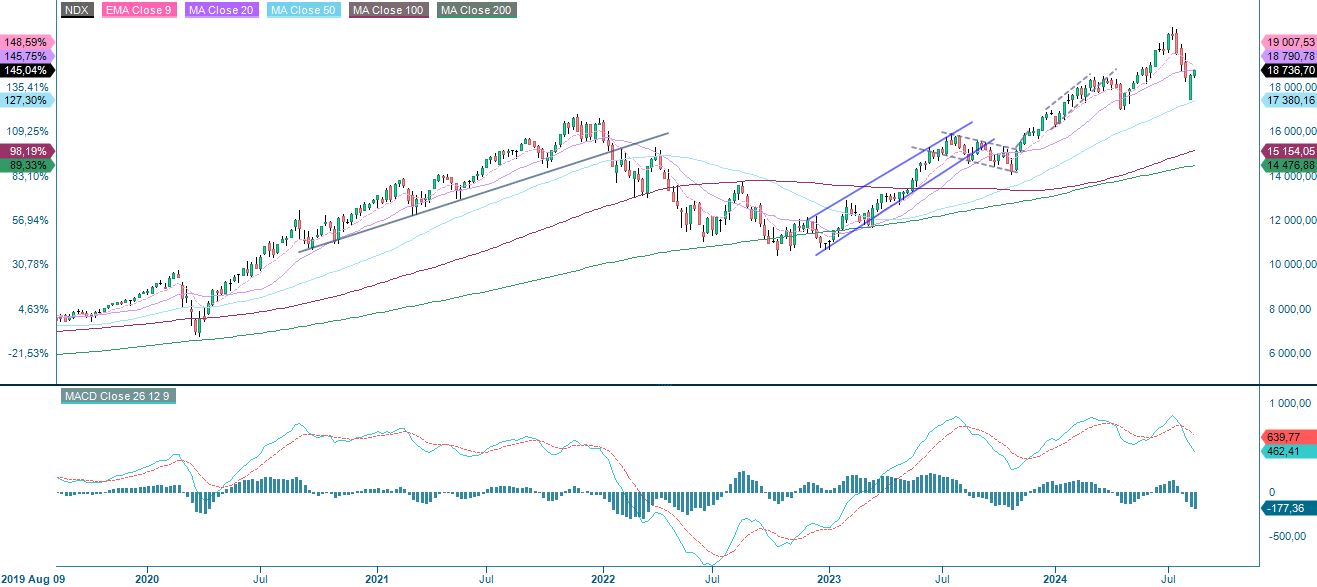
The Nasdaq 100 has yet to retake MA100, currently at 18,743, which acts as the first resistance on the upside. A break and MA20 at 18,987 could be next.
Nasdaq 100 (in USD), one-year daily chart

The weekly chart shows the Nasdaq 100 trading just above its MA20.
Nasdaq 100 (in USD), weekly five-year chart
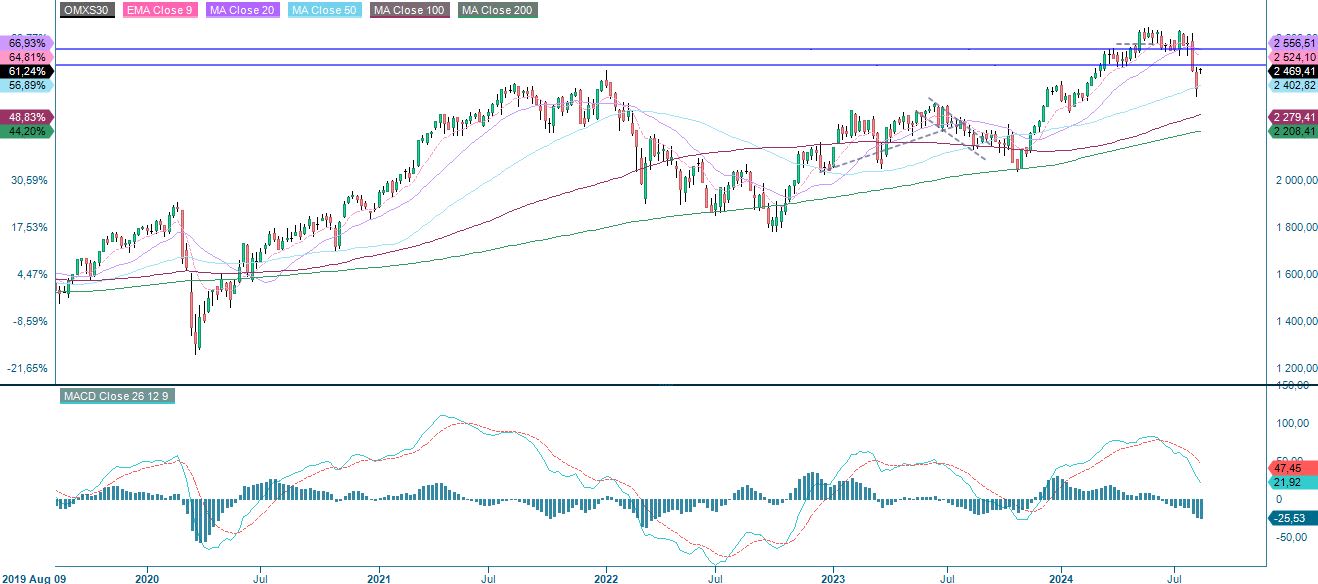
The OMXS30 is trading at EM9, which is the first level of resistance. A break to the upside and 2,522 could be next.
OMXS30 (in SEK), one-year daily chart
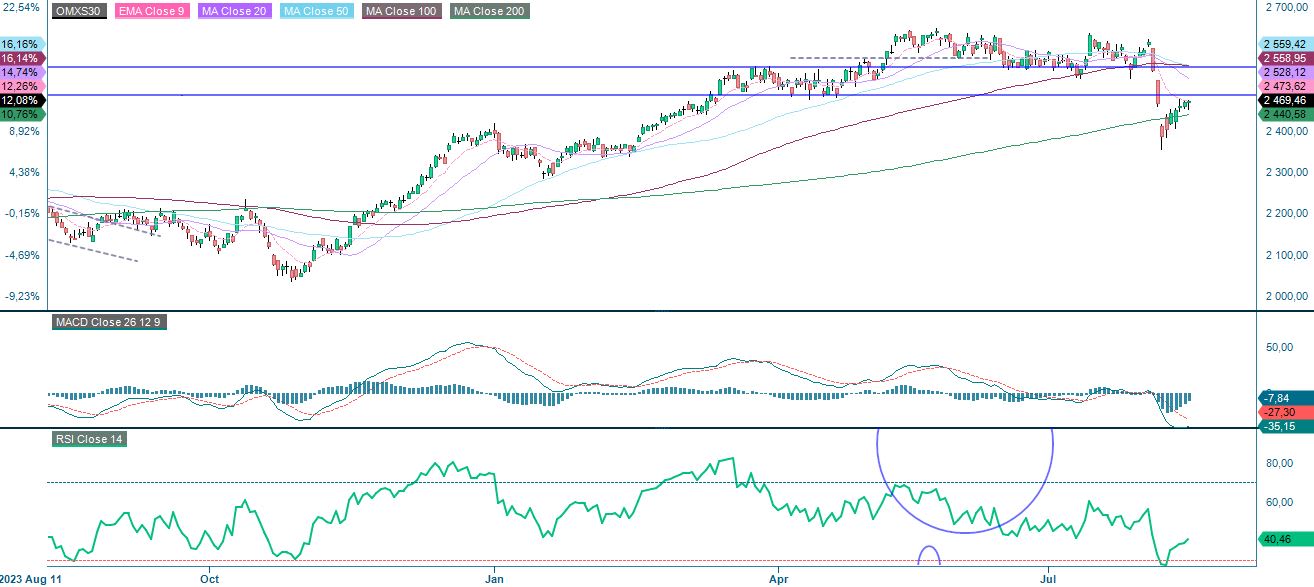
Resistance is approaching on the 5-year weekly chart.
OMXS30 (in SEK), weekly five-year chart
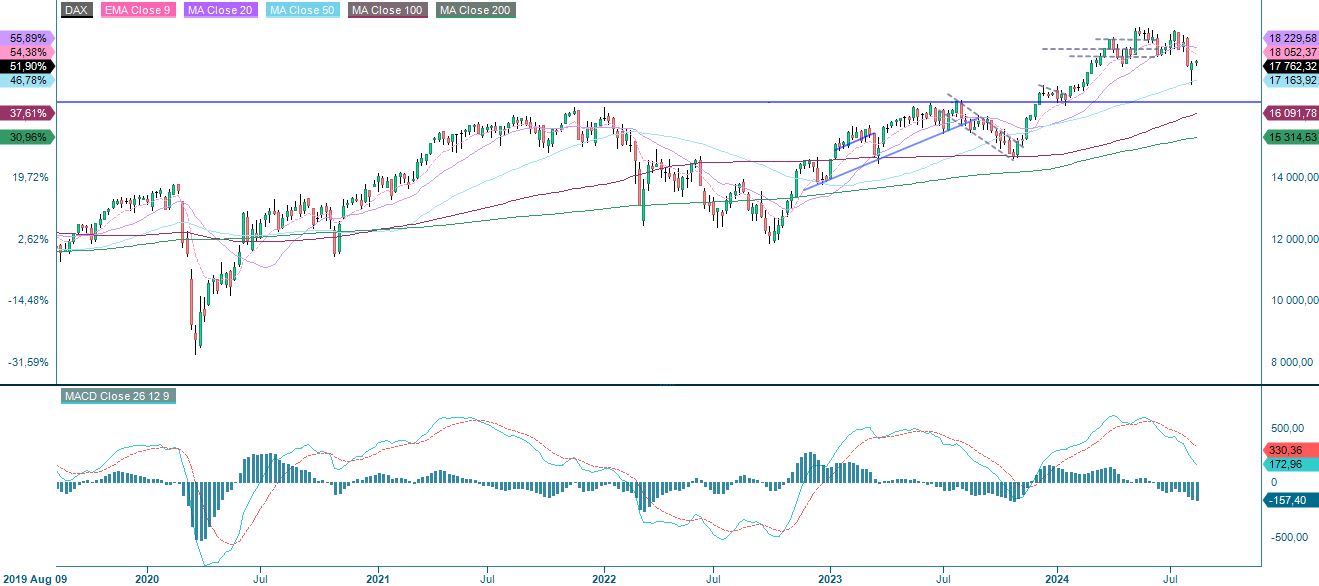
The German DAX is trading just above the EMA9 and the MA20 at 18,060 is the next level to the upside. A move towards these levels would also close the gap, an important milestone before the index can recoup all of its recent losses.
DAX (in EUR), one-year daily chart
DAX (in EUR), weekly five-year chart
The full name for abbreviations used in the previous text:
EMA 9: 9-day exponential moving average
Fibonacci: There are several Fibonacci lines used in technical analysis. Fibonacci numbers are a sequence in which each successive number is the sum of the two previous numbers.
MA20: 20-day moving average
MA50: 50-day moving average
MA100: 100-day moving average
MA200: 200-day moving average
MACD: Moving average convergence divergence
Risks
External author:
This information is in the sole responsibility of the guest author and does not necessarily represent the opinion of Bank Vontobel Europe AG or any other company of the Vontobel Group. This information is sponsored by Bank Vontobel Europe AG, which may be a counterparty to transactions involving the financial instruments discussed in this information. The further development of the index or a company as well as its share price depends on a large number of company-, group- and sector-specific as well as economic factors. When forming his investment decision, each investor must take into account the risk of price losses. Please note that investing in these products will not generate ongoing income.
The products are not capital protected, in the worst case a total loss of the invested capital is possible. In the event of insolvency of the issuer and the guarantor, the investor bears the risk of a total loss of his investment. In any case, investors should note that past performance and / or analysts' opinions are no adequate indicator of future performance. The performance of the underlyings depends on a variety of economic, entrepreneurial and political factors that should be taken into account in the formation of a market expectation.
Credit risk of the issuer:
Investors in the products are exposed to the risk that the Issuer or the Guarantor may not be able to meet its obligations under the products. A total loss of the invested capital is possible. The products are not subject to any deposit protection.
Market risk:
The value of the products can fall significantly below the purchase price due to changes in market factors, especially if the value of the underlying asset falls. The products are not capital-protected
Risk with leverage products:
Due to the leverage effect, there is an increased risk of loss (risk of total loss) with leverage products, e.g. Bull & Bear Certificates, Warrants and Mini Futures.
Product costs:
Product and possible financing costs reduce the value of the products.
Currency risk:
If the product currency differs from the currency of the underlying asset, the value of a product will also depend on the exchange rate between the respective currencies. As a result, the value of a product can fluctuate significantly.