Lower credit spreads reflected in rising HYG


After a sharp rise in the price of cattle, a report from a US Department (USDA) has caused this commodity to fall. We also note that credit spreads in the bond market between high-risk and low-risk issuers have narrowed, presumably reflecting improved risk sentiment.
Case of the week: Live cattle taken to pasture
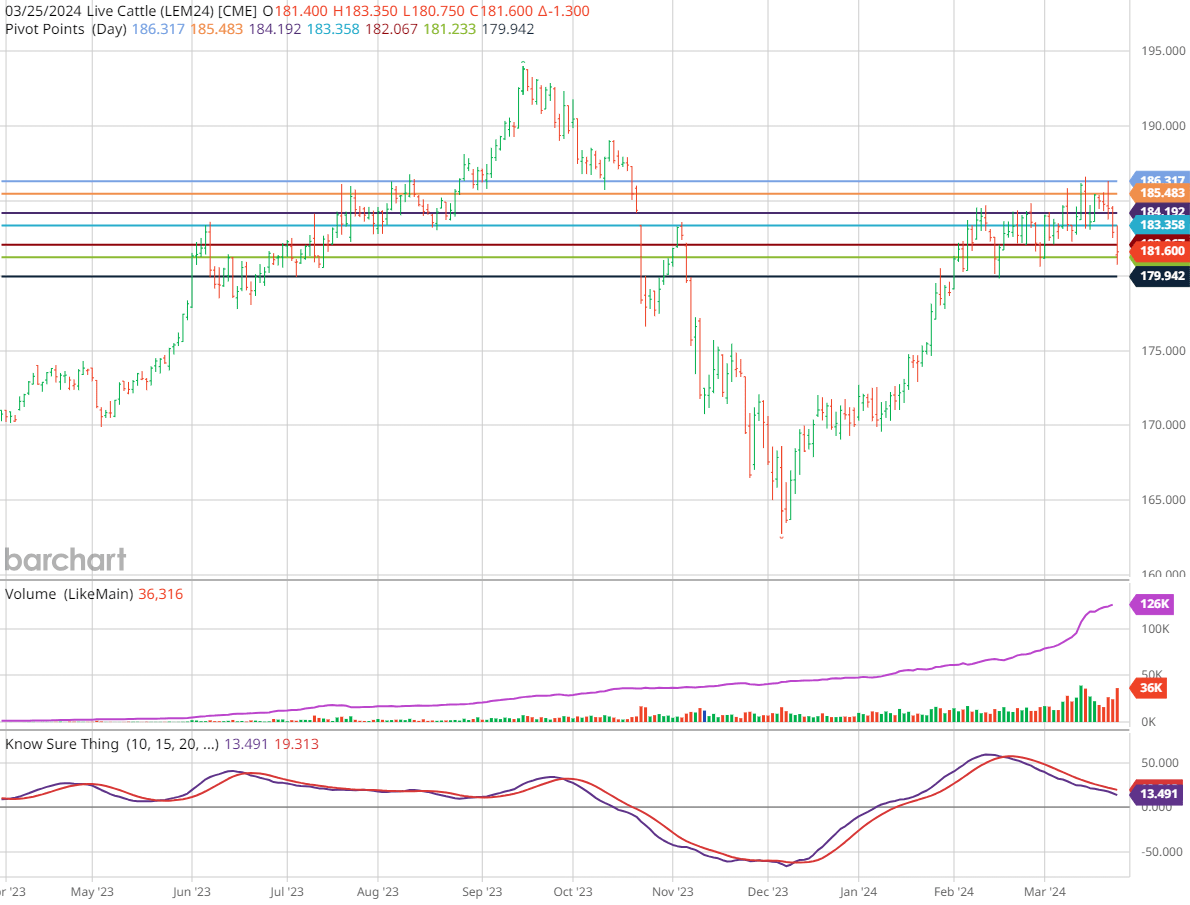
Live cattle prices hit the All-Time-High at a futures-price of 192 US cents/Lbs. Since then, however, prices have started to look fragile, with a Cattle on Feed (COF) report from the United States Department of Agriculture (USDA) causing bearish sentiment. We see prices continuing to fall, reaching a support level where a bounce could be possible.
Live cattle futures, which are based on cattle that have reached their target weight and are ready for slaughter, have trailed future prices on Feeder Cattle, when looking at the last 12 months. Feeder Cattle are calves that are not yet fat enough for slaughter at around 600-800 pounds (~260-360 kg). Zooming out to a five-year time frame, the two different categories trade in tandem, with a highly correlated (0.95) upward trend, with both up over +50%.


This spread is not unusual, nor is the pattern observed in 2023. On average, cattle prices tend to rise until late summer, when prices tend to level off. Of course, beef cannot be stored for long periods as easily as other commodities. As with grains, prices can be more closely correlated with consumption. Beef is consumed in greater quantities in the spring and early summer, when barbecues and fast food restaurants are more popular. As expected, this pattern does not always hold as there are more variables that affect prices. For example, temperatures and the price of feed grains such as corn also affect the number and weight of cattle, which in turn affects the price.
Looking at the past three months, live cattle have been trading in a slightly bullish channel since a pullback in mid-February. However, on the 22nd of March, the USDA released its Cattle on Feed (CoF) report, which added to the bearish sentiment. More precisely, the report revealed increased placements of cattle into feedlots during February as compared YoY, and with analyst expectations, at 1.90 million head of cattle, a 10% increase YoY. The price, at the time of writing at 181.6 US cents/Lb, appears to be falling towards a support level established in February at ~179.9 US cents/Lb. It could be likely that the price will bounce back from this level. Barring freak weather events or other exogenous shocks, we expect seasonality to kick in, with rising beef prices leading the way for live cattle. Should prices bounce off the aforementioned support level, we see the potential for prices to move towards the previous channel's resistance level of 192.9 US cents/Lbs during the spring. However, if support fails to hold, it is likely that prices will continue to slide into late summer, when corn prices typically fall. If so, this is similar to the previous dip in the KST indicator shown below.
Live Cattle (US cents/Lbs), one-year daily chart
Live Cattle (US cents/Lbs), five-year weekly chart

Macro comments
US equity markets were mixed on Friday 22nd March. Despite Friday's small decline, the S&P 500 still had its best week of the year to date, rising 2.3%. Much of the week's strong performance was driven by the so-called "Magnificent 7" companies, which rose more than 4%. However, the weighting of these stocks is now so high that it also makes the equity market and the S&P500 index more sensitive going forward.
The ten-year US Treasury yield is around 4.25%, a relatively "normal" level given the Federal Reserve's target of around 2% inflation and 2-2.5% real growth in the US economy.
The most important macroeconomic report this week is the US Personal Consumption Expenditures PCE deflator, which will be released on Friday 29th March. High yield credit spreads have narrowed recently. Below is a chart of the High-yield corporate bond ETF HYG reflecting its junk bond holdings.
US ETF HYG (in USD), five-year weekly chart

Today, Wednesday 27 March, H&M publishes its Q1 2023/2024 report. We also have the Swedish Riksbank's interest rate announcement and the Eurozone's economic barometer for March. On Thursday, 28th March, the US Michigan index for March is due.
Declining momentum for the S&P500
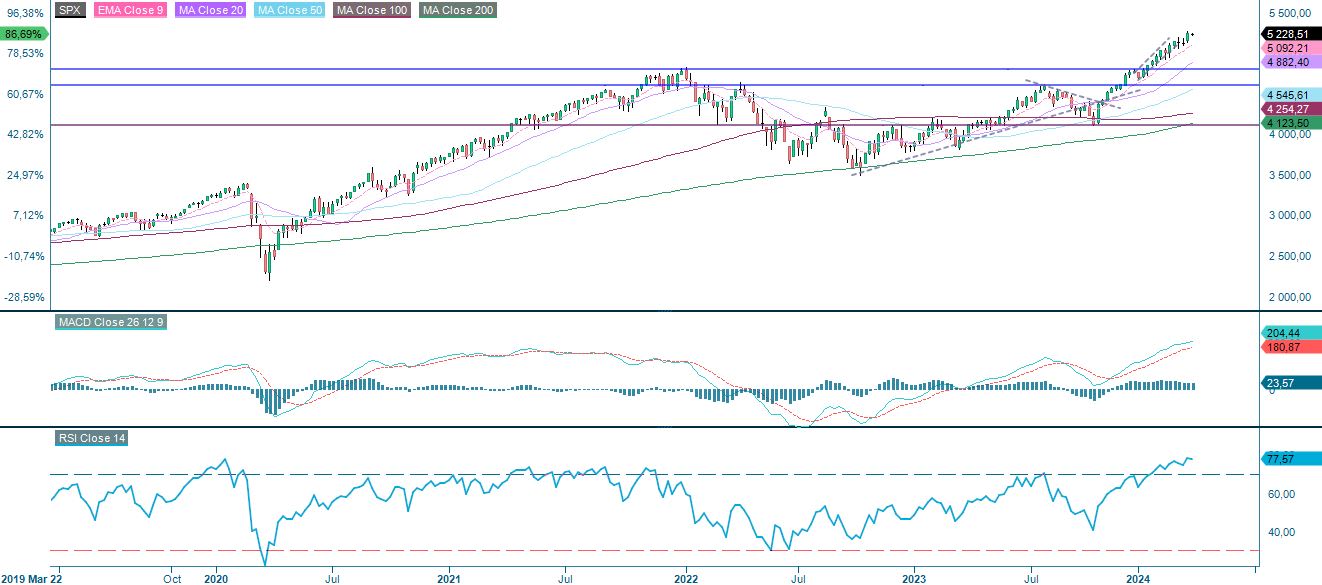
US interest rates have fallen in recent days. Meanwhile, the US equity indices continue to trade within a narrow rising trend channel. Momentum on the S&P 500 is falling, as indicated by the MACD. However, the short moving averages, EMA9 and MA20, are supporting further upside. Again, until a clear break of the MA20, why not just let the trend be your friend. A break and levels around 5,000 could be interesting buying opportunities.
S&P 500 (in USD), one-year daily chart

Note that the RSI on the weekly chart is showing overbought. However, this alone is not a signal to sell.
S&P 500 (in USD), weekly five-year chart
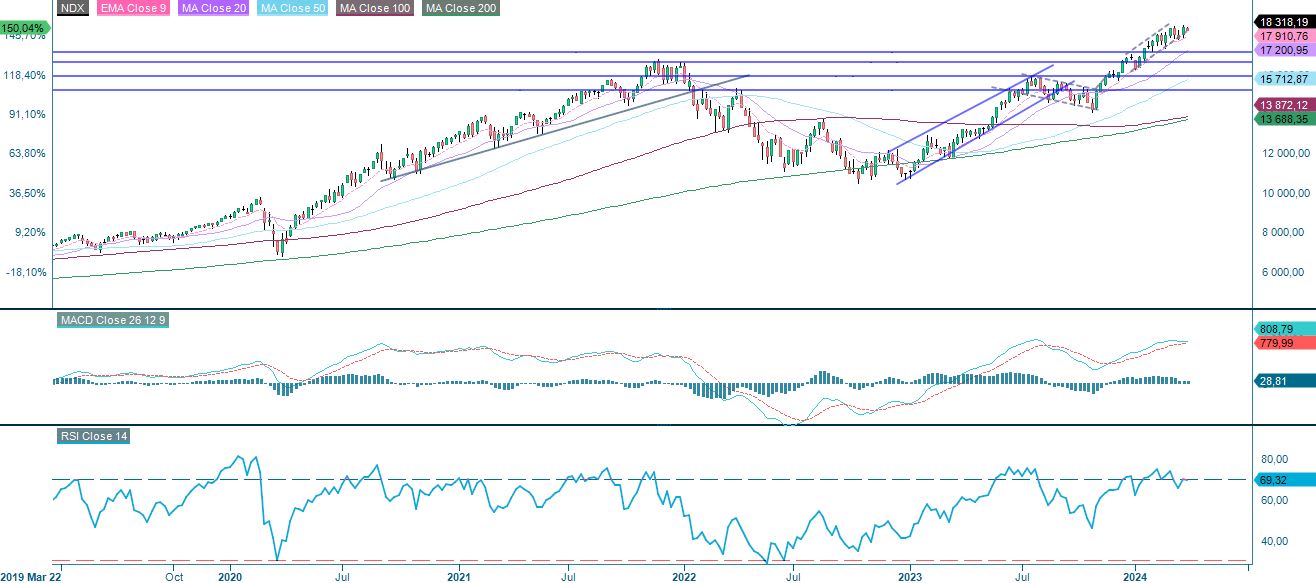
Momentum for the Nasdaq 100 is falling more sharply than for the broader S&P 500. However, the index is still trading above its shorter-term moving averages.
Nasdaq 100 (in USD), one-year daily chart

Nasdaq 100 (in USD), weekly five-year chart
In Sweden, the OMXS30 index is supported by EMA9. A break and levels around MA20 could be interesting levels to buy.
OMXS30 (in SEK), one-year daily chart

OMXS30 (in SEK), weekly five-year chart

The same goes for the German DAX.
DAX (in EUR), one-year daily chart
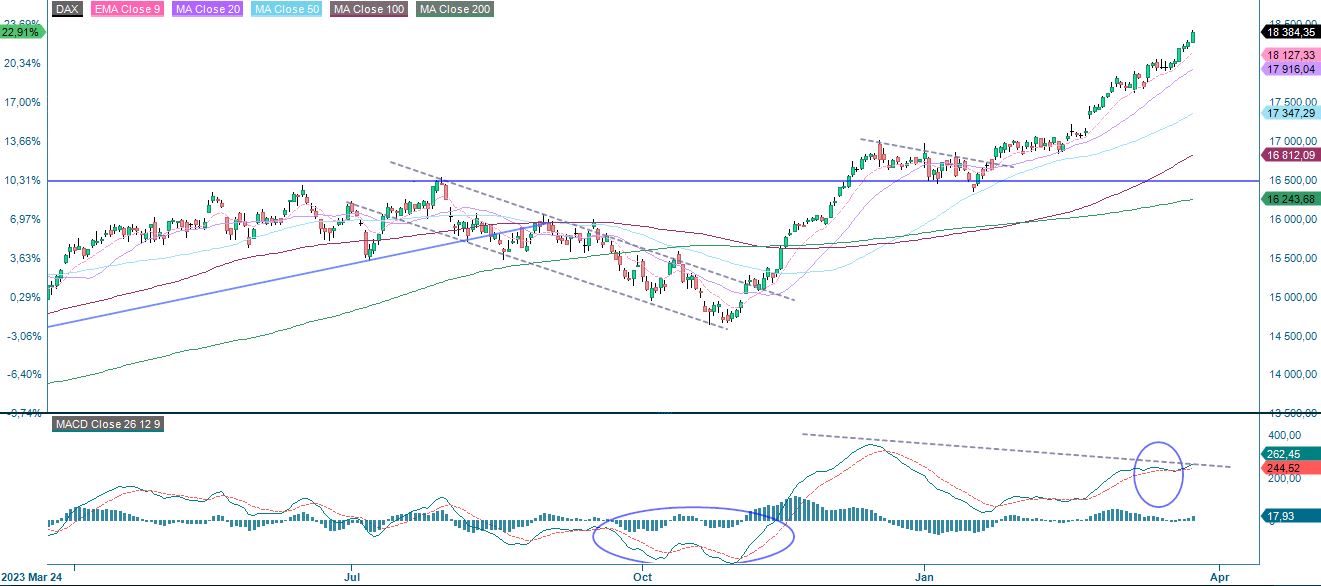
DAX (in EUR), weekly five-year chart

The full name for abbreviations used in the previous text:
EMA 9: 9-day exponential moving average
Fibonacci: There are several Fibonacci lines used in technical analysis. Fibonacci numbers are a sequence in which each successive number is the sum of the two previous numbers.
MA20: 20-day moving average
MA50: 50-day moving average
MA100: 100-day moving average
MA200: 200-day moving average
MACD: Moving average convergence divergence
Risks
External author:
This information is in the sole responsibility of the guest author and does not necessarily represent the opinion of Bank Vontobel Europe AG or any other company of the Vontobel Group. This information is sponsored by Bank Vontobel Europe AG, which may be a counterparty to transactions involving the financial instruments discussed in this information. The further development of the index or a company as well as its share price depends on a large number of company-, group- and sector-specific as well as economic factors. When forming his investment decision, each investor must take into account the risk of price losses. Please note that investing in these products will not generate ongoing income.
The products are not capital protected, in the worst case a total loss of the invested capital is possible. In the event of insolvency of the issuer and the guarantor, the investor bears the risk of a total loss of his investment. In any case, investors should note that past performance and / or analysts' opinions are no adequate indicator of future performance. The performance of the underlyings depends on a variety of economic, entrepreneurial and political factors that should be taken into account in the formation of a market expectation.
Credit risk of the issuer:
Investors in the products are exposed to the risk that the Issuer or the Guarantor may not be able to meet its obligations under the products. A total loss of the invested capital is possible. The products are not subject to any deposit protection.
Market risk:
The value of the products can fall significantly below the purchase price due to changes in market factors, especially if the value of the underlying asset falls. The products are not capital-protected
Risk with leverage products:
Due to the leverage effect, there is an increased risk of loss (risk of total loss) with leverage products, e.g. Bull & Bear Certificates, Warrants and Mini Futures.
Product costs:
Product and possible financing costs reduce the value of the products.
Currency risk:
If the product currency differs from the currency of the underlying asset, the value of a product will also depend on the exchange rate between the respective currencies. As a result, the value of a product can fluctuate significantly.