Some positive macro, but equity indices close to sell signals


This week's case is gold, where the fundamentals are solid. Gold's performance has been supported by the uncertain global environment with several wars raging. From a technical perspective, gold appears to be close to a near-term top. What the Fed says later today regarding its interest rate announcement will be important for the markets.
Case of the week: Gold at a crossroads ahead of Fed announcement
Uncertainty has boosted gold, but technical risks are to the downside
Gold traded at an all-time high of $2195 an ounce on 8th March 2024, taking its year-to-date gain to 5% and its 12-month gain to a whopping 19%. At the same time, the Gold Index was refreshed to an all-time high. What is behind gold's March rally?
First, the rise in the gold price is linked to investors' risk aversion. The Federal Reserve is more likely to enter the rate-cutting channel in the second half of 2024. The US dollar has tended to be weak, which has further contributed to increased gold holdings to avoid the risk of a falling US exchange rate. Second, global geopolitical uncertainty, with ongoing wars in Ukraine and Gaza and Yemeni rebels disrupting cargo traffic in the Red Sea, has continued to push gold prices higher.
In addition, central banks accumulated gold at the fastest pace on record in the first two months of 2023. According to the World Gold Council's Global Gold Demand Trend Report published earlier this year, annual net purchases of 1,037 tonnes almost matched the record set in 2022, falling just 45 tonnes short. Annual jewellery consumption held steady at 2,093 tonnes, even in the very high gold price environment. China's recovery underpinned this robust global total.
The US Producer Price Index (PPI), released on Thursday 14th March, rose more than expected in February. Other US data showed that initial jobless claims fell slightly, diminishing expectations of an imminent interest rate cut by the Federal Reserve. The 10-year US Treasury yield extended its uptrend, hitting a two-week high of 4.3%. In turn, gold came under renewed pressure. We can see that the upward momentum derived from the recent fluctuations is waning. Spot gold stood at $2159.99 per troy ounce on the 15th March, the first weekly decline since mid-February.
Volatility is expected to increase this week. Later today (Wednesday 20 March) the Fed will make an interest rate announcement. While market expectations for a March rate cut are close to zero, the press conference following the announcement will hopefully shed some light on the Fed's appetite for monetary easing. The Bank of England and the Swiss National Bank (SNB) will announce their interest rate decisions on Thursday 21 March. The market will also focus on the US weekly jobless claims, the Philadelphia Fed manufacturing survey and the Purchasing Managers Index PMI flash estimate on Thursday 21 March in its interpretation of global economic strength and the pace of inflation.
From a technical point of view, the price of gold has narrowed to the downside and a break below the support level of $2145.35 is likely to lead to further declines.
Gold (USD per troy ounce), one-year daily chart

Gold (USD per troy ounce), five-year weekly chart

Macro comments
Chinese macro data for January-February, released on Monday morning 18 March, were better than expected. Industrial production rose 7.0% versus expectations of +5.2% and investment rose 4.2% versus 3.2%. Retail sales growth of 5.5% was in line with consensus estimates. On the negative side, the real estate sector performed poorly, with investment down 9% and sales down 33% year-on-year.
Inflation continues to drive central banks. An interesting data point will be released today, Wednesday 20 March, in the form of German producer prices, which are usually a good indicator of eurozone inflation. Later we will get an interest rate announcement from the Fed (Wednesday 20 March) and the Bank of England (Thursday 21 March). Interest rates are ultimately determined by inflationary pressures. The rising oil price, which may have been influenced by Ukraine's drone attacks on Russian oil refineries, is a small cloud on the horizon. If inflation continues to fall, the central banks will soon start to lower their key rates, otherwise the process will be delayed.
Today, Wednesday 20 March, Next, Micron Technology and General Mills are scheduled to release their interim results, while tomorrow, Thursday 21 March, Accenture, BMW, Fedex, Lulemon Athletica and NIKE will report their quarterly results.
As the chart below shows, Japan's Nikkei has been by far the best performer of the world's major stock indices so far in 2024, up 20%.
Year-to-date, one-year and five-year performance of major stock indices

S&P500 still strong, but uptrend on the wane
The US indices are holding up surprisingly well despite the sharp rise in yields. However, as the chart below shows for the S&P 500, momentum is waning and the index is testing MA20. In the event of a break to the downside, the MA100, currently just south of 5,000, could be next. However, until the MA20 is broken, why not just let the trend be your friend.
S&P 500 (in USD), one-year daily chart

S&P 500 (in USD), weekly five-year chart

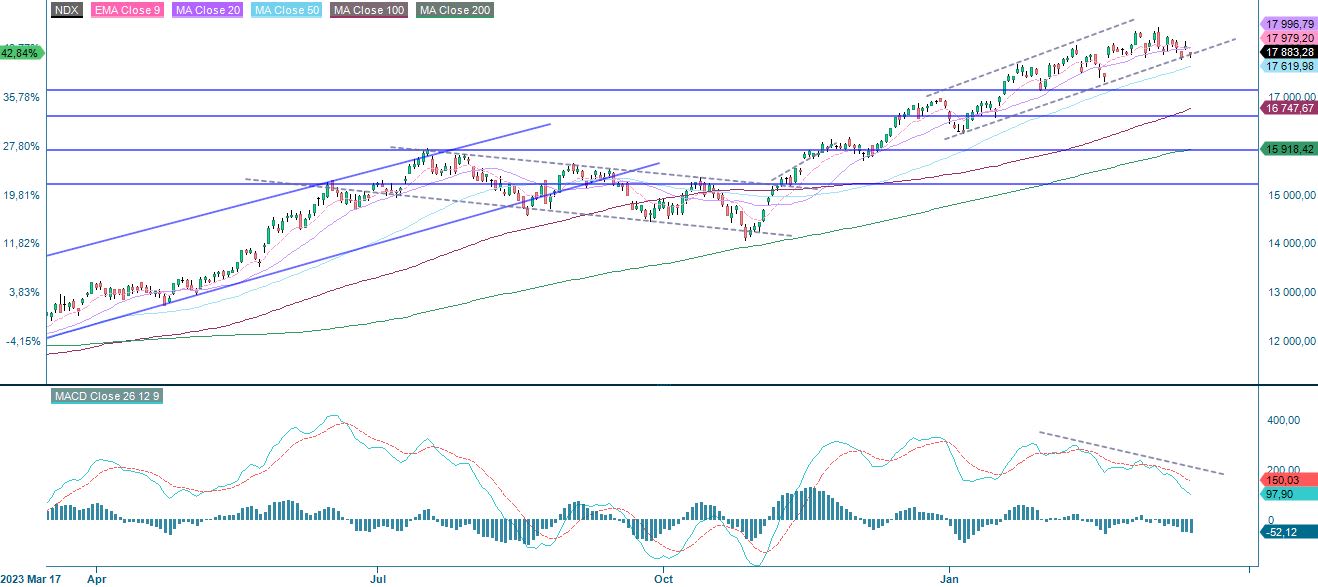
The Nasdaq 100 is currently trading below MA20 at the bottom of a narrow rising channel. A break below this level could take us to the MA100, currently at 17,620, and the 17,300 level. Also of note is the MACD on the weekly chart, which is about to generate a soft sell signal.
Nasdaq 100 (in USD), one-year daily chart
Nasdaq 100 (in USD), weekly five-year chart

The recent moves in the US have been linked to a rise in interest rates. However, as the chart below shows, the two-year US Treasury yield is approaching resistance.
Two-year US yield, weekly five-year chart

In Sweden, the OMXS30 fell sharply on Monday the 18th, but EMA9 seems to be holding for now. In case of a break, MA20 at 2,470 could be next.
OMXS30 (in SEK), one-year daily chart

OMXS30 (in SEK), weekly five-year chart

Note how the MACD has generated a soft sell signal as the German DAX continues to fly. EMA9 and MA20 act as the first and second levels of support.
DAX (in EUR), one-year daily chart

DAX (in EUR), weekly five-year chart

The full name for abbreviations used in the previous text:
EMA 9: 9-day exponential moving average
Fibonacci: There are several Fibonacci lines used in technical analysis. Fibonacci numbers are a sequence in which each successive number is the sum of the two previous numbers.
MA20: 20-day moving average
MA50: 50-day moving average
MA100: 100-day moving average
MA200: 200-day moving average
MACD: Moving average convergence divergence
Risks
External author:
This information is in the sole responsibility of the guest author and does not necessarily represent the opinion of Bank Vontobel Europe AG or any other company of the Vontobel Group. This information is sponsored by Bank Vontobel Europe AG, which may be a counterparty to transactions involving the financial instruments discussed in this information. The further development of the index or a company as well as its share price depends on a large number of company-, group- and sector-specific as well as economic factors. When forming his investment decision, each investor must take into account the risk of price losses. Please note that investing in these products will not generate ongoing income.
The products are not capital protected, in the worst case a total loss of the invested capital is possible. In the event of insolvency of the issuer and the guarantor, the investor bears the risk of a total loss of his investment. In any case, investors should note that past performance and / or analysts' opinions are no adequate indicator of future performance. The performance of the underlyings depends on a variety of economic, entrepreneurial and political factors that should be taken into account in the formation of a market expectation.
Credit risk of the issuer:
Investors in the products are exposed to the risk that the Issuer or the Guarantor may not be able to meet its obligations under the products. A total loss of the invested capital is possible. The products are not subject to any deposit protection.
Market risk:
The value of the products can fall significantly below the purchase price due to changes in market factors, especially if the value of the underlying asset falls. The products are not capital-protected
Risk with leverage products:
Due to the leverage effect, there is an increased risk of loss (risk of total loss) with leverage products, e.g. Bull & Bear Certificates, Warrants and Mini Futures.
Product costs:
Product and possible financing costs reduce the value of the products.
Currency risk:
If the product currency differs from the currency of the underlying asset, the value of a product will also depend on the exchange rate between the respective currencies. As a result, the value of a product can fluctuate significantly.