A strong market awaits next week's Fed decision


This week's case is Advanced Micro Devices, which is a way to get exposure to AI development other than Nvidia. However, AMD is trading at high multiples after its recent run-up. This week's macro focus is on last week's US employment report and US inflation figures. Next week's focus will be on the Fed and its interest rate policy.
Case of the week: Advanced Micro Devices
Will the market cool on AMD´s hot chip?
So far in 2024, Advanced Micro Devices' (AMD) share price has risen significantly, driven by enthusiasm surrounding the recent launch of the company's MI300A APUs and MI300X GPUs for AI, and further boosted by positive early sales data. While the potential for AMD to significantly increase sales in the coming quarters on the back of strong demand for AI chips is undeniable, the challenges of increasing competition from Nvidia and related risks in China cast doubt on the sustainability of AMD's current valuation. After the recent rally, AMD shares appear to be trading in overbought territory based on current valuation multiples, which may limit the potential for further near-term upside.
In terms of competition, Wall Street analysts expect AMD to struggle to compete with Nvidia in the coming quarters. Nvidia is expected to grow by 80% in the current fiscal year. In addition, Nvidia's data center operations alone generated $18.4 billion in Q4 2023, largely due to increased demand for its AI GPUs. In contrast, AMD's latest guidance is for $3.5 billion worth of AI chips by 2024, making it difficult for the company to overtake its rivals.
In terms of valuation, AMD's current market capitalisation of around $290bn is hard to justify given its trading multiples of almost 50x forward earnings and 11x forward sales. To put this in context, the average P/E for the S&P 500 is around 27x. With a forward Price-to-Earnings ratio P/E of 32x, Nvidia looks comparatively more attractive than AMD.
In addition, AMD faces significant external risks that could affect its ability to achieve its fiscal year targets. Approximately 22% of its revenue comes from China and Hong Kong, exposing the company to geopolitical challenges that could undermine its growth trajectory. Nvidia's management highlighted a notable decline in China-related revenues in Q4 2023 due to chip export restrictions, although this decline was offset by increased demand from other regions. However, once capacity issues are resolved and demand stabilises, there is a risk of a significant reduction in the chip industry's growth rate, especially if China imposes additional restrictions later in the year.
Taking all these factors into account, along with the recent rise in the share price, it may be possible to find other more attractive opportunities within the AI sector.
AMD (USD), one-year daily chart

AMD (USD), five-year weekly chart

Related Products
Macro comments
Stock markets in New York closed lower on Friday 8 March 2024, following a mixed interpretation of the US employment report for February. The S&P 500 was down 0.7% and the Nasdaq was down by 0.2%.
US payrolls rose by 275K in February. This beat expectations for an increase of 200K. At the same time, January's high figure was revised sharply downwards to 229K from the previously reported 353K. A monthly gain of around 100K is usually considered consistent with a balanced, non-inflationary US labour market.
The US unemployment rate rose to 3.9% during the month. The market had expected the rate to remain unchanged at 3.7%.Hourly earnings rose only moderately in February, by 0.1% month-on-month. A 0.3% increase had been expected.
This week will be dominated by inflation data. US inflation came in at an annual rate of 3.2% in February, against expectations of 3.1% on Tuesday 12th March. On Thursday the 14th we will get the US Producer Price Index (PPI), where the market is expecting a monthly increase of 0.3% in February, which would be equivalent to 0.9% year-on-year growth.
The market is in a wait-and-see mode ahead of the Fed's interest rate announcement on Wednesday the 20th March.
US PPI year-on-year January 2022-February 2024, actual and forecast

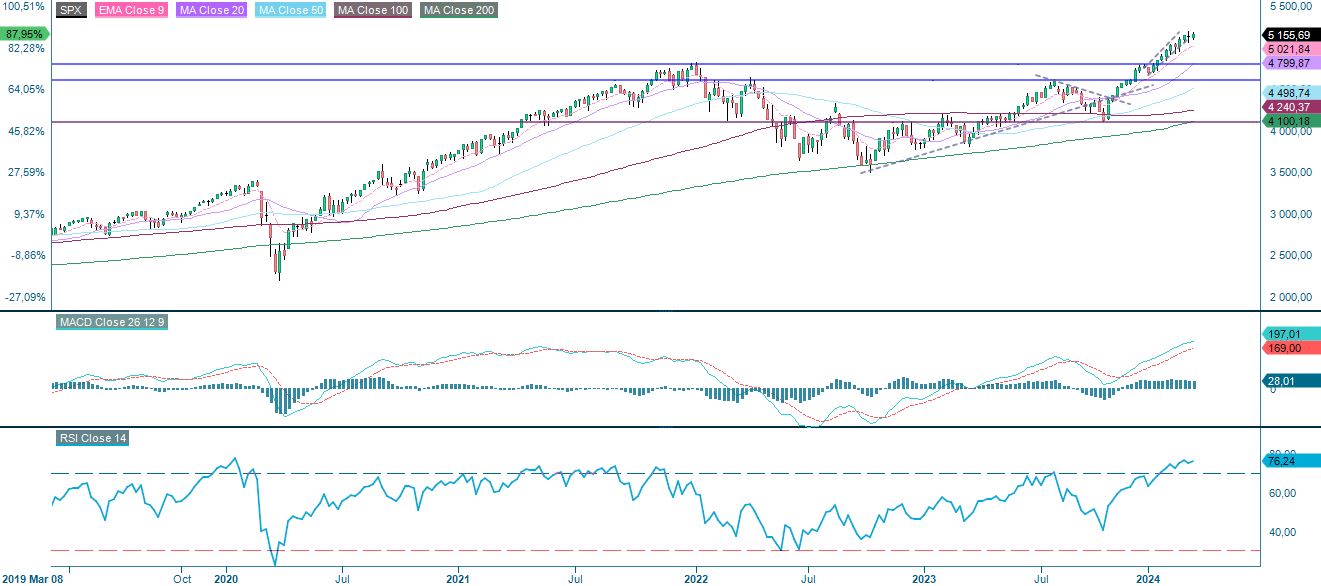
S&P in uptrend channel, but risk of setback
The S&P 500 is currently trading higher despite the US CPI coming in line with expectations and some negative deviations in minor components. The index is supported by rising EMA9 and MA20, as well as the bottom of a narrow rising trend channel. As long as the MA20 holds, the trend should be your friend. However, note that rates are rising and a break to the downside and the index could quickly fall towards levels around 5,000 as the index is quite overbought.
S&P 500 (in USD), one-year daily chart

S&P 500 (in USD), weekly five-year chart
The same goes for the Nasdaq 100.
Nasdaq 100 (in USD), one-year daily chart

Nasdaq 100 (in USD), five-year weekly chart

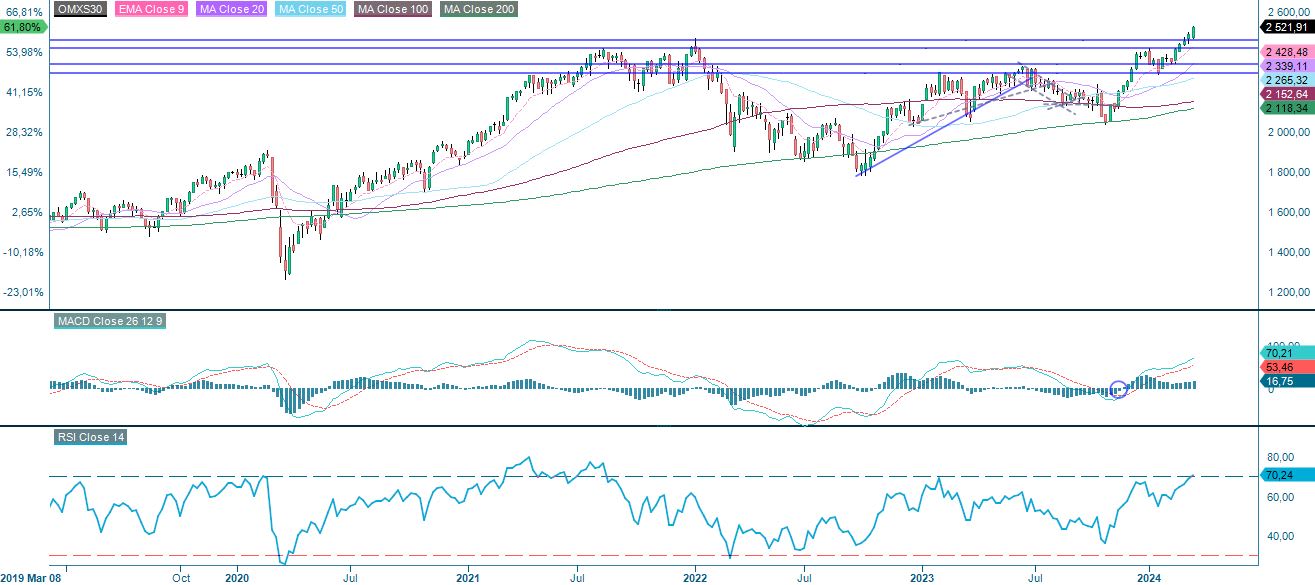
The OMXS30 had one of its better days in a long time, driven by Volvo. However, the index still has some catching up to do with the other major indices.
OMXS30 (in SEK), three-year daily chart

OMXS30 (in SEK), weekly five-year chart
Supported by rising EMA9 and MA20, the DAX continues to fly.
DAX (in EUR), three-year daily chart

DAX (in EUR), weekly five-year chart

The full name for abbreviations used in the previous text:
EMA 9: 9-day exponential moving average
Fibonacci: There are several Fibonacci lines used in technical analysis. Fibonacci numbers are a sequence in which each successive number is the sum of the two previous numbers.
MA20: 20-day moving average
MA50: 50-day moving average
MA100: 100-day moving average
MA200: 200-day moving average
MACD: Moving average convergence divergence
Risks
External author:
This information is in the sole responsibility of the guest author and does not necessarily represent the opinion of Bank Vontobel Europe AG or any other company of the Vontobel Group. This information is sponsored by Bank Vontobel Europe AG, which may be a counterparty to transactions involving the financial instruments discussed in this information. The further development of the index or a company as well as its share price depends on a large number of company-, group- and sector-specific as well as economic factors. When forming his investment decision, each investor must take into account the risk of price losses. Please note that investing in these products will not generate ongoing income.
The products are not capital protected, in the worst case a total loss of the invested capital is possible. In the event of insolvency of the issuer and the guarantor, the investor bears the risk of a total loss of his investment. In any case, investors should note that past performance and / or analysts' opinions are no adequate indicator of future performance. The performance of the underlyings depends on a variety of economic, entrepreneurial and political factors that should be taken into account in the formation of a market expectation.
Credit risk of the issuer:
Investors in the products are exposed to the risk that the Issuer or the Guarantor may not be able to meet its obligations under the products. A total loss of the invested capital is possible. The products are not subject to any deposit protection.
Market risk:
The value of the products can fall significantly below the purchase price due to changes in market factors, especially if the value of the underlying asset falls. The products are not capital-protected
Risk with leverage products:
Due to the leverage effect, there is an increased risk of loss (risk of total loss) with leverage products, e.g. Bull & Bear Certificates, Warrants and Mini Futures.
Product costs:
Product and possible financing costs reduce the value of the products.
Currency risk:
If the product currency differs from the currency of the underlying asset, the value of a product will also depend on the exchange rate between the respective currencies. As a result, the value of a product can fluctuate significantly.