Lower rates and orange juice opportunity


This week's case is orange juice, where there may be an opportunity for a short-term rally in commodity futures. The rally in US markets continues, fuelled by falling interest rates over the last five trading days. There is still a gap to close between the OMX and the DAX.
Case of the week: Orange juice could be squeezed
After a meteoric rise that saw Frozen Concentrated Orange Juice (FCOJ) reached an All-time high of over USD 4.00/Lb, the price has been choppy. Hedge funds have piled into both cocoa and FCOJ as meteorological variables have had a significant bullish impact on the respective commodities. There may be an opportunity for a short term rally in FCOJ before a medium to long term squeeze pulls prices back.
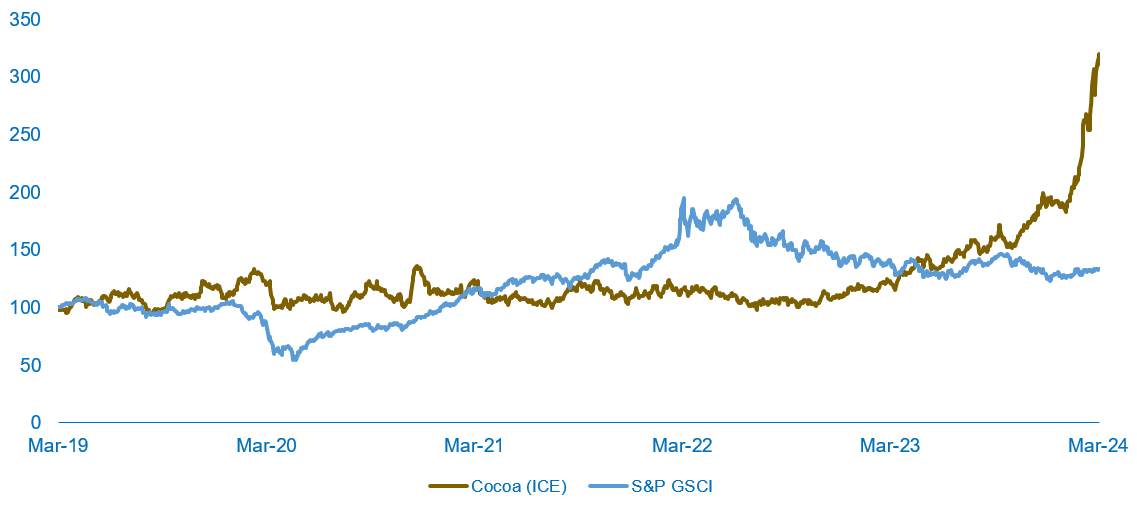
Orange juice, or more specifically FCOJ, has seen a surge in interest and speculation due to its rapidly rising price. Since January 2022, the futures price has risen from just under USD 1.50/Lb to over 3.60/Lb. The sharp rise in price is only partly due to indirect inflationary pressures. Looking at FCOJ in particular, variables similar to those that contributed to the similarly historic rally in cocoa, namely disease and weather, have had a major impact. These factors have helped both commodities to outperform other benchmarks by a wide margin.
Orange Juice and Cocoa vs S&P 500 and S&P GSCI Commodity Index (all in USD) (indexed to 2023-03-06)

Cocoa vs S&P GSCI Commodity Index (in USD, indexed to 2019-03-06)
Oranges are grown mainly in São Paulo, Brazil, and Florida, USA, with the two regions together accounting for 85% of the world market. The difference between the regions is that Brazil exports almost all of its production, while the USA consumes almost 90% of the orange juice it produces. In terms of outbound exports, Brazil is followed by Mexico, with an honourable mention for Egypt, a country that is fast becoming a major player in the FCOJ export market. The USA, together with Europe, accounts for most of the demand for orange juice, although the negative trend in demand until recently has leveled off.
In terms of diseases, oranges face the citrus greening disease, often abbreviated as "HLB", referring to its etymological Chinese root word huánglóngbìng. It is a citrus-specific disease transmitted by vectors such as psyllid insects. After arriving in the US in 2005, it has spread and now affects most US orchards, reducing production. There is currently no cure for HLB, although Invaio Sciences announced regulatory approval to suppress HLB in August last year. The disease has played a major role in driving up the price of orange juice, but as steps are taken to research and control the disease, an easing of supply concerns could help drive the price down.
In terms of the second major variable that has contributed to the strong price performance, the weather, conditions have been dominated by the El Niño climate phenomenon. For Florida orchards, this is experienced as an extended Pacific jet stream bringing colder temperatures and increased rainfall. As the orchards are mainly located in the two southern thirds of Florida, this means a lower risk of freezing, but they are not immune. The effect is most pronounced during the winter months of December to February. The opposite is true for Brazil. In both the winter and summer months, December to February and June to August, warmer and drier temperatures are caused by the El Niño-Southern Oscillation, or ENSO. The excessive dryness has had a severe impact on orchards, particularly in the São Paulo region, pushing prices even higher.
El Niño climate phenomenon in winter and summer months

In summary, FCOJ prices have rallied mainly due to a combination of bad weather caused by the ENSO climate phenomenon and disease in the form of HLB. Demand, which for the most part has been in steady decline, has leveled off. Without a sudden improvement in weather conditions, there is not an exhaustive list of triggers that could push prices down in the short term. Looking at the momentum in the futures market, it is possible that prices could rally back towards $4.00/lb. However, in the medium to long term, HLB suppression and possibly better weather in key growing areas such as Florida, São Paulo and Egypt could lead to an increase in supply. This would logically help to push FCOJ prices back towards USD 3.00/Lb.
Orange Juice (US cents/Lbs), one-year daily chart

Orange Juice (US cents/Lbs), five-year weekly chart

Macro comments
As of Thursday 29 February 2024, approximately 485 S&P500 companies have reported their fourth quarter results. 73% of S&P companies have reported a positive EPS surprise and 64% have reported a positive revenue surprise.
For the fourth quarter of 2023, earnings growth for S&P500 companies has risen to 4.0%, up from 1.6% four weeks ago.
For Q1 2024, 71 S&P500 companies have issued negative EPS guidance and 30 S&P500 companies have issued positive earnings guidance. For Q1 2024, analysts are forecasting earnings and revenue growth of 3.6% for S&P500 companies.
Quarterly reports from Broadcom and Costco Wholesale are due on Thursday 7 March.
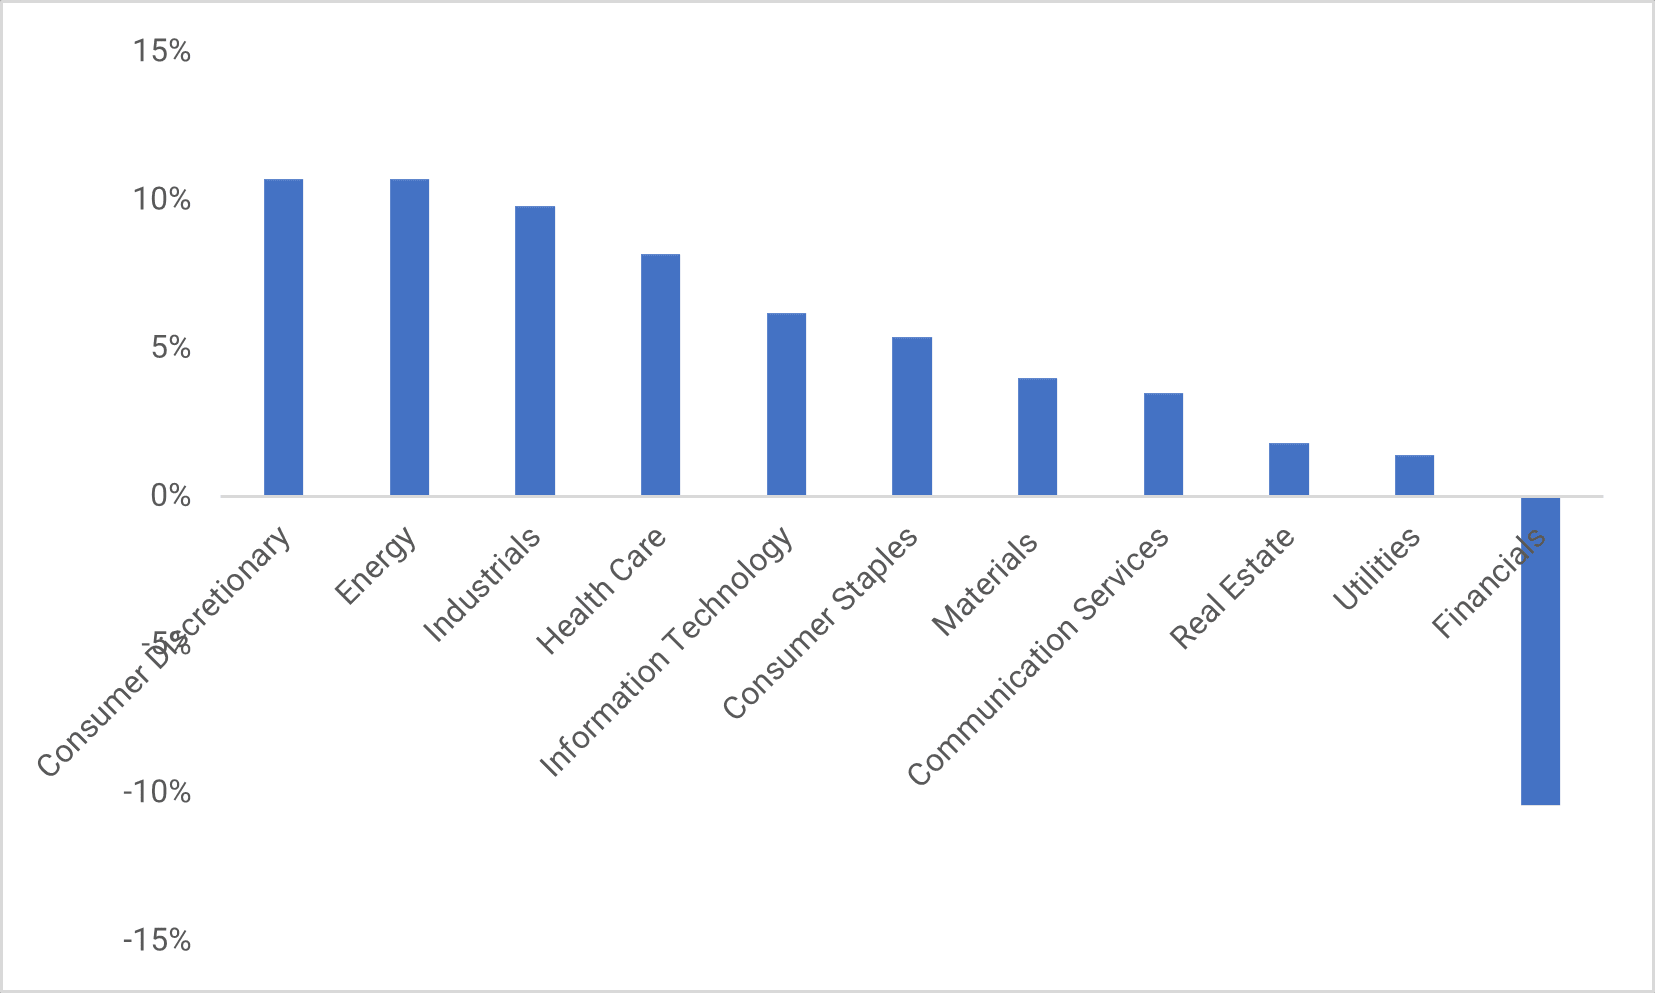
S&P500 Sector-Level Earnings Surprise Q4 2023 (in %)
The ECB will hold a rate announcement on Thursday 7 March, where the key rate is expected to remain unchanged. The market will be looking for Lagarde's comments on how the ECB views inflation and whether it is still seen as falling.
Long OMX, short DAX could still be an interesting spread
The rally in the US markets continues, fuelled by falling interest rates over the last five trading days. All moving averages are pointing higher. Negative divergence is again the only cloud on the horizon for the S&P 500 from a technical momentum perspective. A break below 5,000 and a subsequent move towards 4,900 as a second resistance level could change the mood. Interesting buying opportunities could be found around these levels.
S&P 500 (in USD), one-year daily chart

S&P 500 (in USD), weekly five-year chart

A negative divergence can also be seen on the Nasdaq 100. A break below 17,850 and a subsequent move towards 17,350 could create interesting buying opportunities.
Nasdaq 100 (in USD), one-year daily chart

Nasdaq 100 (in USD), weekly five-year chart

The OMXS30 reached a new all-time high (closing). Nevertheless, the index has underperformed the two US Indices since the beginning of 2024.
OMXS30 (in SEK), three-year daily chart

OMXS30 (in SEK), weekly five-year chart

The OMXS30 has also underperformed the German DAX year-to-date. Long OMXS30 and short DAX can still be an interesting spread.
DAX (in EUR), one-year daily chart

DAX (in EUR), weekly five-year chart

The full name for abbreviations used in the previous text:
EMA 9: 9-day exponential moving average
Fibonacci: There are several Fibonacci lines used in technical analysis. Fibonacci numbers are a sequence in which each successive number is the sum of the two previous numbers.
MA20: 20-day moving average
MA50: 50-day moving average
MA100: 100-day moving average
MA200: 200-day moving average
MACD: Moving average convergence divergence
Risks
External author:
This information is in the sole responsibility of the guest author and does not necessarily represent the opinion of Bank Vontobel Europe AG or any other company of the Vontobel Group. This information is sponsored by Bank Vontobel Europe AG, which may be a counterparty to transactions involving the financial instruments discussed in this information. The further development of the index or a company as well as its share price depends on a large number of company-, group- and sector-specific as well as economic factors. When forming his investment decision, each investor must take into account the risk of price losses. Please note that investing in these products will not generate ongoing income.
The products are not capital protected, in the worst case a total loss of the invested capital is possible. In the event of insolvency of the issuer and the guarantor, the investor bears the risk of a total loss of his investment. In any case, investors should note that past performance and / or analysts' opinions are no adequate indicator of future performance. The performance of the underlyings depends on a variety of economic, entrepreneurial and political factors that should be taken into account in the formation of a market expectation.
Credit risk of the issuer:
Investors in the products are exposed to the risk that the Issuer or the Guarantor may not be able to meet its obligations under the products. A total loss of the invested capital is possible. The products are not subject to any deposit protection.
Market risk:
The value of the products can fall significantly below the purchase price due to changes in market factors, especially if the value of the underlying asset falls. The products are not capital-protected
Risk with leverage products:
Due to the leverage effect, there is an increased risk of loss (risk of total loss) with leverage products, e.g. Bull & Bear Certificates, Warrants and Mini Futures.
Product costs:
Product and possible financing costs reduce the value of the products.
Currency risk:
If the product currency differs from the currency of the underlying asset, the value of a product will also depend on the exchange rate between the respective currencies. As a result, the value of a product can fluctuate significantly.