A long stay and some catching up for OMX


This week we look at Airbnb, which delivered a strong Q4 2023 report and which we continue to see as an interesting investment. The recent rally in the S&P500 has been largely unexplained. However, the OMX still has some ground to make up against its peers such as the US indices and the DAX.
Case of the week: Still time to buy Airbnb shares
Airbnb posted Q4 2023 earnings that beat Wall Street analysts' forecasts. The Easter effect is expected to support Q1 2024 numbers. Airbnb has several qualities that make it a good investment. These include its pricing, its expansion outside the US, but also its share buyback programme, which is supported by healthy financials.
Airbnb ended 2023 with another strong quarter. Q4 revenue was $2.2 billion, up 17% year over year. The company saw robust growth in the number of nights and experiences booked, reaching a record 98.8 million in the final quarter. Adjusted EBITDA was $738 million, representing an adjusted EBITDA margin of 33%, up 6% year-over-year. Airbnb also beat earnings expectations. Reported EPS was $0.76, compared to expectations of $0.67.
Reported net loss was $349 million in the fourth quarter due to an income tax settlement with Italy. Included in the report is a provision for host country withholding taxes of approximately $931 million, which will be used to pay 576 million euros to settle a long-standing dispute over unpaid taxes in Italy. Free cash flow for the full year was $3.8 billion, the highest ever.
The company forecast Q1 2024 revenues that would meet or exceed Wall Street expectations. Airbnb is forecasting slightly more revenue in Q1 2024, largely due to the timing of Easter, which will move to Q1 2024 instead of Q2 2024.
In addition, Airbnb initiated a $6 billion share repurchase programme. This programme has allowed Airbnb to offset the impact of the vesting of employee stock awards. This strategic move is part of the company's efforts to reinvest in itself, signalling its intention to become more diversified. It also aims to maintain its financial stability in the face of increasing regulatory scrutiny and slowing revenue growth.
In addition. Airbnb has demonstrated an extraordinary ability to generate net interest income due to its healthy balance sheet. This makes it look like a financial services company.
The company has improved its price display, aiming to make Airbnb a more affordable and reliable option. Customers would be able to see the full price breakdown, including service fees, discounts and taxes. The company has also focused on developing the international market, particularly in Europe, and unlocking more growth opportunities by investing in an underpenetrated market. In addition, the company will invest in expanding "beyond the core", which includes adding artificial intelligence-based applications.
In addition, Airbnb plans to offer a one-click service as a one-stop shop for all travel needs, such as linking flights and car rentals to room bookings and ordering ride-hailing services, which would allow Airbnb to compete with the likes of Bookings.com and Uber.
Compared to the consistency and security offered by the hotel, Airbnb can offer different choices and experiences. The company has a natural advantage in the travel industry. Hotels have to deal with the burden of maintaining physical properties, while Airbnb has the ability to quickly control supply and offer customers a wider range of options. This is an advantage that is difficult for a hotel to replicate.
The biggest risk for Airbnb is regulation. The platform has been accused of inflating housing prices, straining resources and fuelling overtourism. In Barcelona, private room rentals have been restricted. Hosts cannot rent a room for less than 31 days. Portugal has stopped issuing new Airbnb licences. In September 2023, New York City passed a law banning short-term rentals. In Amsterdam, apartments can only be rented out for a maximum of 30 days per year. Canada is also considering new rules for short-term rentals.
Airbnb (USD), one-year daily chart

Airbnb (USD), five-year weekly chart

Macro comments
The S&P 500 gained 1.66% last week. The S&P 500 Technology, Consumer Discretionary and Communication Services sectors led the way.
The Fed's preferred measure of inflation, the PCE, will be released on Thursday 29th February. It will be the most important data point of the week for the bond and equity markets, as the US CPI for January came in higher than expected (3.3% versus 3.1%).
US PCE for January is expected to have risen by 0.4%, which would represent an increase of 2.8% year-on-year.
US 2-year Treasury Yield (in %), one-year daily chart

US 2-year Treasury Yield (in %), five-year weekly chart

Friday 1 March will be dominated by the February manufacturing PMIs from Japan, China, India, Russia, Sweden, Spain, Italy, France, Germany, the Eurozone, the UK, Brazil and the US.
Industrial companies in several countries are still signalling contraction, but the worst is probably behind us. The unrest in the Red Sea could still lead to supply disruptions. For this reason, in addition to the main PMI indices, the focus will be on the price indices and delivery times.
Negative divergence is somewhat worrisome
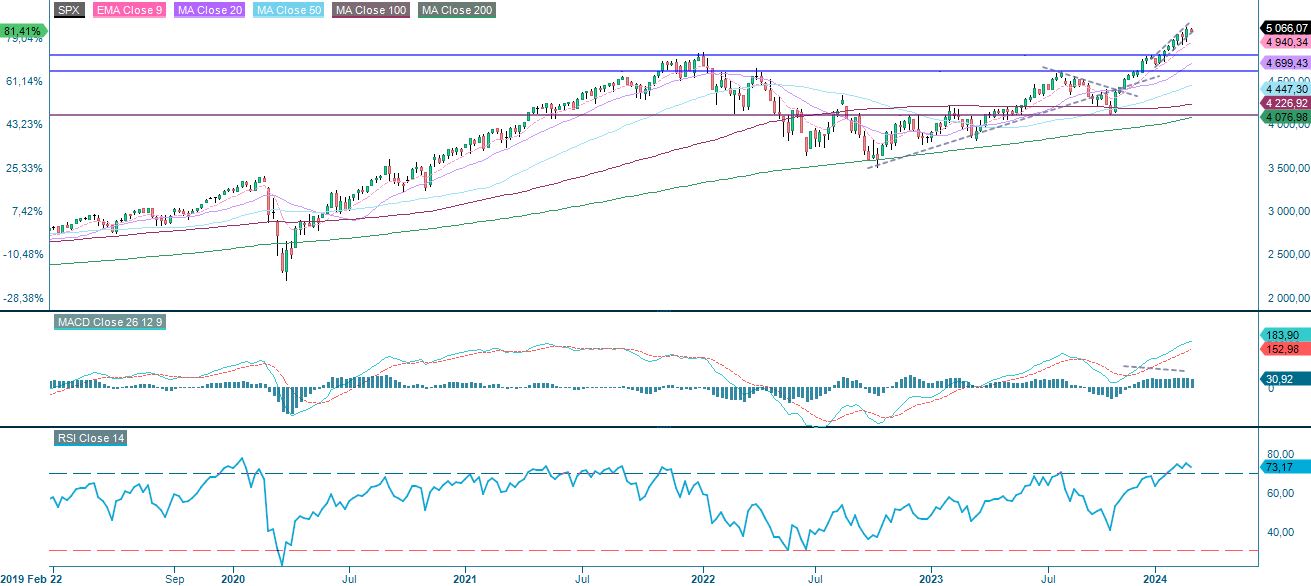
The S&P 500 has broken above the psychologically important 5,000 level. This is despite lowered expectations for interest rate cuts in 2024. So we do not see any clear drivers other than perhaps improved risk appetite and a slight increase in earnings estimates for 2024. From a technical point of view, the negative divergence between the index and the MACD (as well as the RSI) is somewhat worrying. However, a break below the bottom of the narrow rising trend channel and the MA20, which is currently just below 5,000, could trigger a major setback.
S&P 500 (in USD), one-year daily chart

S&P 500 (in USD), weekly five-year chart
A negative divergence is also spotted in the Nasdaq 100. Note how the index has difficulties breaking up above the psychologically important 18,000 level.
Nasdaq 100 (in USD), one-year daily chart

Nasdaq 100 (in USD), weekly five-year chart

OMXS30 has some catching up to do against its US indices peers. Momentum is rising, and 2,500 may be next.
OMXS30 (in SEK), three-year daily chart

OMXS30 (in SEK), weekly five-year chart

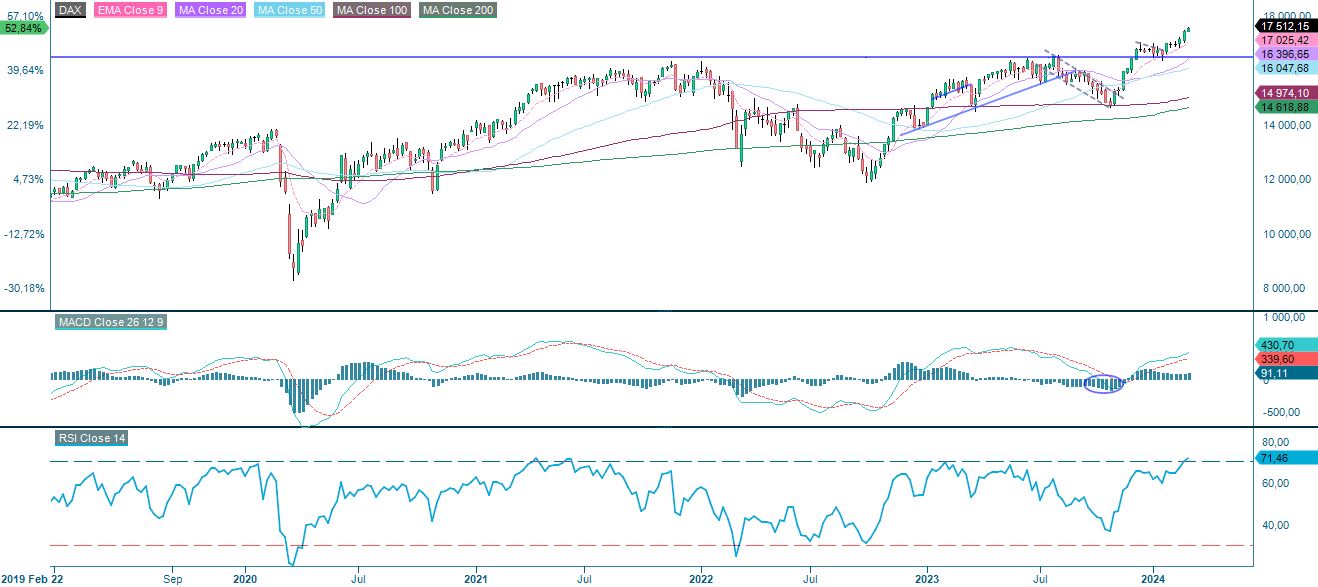
OMXS30 also has some catching up on the German DAX. Perhaps long OMXS30 short DAX can be an interesting spread.
DAX (in EUR), one-year daily chart

DAX (in EUR), weekly five-year chart
The full name for abbreviations used in the previous text:
EMA 9: 9-day exponential moving average
Fibonacci: There are several Fibonacci lines used in technical analysis. Fibonacci numbers are a sequence in which each successive number is the sum of the two previous numbers.
MA20: 20-day moving average
MA50: 50-day moving average
MA100: 100-day moving average
MA200: 200-day moving average
MACD: Moving average convergence divergence
Risks
External author:
This information is in the sole responsibility of the guest author and does not necessarily represent the opinion of Bank Vontobel Europe AG or any other company of the Vontobel Group. This information is sponsored by Bank Vontobel Europe AG, which may be a counterparty to transactions involving the financial instruments discussed in this information. The further development of the index or a company as well as its share price depends on a large number of company-, group- and sector-specific as well as economic factors. When forming his investment decision, each investor must take into account the risk of price losses. Please note that investing in these products will not generate ongoing income.
The products are not capital protected, in the worst case a total loss of the invested capital is possible. In the event of insolvency of the issuer and the guarantor, the investor bears the risk of a total loss of his investment. In any case, investors should note that past performance and / or analysts' opinions are no adequate indicator of future performance. The performance of the underlyings depends on a variety of economic, entrepreneurial and political factors that should be taken into account in the formation of a market expectation.
Credit risk of the issuer:
Investors in the products are exposed to the risk that the Issuer or the Guarantor may not be able to meet its obligations under the products. A total loss of the invested capital is possible. The products are not subject to any deposit protection.
Market risk:
The value of the products can fall significantly below the purchase price due to changes in market factors, especially if the value of the underlying asset falls. The products are not capital-protected
Risk with leverage products:
Due to the leverage effect, there is an increased risk of loss (risk of total loss) with leverage products, e.g. Bull & Bear Certificates, Warrants and Mini Futures.
Product costs:
Product and possible financing costs reduce the value of the products.
Currency risk:
If the product currency differs from the currency of the underlying asset, the value of a product will also depend on the exchange rate between the respective currencies. As a result, the value of a product can fluctuate significantly.